
Houses for sale & to rent in Chalvey, Slough
House Prices in Chalvey
Properties in Chalvey have an average house price of £299k and had 269 Property Transactions within the last 3 years¹.
Chalvey is an area in Slough, Slough with 3,995 households², where the most expensive property was sold for £625k.
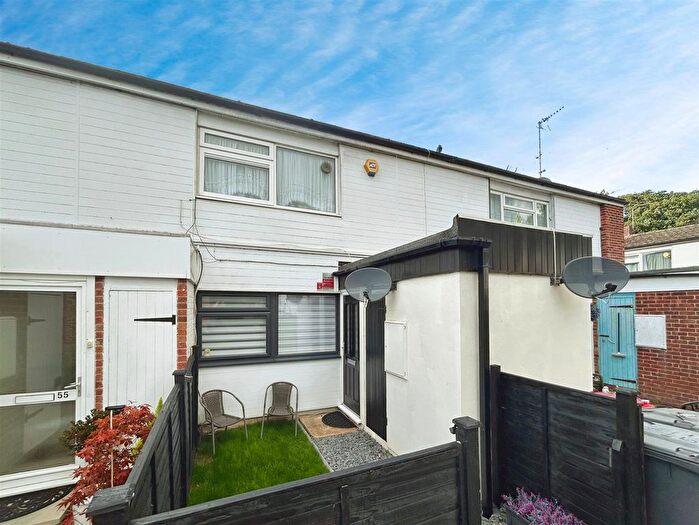
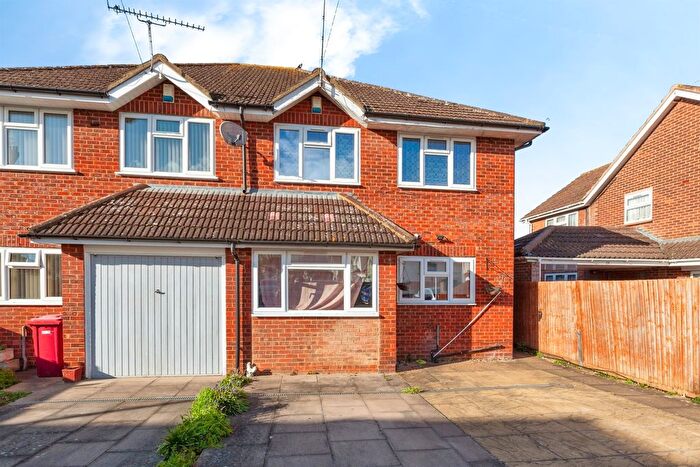
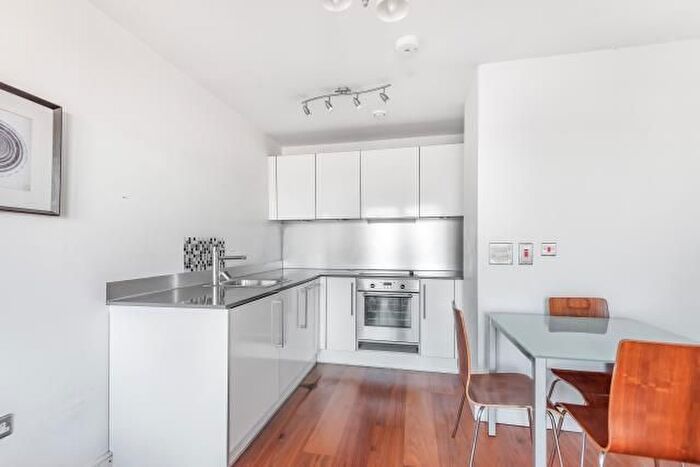
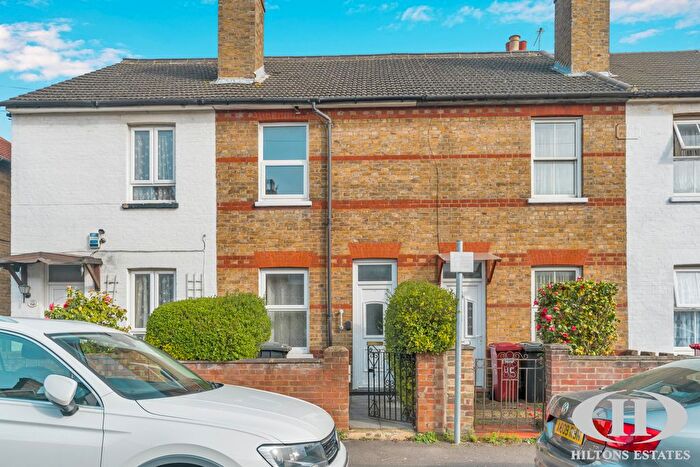
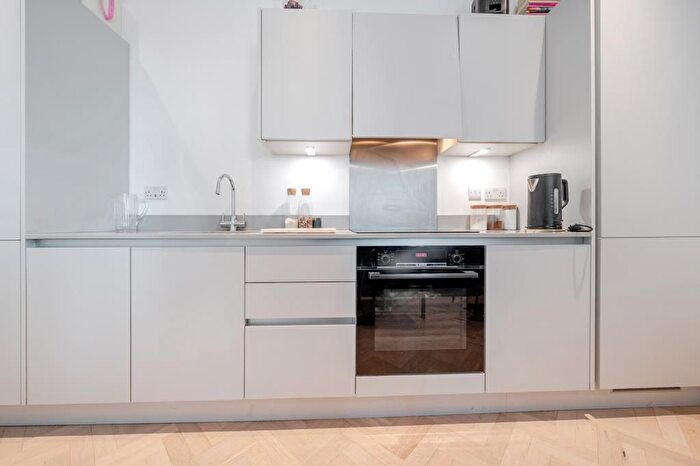
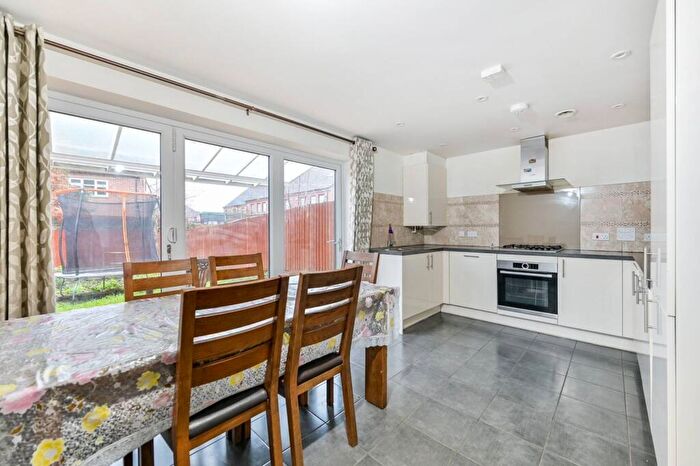
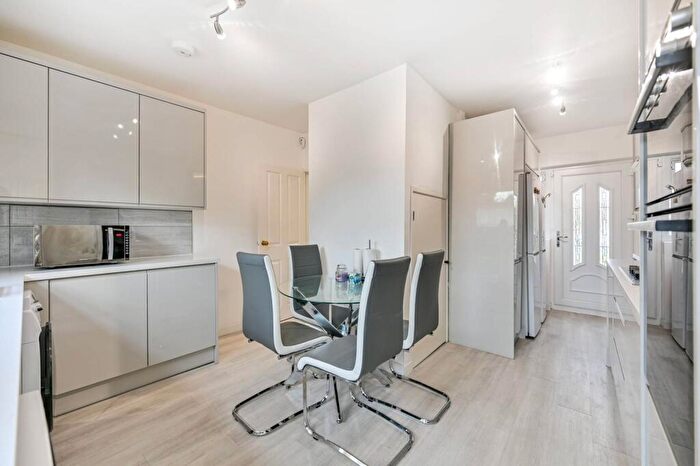
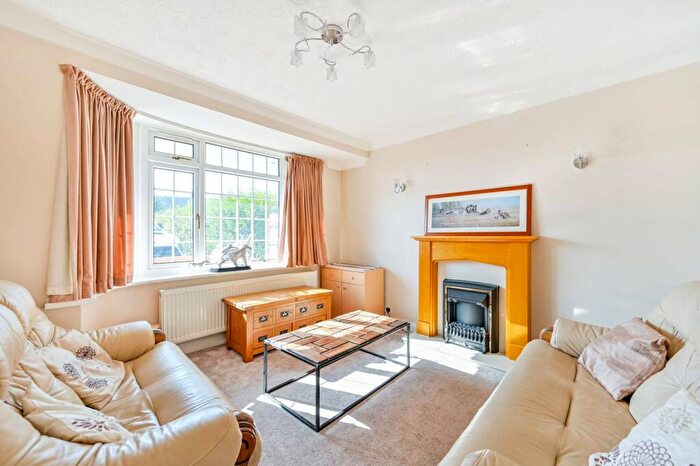
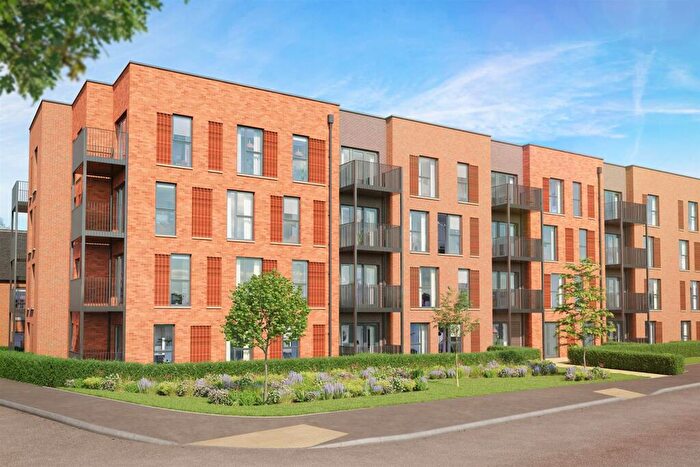
Properties for sale in Chalvey
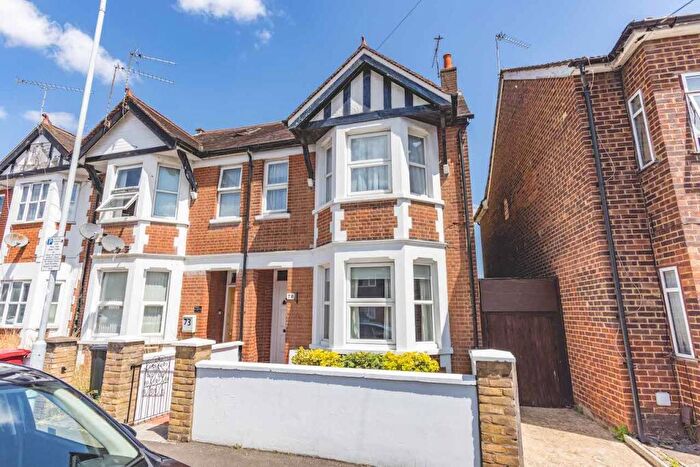


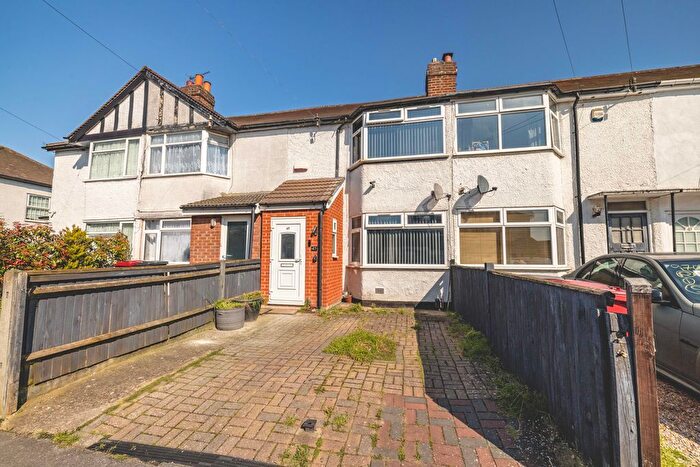
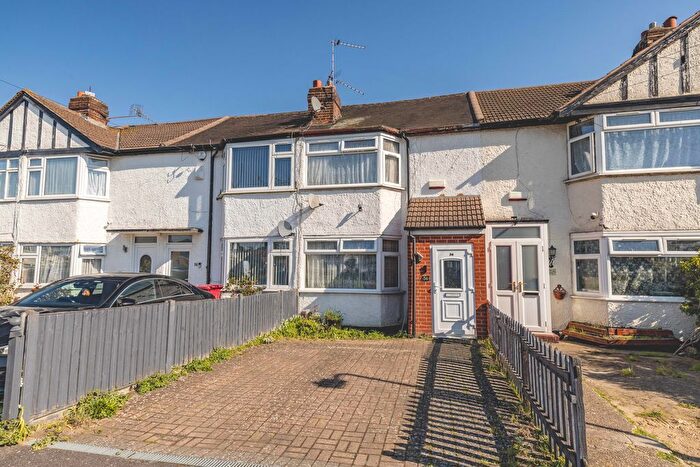
![]()
If you are looking to sell your house, let it out, or receive a property valuation, an expert can help you.
Click the button below to get started.


Roads and Postcodes in Chalvey
Navigate through our locations to find the location of your next house in Chalvey, Slough for sale or to rent.
Transport near Chalvey
-

 Slough Station
 -
Windsor and Eton Riverside Station
-
Windsor and Eton Central Station
-
Burnham Station
-
Datchet Station
-
Langley Station
- FAQ
- Price Paid By Year
- Property Type Price
Frequently asked questions about Chalvey
What is the average price for a property for sale in Chalvey?
The average price for a property for sale in Chalvey is £298,655. This amount is 22% lower than the average price in Slough. There are 2,208 property listings for sale in Chalvey.
What streets have the most expensive properties for sale in Chalvey?
The streets with the most expensive properties for sale in Chalvey are Everard Avenue at an average of £482,666, Griffin Close at an average of £466,666 and Kings Road at an average of £437,857.
What streets have the most affordable properties for sale in Chalvey?
The streets with the most affordable properties for sale in Chalvey are The Fields at an average of £139,950, Tuns Lane at an average of £155,000 and Worcester Gardens at an average of £164,272.
Which train stations are available in or near Chalvey?
Some of the train stations available in or near Chalvey are Slough, Windsor and Eton Riverside and Windsor and Eton Central.
Property Price Paid in Chalvey by Year
The average sold property price by year was:
| Year | Average Sold Price | Price Change |
Sold Properties
|
|---|---|---|---|
| 2026 | £300,000 | -3% |
1 Property |
| 2025 | £307,506 | 6% |
66 Properties |
| 2024 | £289,520 | -5% |
119 Properties |
| 2023 | £304,700 | 4% |
83 Properties |
| 2022 | £291,087 | 10% |
106 Properties |
| 2021 | £262,334 | -1% |
140 Properties |
| 2020 | £263,931 | -10% |
52 Properties |
| 2019 | £289,378 | 14% |
101 Properties |
| 2018 | £247,918 | -13% |
133 Properties |
| 2017 | £279,301 | 12% |
222 Properties |
| 2016 | £246,985 | 14% |
232 Properties |
| 2015 | £212,669 | 11% |
147 Properties |
| 2014 | £188,323 | 11% |
146 Properties |
| 2013 | £168,399 | 5% |
93 Properties |
| 2012 | £160,235 | 4% |
55 Properties |
| 2011 | £153,682 | 4% |
62 Properties |
| 2010 | £147,466 | -5% |
47 Properties |
| 2009 | £154,134 | -18% |
111 Properties |
| 2008 | £182,103 | -5% |
146 Properties |
| 2007 | £190,687 | 9% |
348 Properties |
| 2006 | £174,084 | -2% |
291 Properties |
| 2005 | £176,777 | 8% |
278 Properties |
| 2004 | £163,352 | 9% |
204 Properties |
| 2003 | £148,158 | 20% |
195 Properties |
| 2002 | £117,820 | 15% |
217 Properties |
| 2001 | £100,275 | 10% |
180 Properties |
| 2000 | £90,152 | 21% |
256 Properties |
| 1999 | £71,617 | 5% |
167 Properties |
| 1998 | £67,696 | 18% |
156 Properties |
| 1997 | £55,176 | 11% |
152 Properties |
| 1996 | £49,097 | -1% |
127 Properties |
| 1995 | £49,695 | - |
102 Properties |
Property Price per Property Type in Chalvey
Here you can find historic sold price data in order to help with your property search.
The average Property Paid Price for specific property types in the last three years are:
| Property Type | Average Sold Price | Sold Properties |
|---|---|---|
| Flat | £227,973.00 | 152 Flats |
| Semi Detached House | £398,214.00 | 54 Semi Detached Houses |
| Detached House | £443,777.00 | 9 Detached Houses |
| Terraced House | £373,869.00 | 54 Terraced Houses |