
Houses for sale & to rent in Central, Slough
House Prices in Central
Properties in Central have an average house price of £296k and had 312 Property Transactions within the last 3 years¹.
Central is an area in Slough, Slough with 3,719 households², where the most expensive property was sold for £917k.
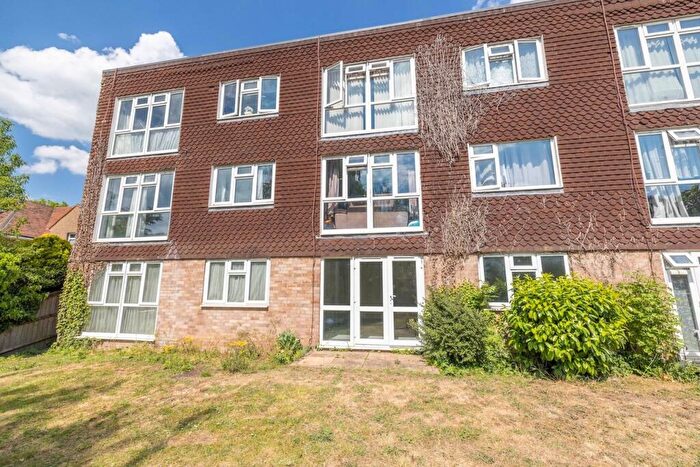
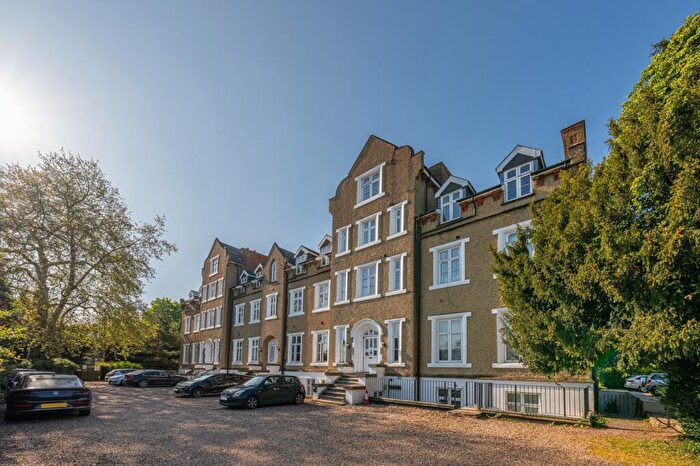
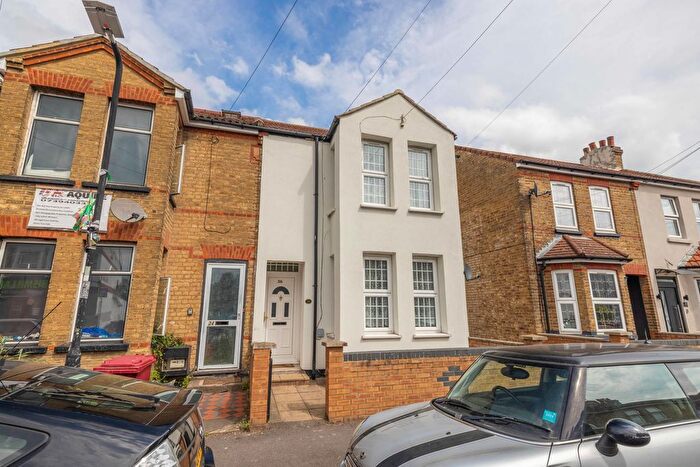
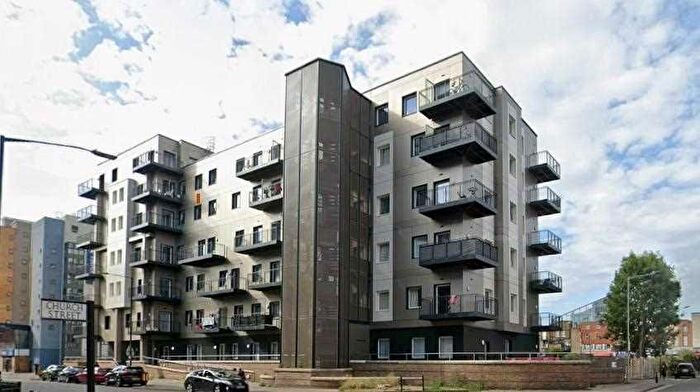
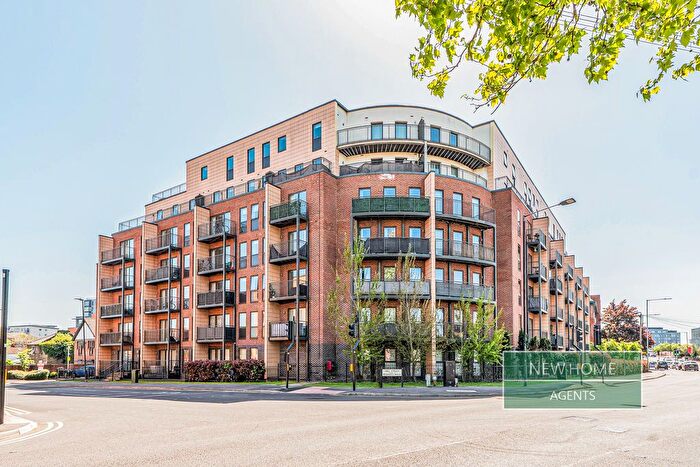
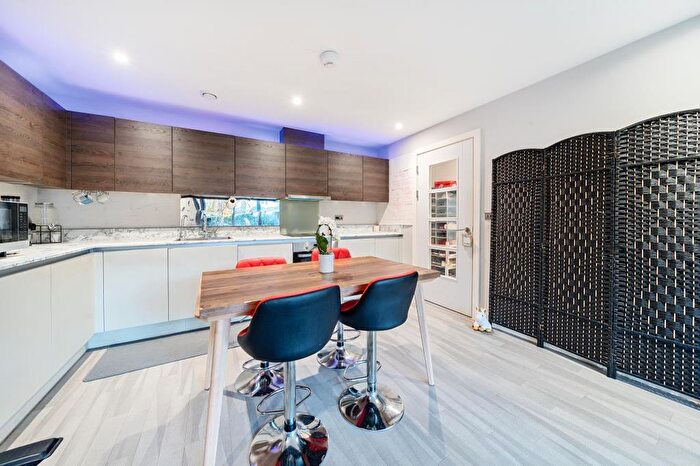
Properties for sale in Central
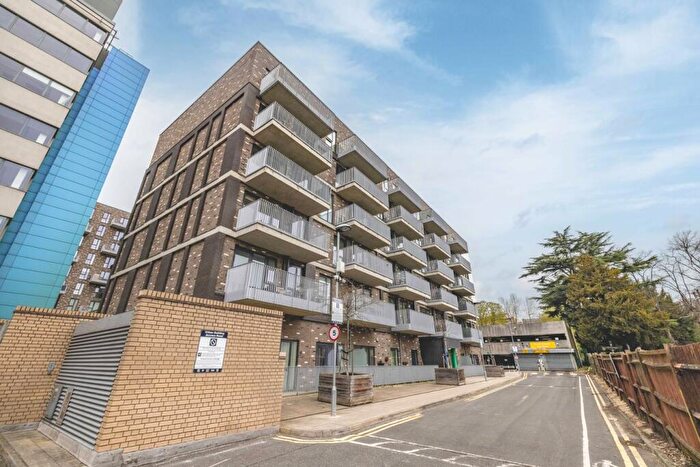
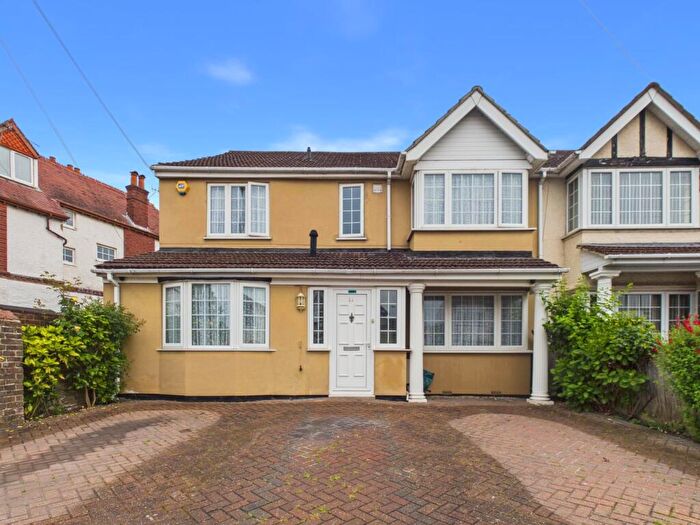
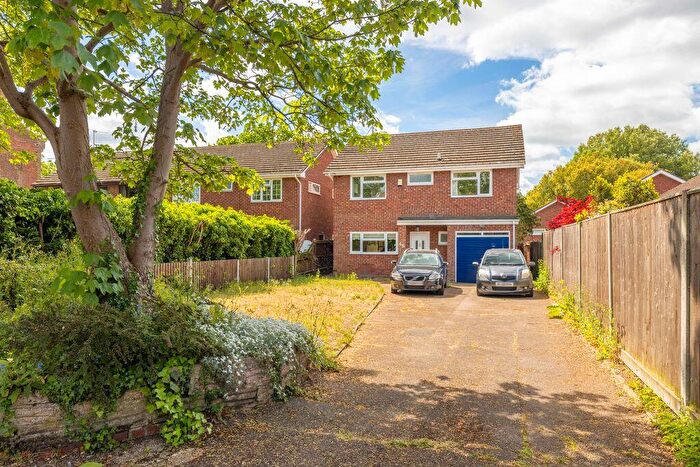
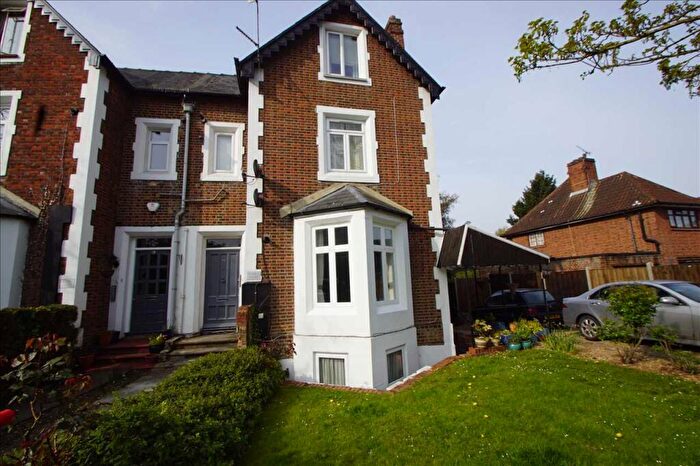

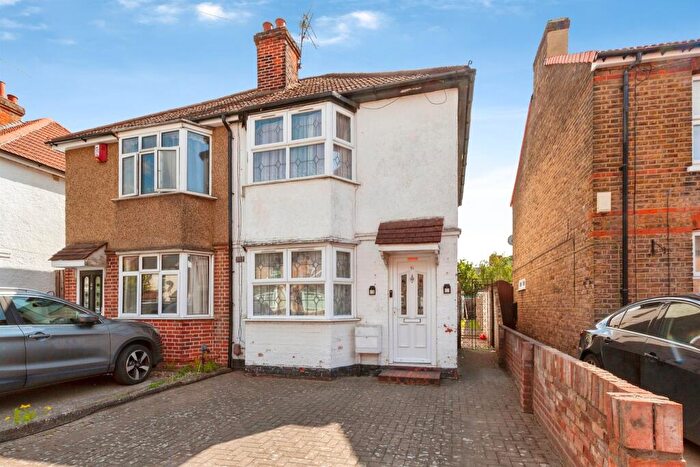
![]()
If you are looking to sell your house, let it out, or receive a property valuation, an expert can help you.
Click the button below to get started.


Roads and Postcodes in Central
Navigate through our locations to find the location of your next house in Central, Slough for sale or to rent.
Transport near Central
-

 Slough Station
 -
Windsor and Eton Riverside Station
-
Datchet Station
-
Langley Station
-
Windsor and Eton Central Station
-
Burnham Station
-
Sunnymeads Station
- FAQ
- Price Paid By Year
- Property Type Price
Frequently asked questions about Central
What is the average price for a property for sale in Central?
The average price for a property for sale in Central is £296,352. This amount is 22% lower than the average price in Slough. There are 2,929 property listings for sale in Central.
What streets have the most expensive properties for sale in Central?
The streets with the most expensive properties for sale in Central are Aldin Avenue North at an average of £467,500, Diamond Road at an average of £415,000 and Victoria Street at an average of £397,500.
What streets have the most affordable properties for sale in Central?
The streets with the most affordable properties for sale in Central are Galloway Chase at an average of £158,000, Greendale Mews at an average of £165,000 and Osborne Street at an average of £170,250.
Which train stations are available in or near Central?
Some of the train stations available in or near Central are Slough, Windsor and Eton Riverside and Datchet.
Property Price Paid in Central by Year
The average sold property price by year was:
| Year | Average Sold Price | Price Change |
Sold Properties
|
|---|---|---|---|
| 2026 | £250,833 | -12% |
6 Properties |
| 2025 | £280,598 | 1% |
90 Properties |
| 2024 | £277,374 | -16% |
87 Properties |
| 2023 | £322,260 | 8% |
129 Properties |
| 2022 | £297,751 | -2% |
113 Properties |
| 2021 | £304,656 | -1% |
266 Properties |
| 2020 | £307,637 | 10% |
87 Properties |
| 2019 | £275,642 | 1% |
309 Properties |
| 2018 | £272,493 | -4% |
291 Properties |
| 2017 | £282,585 | 17% |
279 Properties |
| 2016 | £234,832 | 1% |
306 Properties |
| 2015 | £232,646 | 13% |
217 Properties |
| 2014 | £201,854 | 13% |
358 Properties |
| 2013 | £176,054 | -2% |
80 Properties |
| 2012 | £179,605 | 6% |
86 Properties |
| 2011 | £169,308 | -2% |
129 Properties |
| 2010 | £172,217 | 4% |
82 Properties |
| 2009 | £165,788 | -14% |
75 Properties |
| 2008 | £189,321 | 3% |
119 Properties |
| 2007 | £183,084 | 6% |
296 Properties |
| 2006 | £172,535 | 0,5% |
217 Properties |
| 2005 | £171,724 | 10% |
171 Properties |
| 2004 | £154,934 | 4% |
238 Properties |
| 2003 | £148,597 | 12% |
286 Properties |
| 2002 | £130,526 | 15% |
261 Properties |
| 2001 | £110,436 | 22% |
255 Properties |
| 2000 | £85,658 | 12% |
248 Properties |
| 1999 | £75,718 | 18% |
254 Properties |
| 1998 | £62,037 | 6% |
241 Properties |
| 1997 | £58,481 | 7% |
232 Properties |
| 1996 | £54,295 | 10% |
187 Properties |
| 1995 | £49,019 | - |
110 Properties |
Property Price per Property Type in Central
Here you can find historic sold price data in order to help with your property search.
The average Property Paid Price for specific property types in the last three years are:
| Property Type | Average Sold Price | Sold Properties |
|---|---|---|
| Semi Detached House | £383,372.00 | 25 Semi Detached Houses |
| Detached House | £530,246.00 | 20 Detached Houses |
| Terraced House | £368,312.00 | 54 Terraced Houses |
| Flat | £245,933.00 | 213 Flats |