
Houses for sale & to rent in Elliman, Slough
House Prices in Elliman
Properties in Elliman have an average house price of £334,835.00 and had 177 Property Transactions within the last 3 years¹.
Elliman is an area in Slough, Slough with 2,975 households², where the most expensive property was sold for £810,000.00.
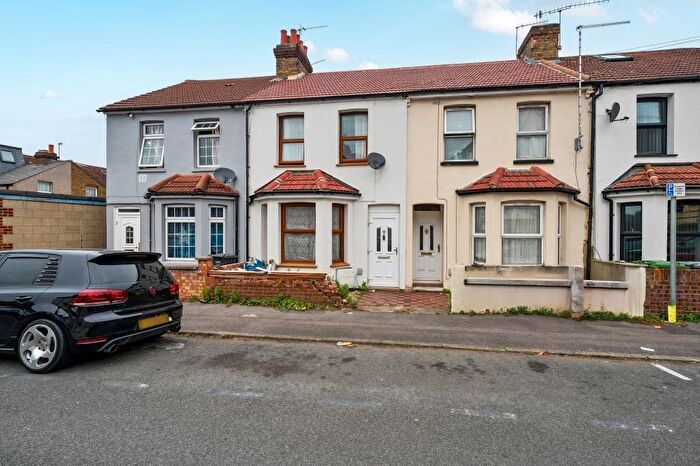
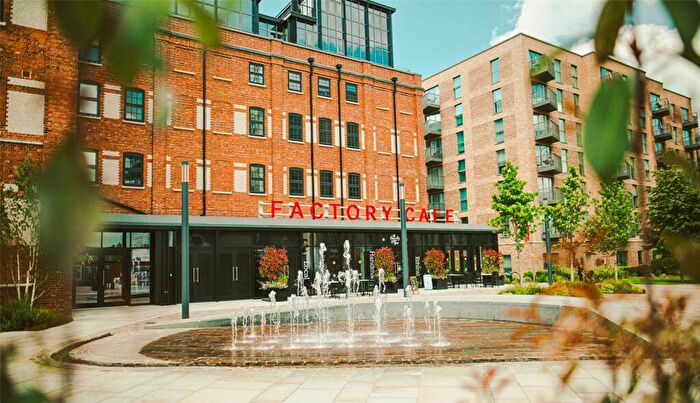
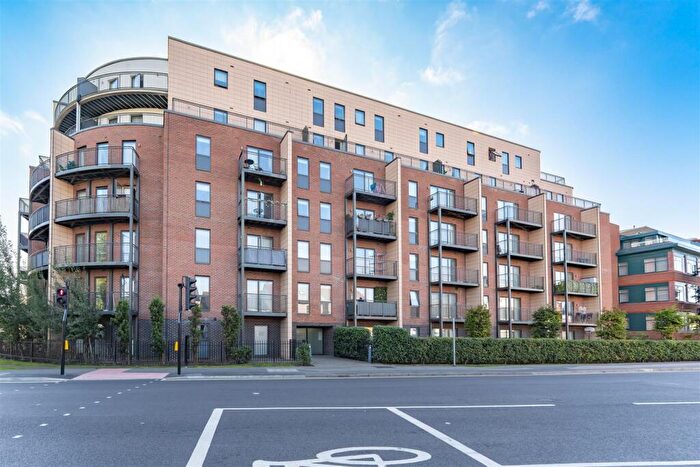
Properties for sale in Elliman
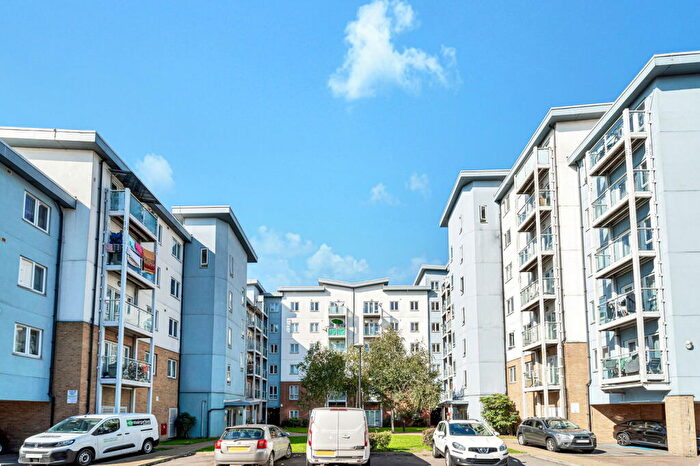

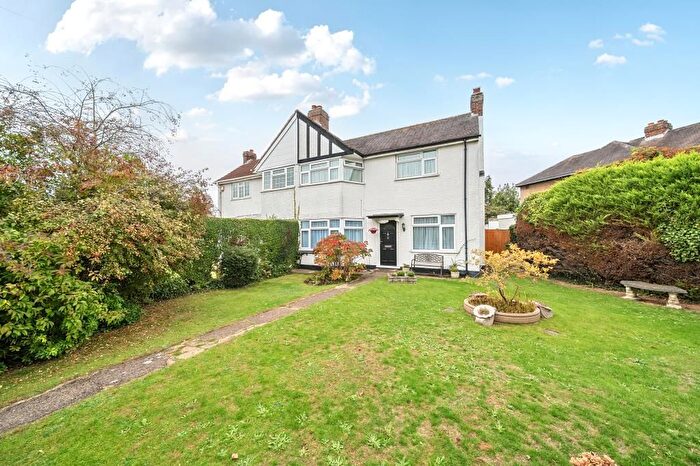
![]()
If you are looking to sell your house, let it out, or receive a property valuation, an expert can help you.
Click the button below to get started.


Roads and Postcodes in Elliman
Navigate through our locations to find the location of your next house in Elliman, Slough for sale or to rent.
Transport near Elliman
-

 Slough Station
 -
Windsor and Eton Riverside Station
-
Langley Station
-
Burnham Station
-
Datchet Station
-
Windsor and Eton Central Station
- FAQ
- Price Paid By Year
- Property Type Price
Frequently asked questions about Elliman
What is the average price for a property for sale in Elliman?
The average price for a property for sale in Elliman is £334,835. This amount is 11% lower than the average price in Slough. There are 3,290 property listings for sale in Elliman.
What streets have the most expensive properties for sale in Elliman?
The streets with the most expensive properties for sale in Elliman are Stoke Road at an average of £494,500, Lansdowne Avenue at an average of £490,000 and Bradley Road at an average of £462,500.
What streets have the most affordable properties for sale in Elliman?
The streets with the most affordable properties for sale in Elliman are Queens Court at an average of £145,000, Stoke Gardens at an average of £175,000 and Charles Gardens at an average of £180,000.
Which train stations are available in or near Elliman?
Some of the train stations available in or near Elliman are Slough, Windsor and Eton Riverside and Langley.
Property Price Paid in Elliman by Year
The average sold property price by year was:
| Year | Average Sold Price | Price Change |
Sold Properties
|
|---|---|---|---|
| 2025 | £376,153 | 12% |
13 Properties |
| 2024 | £329,472 | 1% |
55 Properties |
| 2023 | £326,255 | -3% |
43 Properties |
| 2022 | £336,756 | 2% |
66 Properties |
| 2021 | £331,563 | 7% |
62 Properties |
| 2020 | £308,455 | 2% |
36 Properties |
| 2019 | £302,702 | 10% |
47 Properties |
| 2018 | £272,786 | 1% |
56 Properties |
| 2017 | £270,443 | 0,1% |
95 Properties |
| 2016 | £270,190 | 25% |
66 Properties |
| 2015 | £202,793 | -1% |
186 Properties |
| 2014 | £205,023 | 2% |
82 Properties |
| 2013 | £200,260 | 10% |
55 Properties |
| 2012 | £179,673 | -9% |
36 Properties |
| 2011 | £195,045 | -2% |
51 Properties |
| 2010 | £199,739 | 5% |
49 Properties |
| 2009 | £190,248 | 1% |
35 Properties |
| 2008 | £189,008 | -2% |
75 Properties |
| 2007 | £192,958 | 3% |
138 Properties |
| 2006 | £186,820 | 9% |
176 Properties |
| 2005 | £170,938 | 5% |
133 Properties |
| 2004 | £162,862 | 11% |
161 Properties |
| 2003 | £144,298 | 12% |
170 Properties |
| 2002 | £127,545 | 17% |
172 Properties |
| 2001 | £105,656 | 6% |
274 Properties |
| 2000 | £99,058 | 25% |
143 Properties |
| 1999 | £74,208 | 0,1% |
130 Properties |
| 1998 | £74,117 | 15% |
132 Properties |
| 1997 | £63,087 | 11% |
132 Properties |
| 1996 | £55,970 | 1% |
113 Properties |
| 1995 | £55,351 | - |
101 Properties |
Property Price per Property Type in Elliman
Here you can find historic sold price data in order to help with your property search.
The average Property Paid Price for specific property types in the last three years are:
| Property Type | Average Sold Price | Sold Properties |
|---|---|---|
| Flat | £204,247.00 | 61 Flats |
| Semi Detached House | £418,661.00 | 55 Semi Detached Houses |
| Terraced House | £350,451.00 | 52 Terraced Houses |
| Detached House | £617,438.00 | 9 Detached Houses |