
Houses for sale & to rent in Cippenham Green, Slough
House Prices in Cippenham Green
Properties in Cippenham Green have an average house price of £391k and had 297 Property Transactions within the last 3 years¹.
Cippenham Green is an area in Slough, Slough with 3,771 households², where the most expensive property was sold for £1.65M.
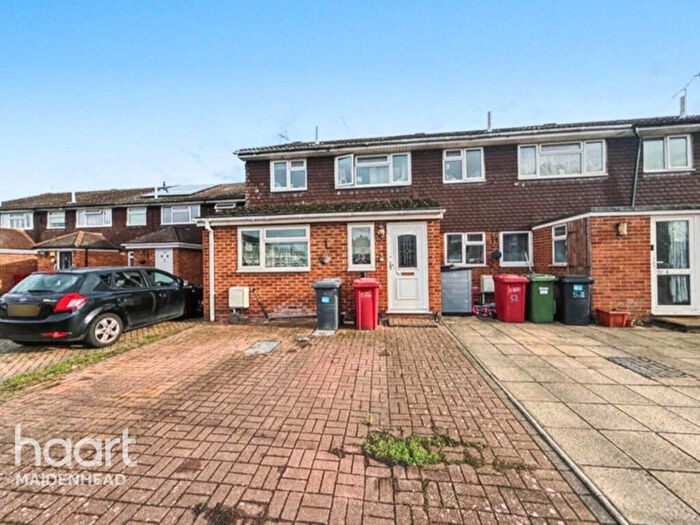
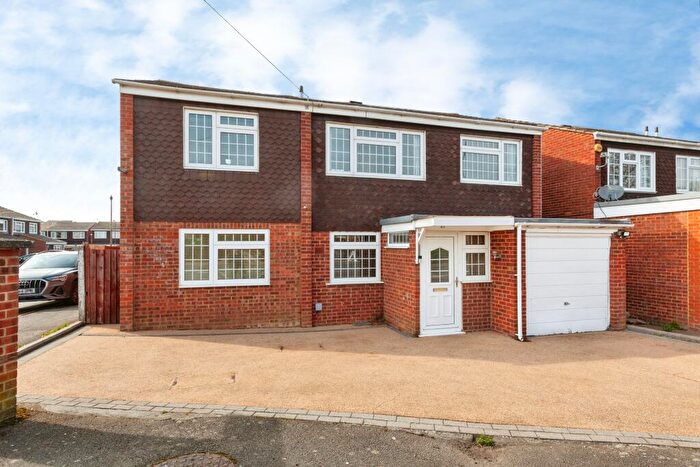
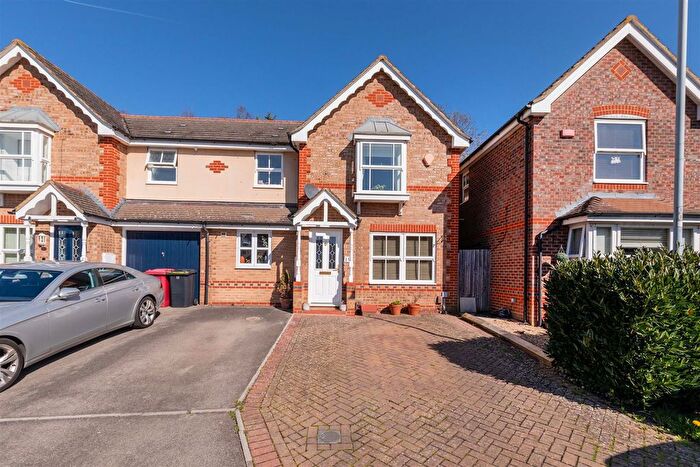
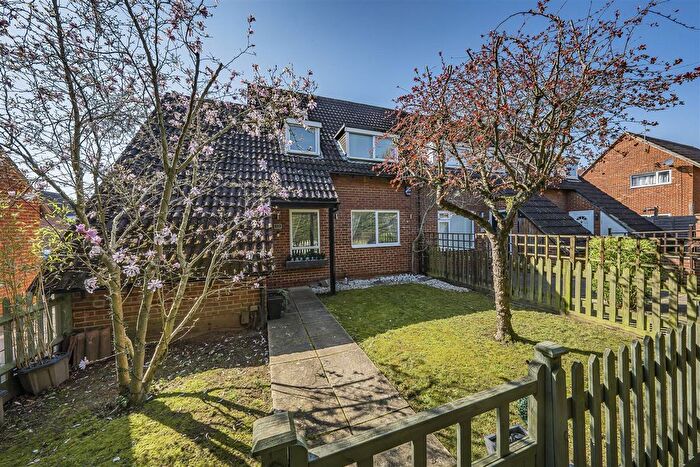
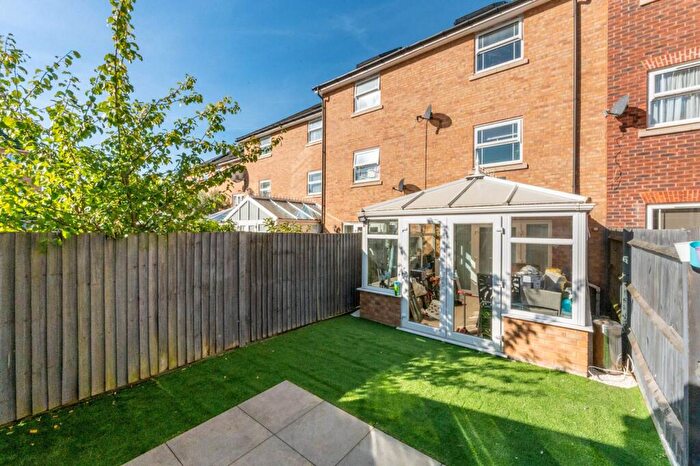
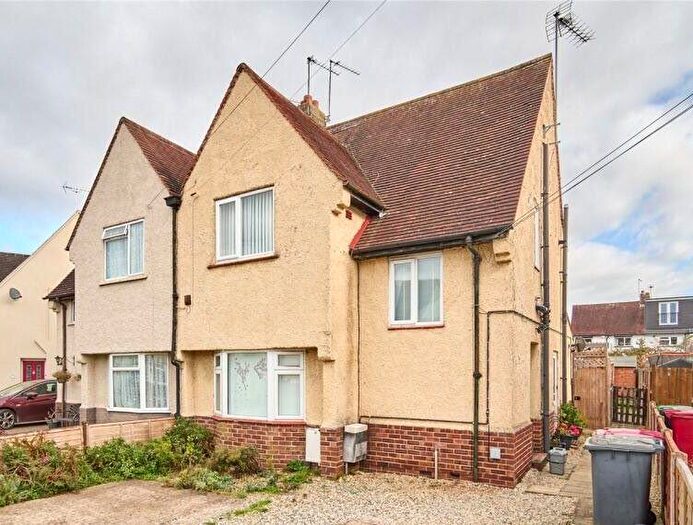
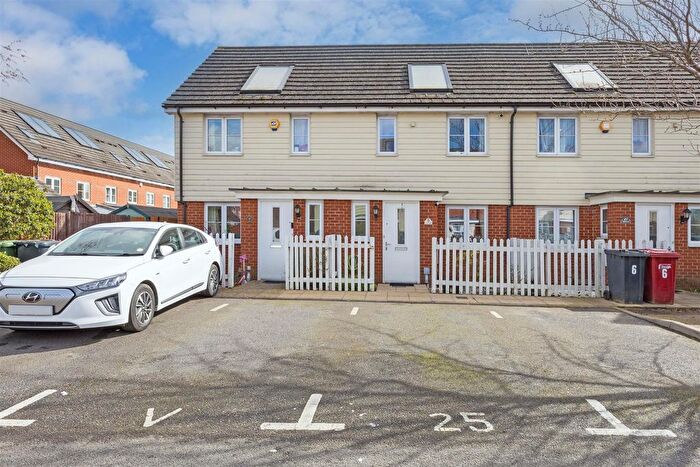
Properties for sale in Cippenham Green

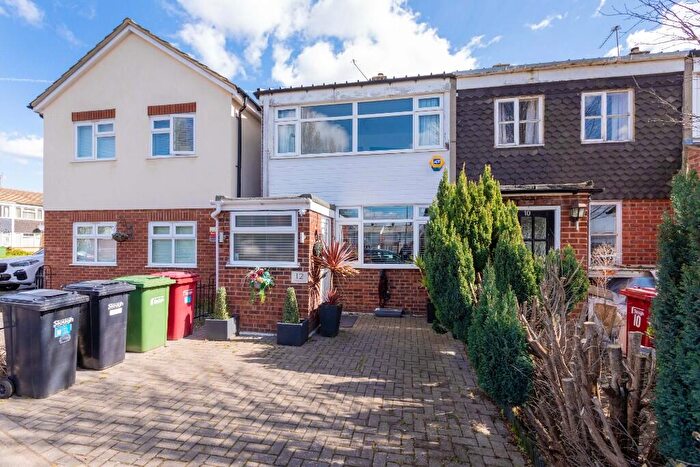

![]()
If you are looking to sell your house, let it out, or receive a property valuation, an expert can help you.
Click the button below to get started.


Roads and Postcodes in Cippenham Green
Navigate through our locations to find the location of your next house in Cippenham Green, Slough for sale or to rent.
Transport near Cippenham Green
-

 Burnham Station
 -
Taplow Station
-
Slough Station
-
Windsor and Eton Riverside Station
-
Windsor and Eton Central Station
- FAQ
- Price Paid By Year
- Property Type Price
Frequently asked questions about Cippenham Green
What is the average price for a property for sale in Cippenham Green?
The average price for a property for sale in Cippenham Green is £390,854. This amount is 2% higher than the average price in Slough. There are 1,550 property listings for sale in Cippenham Green.
What streets have the most expensive properties for sale in Cippenham Green?
The streets with the most expensive properties for sale in Cippenham Green are Autumn Close at an average of £800,000, Cippenham Close at an average of £545,333 and Eagle Road at an average of £540,000.
What streets have the most affordable properties for sale in Cippenham Green?
The streets with the most affordable properties for sale in Cippenham Green are Egremont Gardens at an average of £120,000, Ridgebank at an average of £172,416 and Fotheringay Gardens at an average of £192,083.
Which train stations are available in or near Cippenham Green?
Some of the train stations available in or near Cippenham Green are Burnham, Taplow and Slough.
Property Price Paid in Cippenham Green by Year
The average sold property price by year was:
| Year | Average Sold Price | Price Change |
Sold Properties
|
|---|---|---|---|
| 2026 | £429,000 | 7% |
2 Properties |
| 2025 | £397,567 | 1% |
100 Properties |
| 2024 | £395,494 | 5% |
103 Properties |
| 2023 | £377,534 | -0,3% |
92 Properties |
| 2022 | £378,787 | 3% |
128 Properties |
| 2021 | £365,622 | 9% |
149 Properties |
| 2020 | £332,541 | -3% |
110 Properties |
| 2019 | £341,734 | 1% |
119 Properties |
| 2018 | £339,609 | -1% |
137 Properties |
| 2017 | £341,893 | 5% |
126 Properties |
| 2016 | £325,450 | 14% |
128 Properties |
| 2015 | £280,461 | 15% |
125 Properties |
| 2014 | £238,925 | 4% |
134 Properties |
| 2013 | £229,004 | 5% |
115 Properties |
| 2012 | £217,813 | 2% |
104 Properties |
| 2011 | £212,926 | -2% |
130 Properties |
| 2010 | £217,392 | 13% |
122 Properties |
| 2009 | £189,828 | -10% |
104 Properties |
| 2008 | £208,188 | -1% |
117 Properties |
| 2007 | £210,914 | 7% |
224 Properties |
| 2006 | £197,142 | 5% |
240 Properties |
| 2005 | £187,465 | 4% |
181 Properties |
| 2004 | £179,725 | 8% |
225 Properties |
| 2003 | £164,458 | 13% |
195 Properties |
| 2002 | £143,074 | 13% |
261 Properties |
| 2001 | £124,088 | 6% |
225 Properties |
| 2000 | £116,964 | 19% |
220 Properties |
| 1999 | £94,906 | -1% |
239 Properties |
| 1998 | £96,313 | 20% |
255 Properties |
| 1997 | £77,226 | 10% |
274 Properties |
| 1996 | £69,123 | 9% |
199 Properties |
| 1995 | £62,627 | - |
123 Properties |
Property Price per Property Type in Cippenham Green
Here you can find historic sold price data in order to help with your property search.
The average Property Paid Price for specific property types in the last three years are:
| Property Type | Average Sold Price | Sold Properties |
|---|---|---|
| Flat | £205,551.00 | 58 Flats |
| Semi Detached House | £430,274.00 | 118 Semi Detached Houses |
| Detached House | £546,501.00 | 39 Detached Houses |
| Terraced House | £391,170.00 | 82 Terraced Houses |