
Houses for sale & to rent in Haymill And Lynch Hill, Slough
House Prices in Haymill And Lynch Hill
Properties in Haymill And Lynch Hill have an average house price of £391,612.00 and had 412 Property Transactions within the last 3 years¹.
Haymill And Lynch Hill is an area in Slough, Slough with 3,980 households², where the most expensive property was sold for £3,900,000.00.
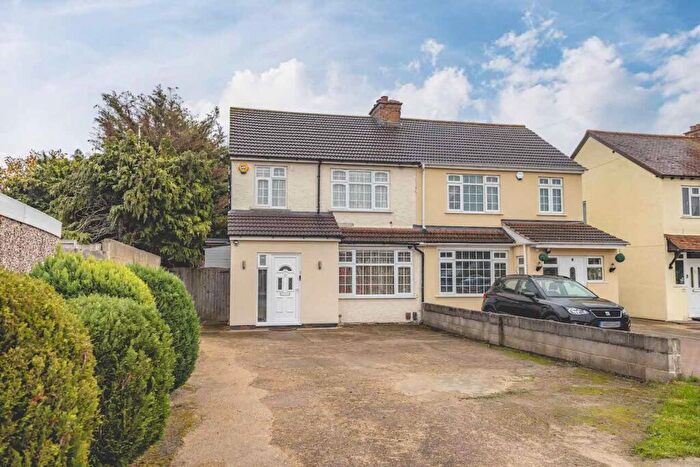
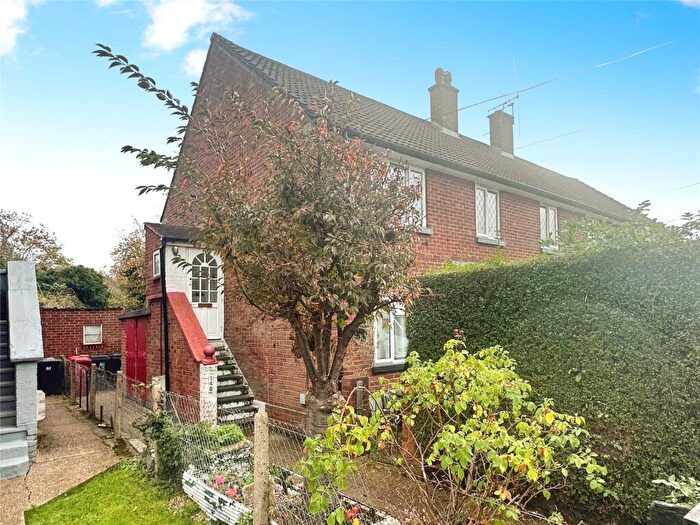
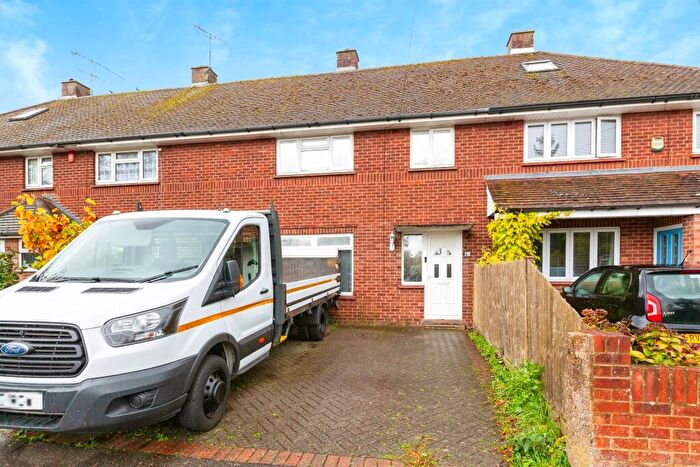
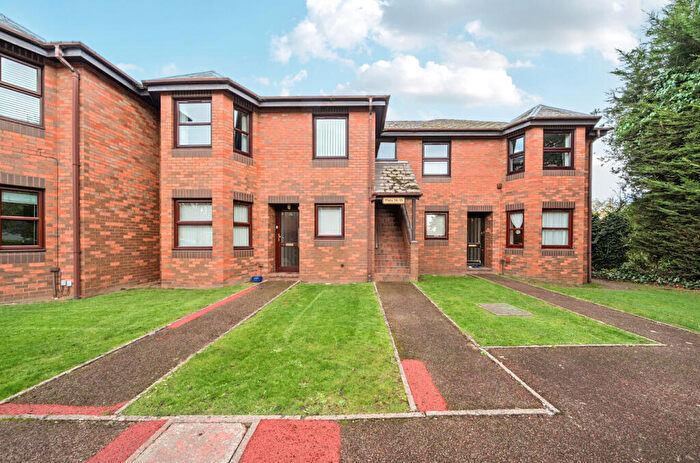
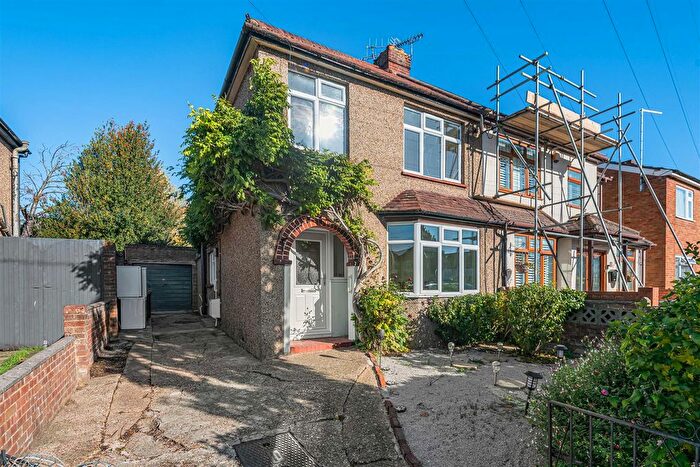
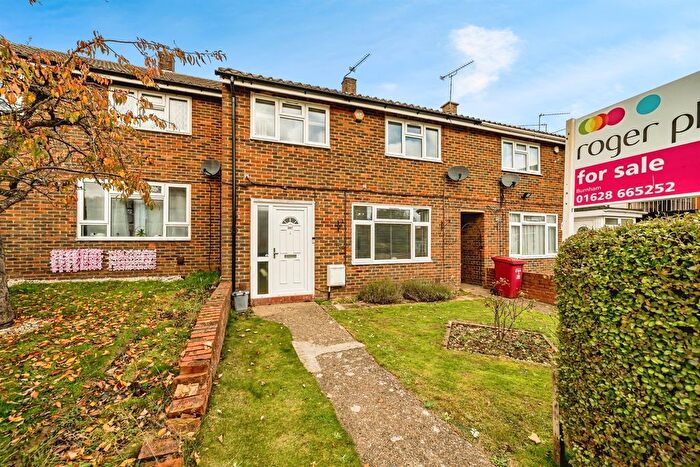
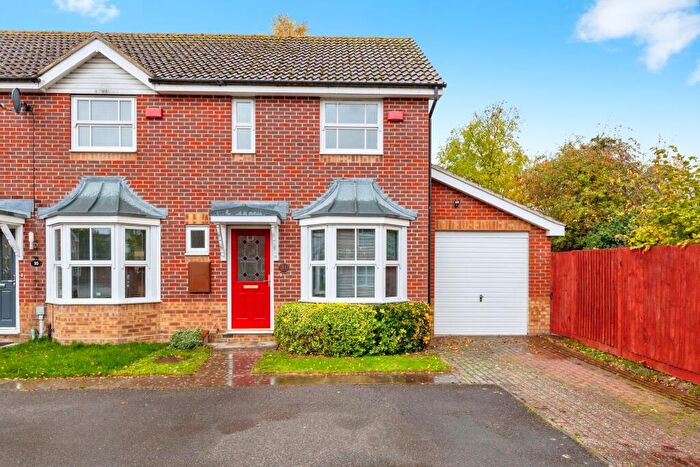
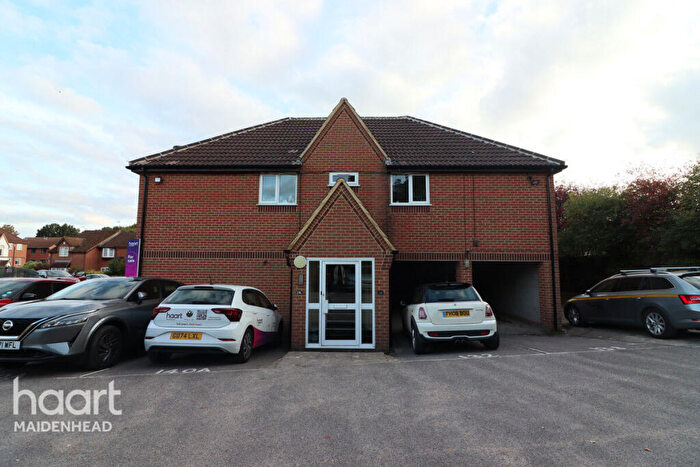
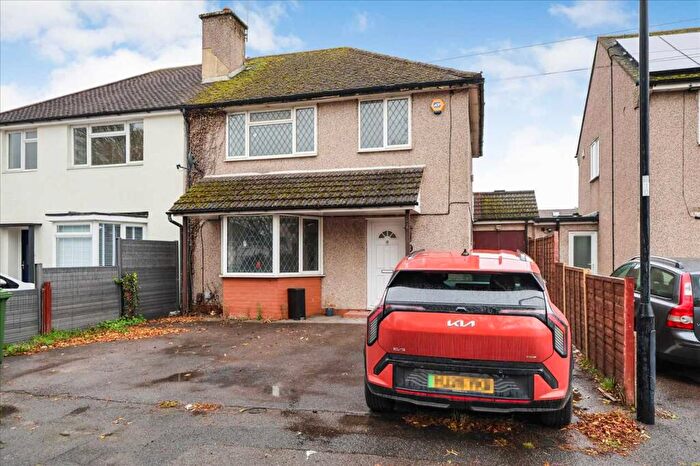
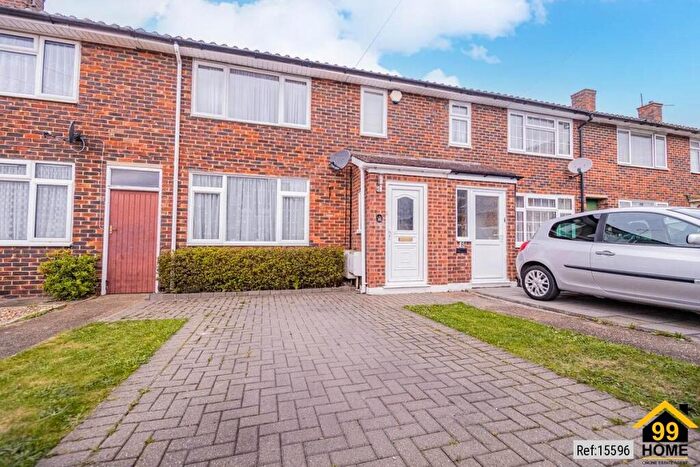
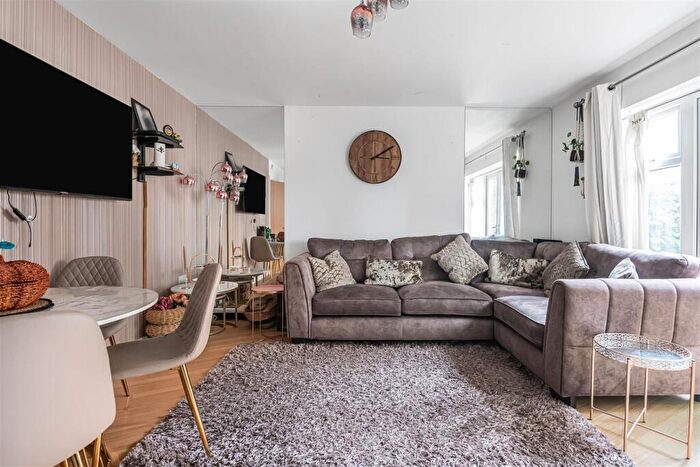
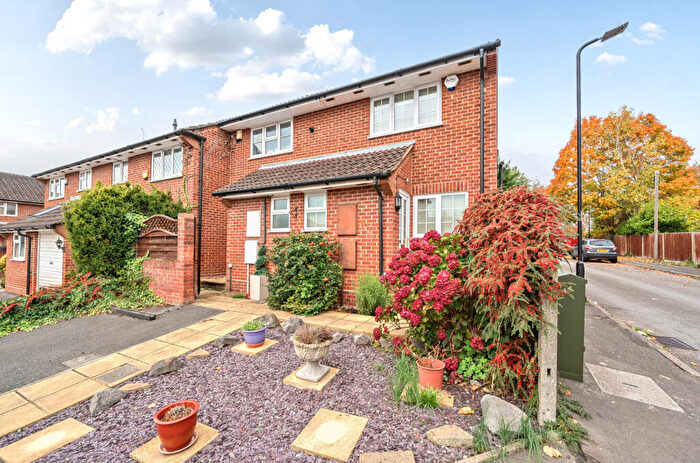
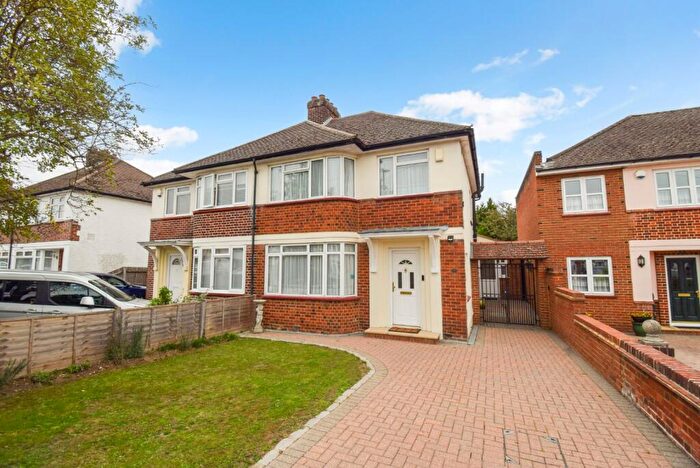
Properties for sale in Haymill And Lynch Hill

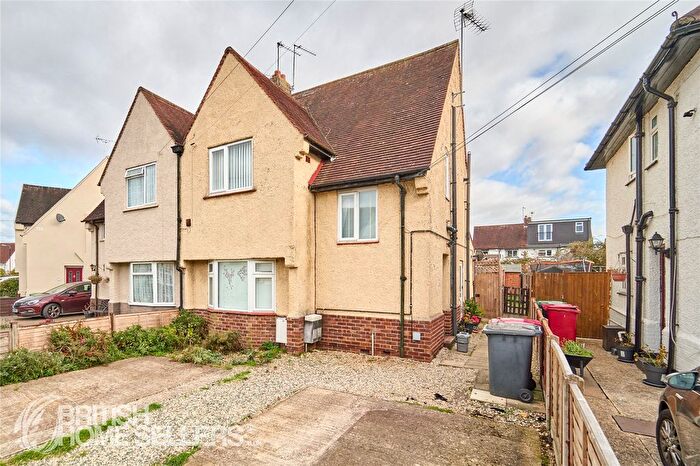
![]()
If you are looking to sell your house, let it out, or receive a property valuation, an expert can help you.
Click the button below to get started.


Roads and Postcodes in Haymill And Lynch Hill
Navigate through our locations to find the location of your next house in Haymill And Lynch Hill, Slough for sale or to rent.
| Streets | Postcodes |
|---|---|
| Altwood Close | SL1 6LX |
| Amberley Road | SL2 2LR |
| Anslow Place | SL1 6EA |
| Balmoral Close | SL1 6JP |
| Bartelotts Road | SL2 2NZ |
| Bath Road | SL1 6AE SL1 6AF SL1 6AT SL1 6DA SL1 6JA SL1 6JE SL1 6BB SL1 6BQ |
| Berkeley Mews | SL1 6JD |
| Blumfield Court | SL1 6NW |
| Blumfield Crescent | SL1 6NH SL1 6NJ SL1 6NL SL1 6NN |
| Brook Crescent | SL1 6LJ SL1 6LL |
| Buckingham Avenue | SL1 4NN |
| Burford Gardens | SL1 6DN SL1 6DW |
| Burnham Lane | SL1 6JX SL1 6JY SL1 6LA SL1 6LE SL1 6LH SL1 6LS SL1 6LY SL1 6LP SL1 6LZ |
| Buttermere Avenue | SL1 6EF SL1 6EG |
| Chepstow Court | SL2 2AX |
| Coniston Crescent | SL1 6EE |
| Crosthwaite Way | SL1 6ET SL1 6EX |
| Crummock Close | SL1 6EN |
| Derwent Drive | SL1 6HN SL1 6HP SL1 6HS SL1 6HT SL1 6HW |
| Dove House Crescent | SL2 2PY SL2 2PZ |
| Eaton Avenue | SL1 6EZ |
| Ennerdale Crescent | SL1 6EH |
| Garrard Road | SL2 2QN |
| Goldsworthy Way | SL1 6AR SL1 6AX SL1 6AY SL1 6AZ SL1 6JF |
| Greenfern Avenue | SL1 6AQ |
| Haymill Road | SL1 6NA SL1 6NB SL1 6NE SL1 6NF SL2 2NP SL2 2NR |
| Holyhead Mews | SL1 6BD |
| Huntercombe Lane North | SL1 6DS SL1 6DU SL1 6DY |
| Hurst Road | SL1 6ND |
| Iona Crescent | SL1 6JH |
| Kelpatrick Road | SL1 6BW SL1 6DD |
| Kingsley Path | SL2 2NS |
| Kinnaird Close | SL1 6AL SL1 6AS |
| Lammas Road | SL1 6LG |
| Lawrence Way | SL1 6HH SL1 6HQ |
| Leaholme Gardens | SL1 6LD |
| Littlebrook Avenue | SL2 2NE SL2 2NN SL2 2NW SL2 2PD SL2 2PE SL2 2PF |
| Long Furlong Drive | SL2 2NG SL2 2PR |
| Lower Britwell Road | SL2 2NH SL2 2NJ SL2 2NL |
| Lowestoft Drive | SL1 6PB SL1 6PD SL1 6PE SL1 6PF |
| Lynch Hill Lane | SL2 2PU SL2 2PX SL2 2QA SL2 2QB SL2 2QD SL2 2QL |
| Marescroft Road | SL2 2LN SL2 2LW |
| Maybury Close | SL1 6EY SL1 6FD |
| Mead Way | SL1 6HB SL1 6HD |
| Newport Road | SL2 2PT |
| Orchard Avenue | SL1 6HE |
| Parkview Chase | SL1 6LT |
| Phipps Road | SL1 6NG SL1 6NQ |
| Plymouth Road | SL1 4LP |
| Portland Close | SL2 2LT |
| Priory Road | SL1 6DP SL1 6DR |
| Progress Business Centre | SL1 6DQ |
| Ramsey Court | SL2 2PB |
| Royston Way | SL1 6EP SL1 6ER SL1 6ES SL1 6HA SL1 6HF SL1 6HG |
| Sandringham Court | SL1 6JU SL1 6JZ |
| St James Place | SL1 6AJ |
| St Michaels Court | SL2 2NF |
| Stanhope Road | SL1 6JR SL1 6JS |
| Station Road | SL1 6JJ SL1 6JL SL1 6JT |
| Stratford Close | SL2 2PS |
| Suffolk Close | SL1 6JB SL1 6JN |
| Tennyson Way | SL2 2PA |
| The Spur | SL1 6EU |
| Thirlmere Avenue | SL1 6EB SL1 6ED |
| Tudor Gardens | SL1 6HJ |
| Ullswater Close | SL1 6EQ |
| Walpole Road | SL1 6AU SL1 6PA SL1 6PG SL1 6PP SL1 6PQ |
| Westlands Avenue | SL1 6AG SL1 6AH SL1 6AN |
| Westlands Close | SL1 6AW |
| Whittaker Road | SL2 2LH SL2 2LL SL2 2LP SL2 2LQ SL2 2LJ |
| Whittle Parkway | SL1 6FE |
| Windermere Way | SL1 6EJ SL1 6EL |
| Windsor Lane | SL1 7JA |
| Wordsworth Road | SL2 2NT SL2 2NU SL2 2NX SL2 2NY |
| Yeovil Road | SL1 4JA SL1 4JB SL1 4NH |
Transport near Haymill And Lynch Hill


- FAQ
- Price Paid By Year
- Property Type Price
Frequently asked questions about Haymill And Lynch Hill
What is the average price for a property for sale in Haymill And Lynch Hill?
The average price for a property for sale in Haymill And Lynch Hill is £391,612. This amount is 4% higher than the average price in Slough. There are 1,700 property listings for sale in Haymill And Lynch Hill.
What streets have the most expensive properties for sale in Haymill And Lynch Hill?
The streets with the most expensive properties for sale in Haymill And Lynch Hill are Lammas Road at an average of £919,000, Station Road at an average of £875,000 and Crosthwaite Way at an average of £720,000.
What streets have the most affordable properties for sale in Haymill And Lynch Hill?
The streets with the most affordable properties for sale in Haymill And Lynch Hill are Buckingham Avenue at an average of £191,666, Suffolk Close at an average of £214,750 and Walpole Road at an average of £233,901.
Which train stations are available in or near Haymill And Lynch Hill?
Some of the train stations available in or near Haymill And Lynch Hill are Burnham, Taplow and Slough.
Property Price Paid in Haymill And Lynch Hill by Year
The average sold property price by year was:
| Year | Average Sold Price | Price Change |
Sold Properties
|
|---|---|---|---|
| 2025 | £371,937 | -7% |
64 Properties |
| 2024 | £396,797 | -7% |
111 Properties |
| 2023 | £423,921 | 12% |
98 Properties |
| 2022 | £373,752 | 6% |
139 Properties |
| 2021 | £352,604 | 5% |
172 Properties |
| 2020 | £335,493 | 1% |
103 Properties |
| 2019 | £333,113 | -1% |
111 Properties |
| 2018 | £336,935 | -0,4% |
127 Properties |
| 2017 | £338,346 | 6% |
146 Properties |
| 2016 | £318,876 | 18% |
124 Properties |
| 2015 | £260,370 | 9% |
172 Properties |
| 2014 | £236,515 | 10% |
191 Properties |
| 2013 | £213,880 | -1% |
143 Properties |
| 2012 | £215,670 | 1% |
96 Properties |
| 2011 | £213,057 | 10% |
91 Properties |
| 2010 | £192,033 | -0,2% |
118 Properties |
| 2009 | £192,411 | -13% |
101 Properties |
| 2008 | £216,740 | 5% |
134 Properties |
| 2007 | £206,896 | 8% |
265 Properties |
| 2006 | £191,258 | 4% |
292 Properties |
| 2005 | £182,867 | 6% |
197 Properties |
| 2004 | £171,927 | 4% |
284 Properties |
| 2003 | £164,293 | 15% |
239 Properties |
| 2002 | £138,841 | 10% |
281 Properties |
| 2001 | £125,165 | 2% |
265 Properties |
| 2000 | £122,347 | 26% |
250 Properties |
| 1999 | £90,518 | 9% |
289 Properties |
| 1998 | £81,984 | 11% |
254 Properties |
| 1997 | £73,138 | 11% |
253 Properties |
| 1996 | £64,970 | -3% |
331 Properties |
| 1995 | £67,183 | - |
140 Properties |
Property Price per Property Type in Haymill And Lynch Hill
Here you can find historic sold price data in order to help with your property search.
The average Property Paid Price for specific property types in the last three years are:
| Property Type | Average Sold Price | Sold Properties |
|---|---|---|
| Flat | £232,212.00 | 147 Flats |
| Semi Detached House | £467,351.00 | 82 Semi Detached Houses |
| Detached House | £656,250.00 | 64 Detached Houses |
| Terraced House | £394,002.00 | 119 Terraced Houses |