
Houses for sale & to rent in Wexham Lea, Slough
House Prices in Wexham Lea
Properties in Wexham Lea have an average house price of £393k and had 183 Property Transactions within the last 3 years¹.
Wexham Lea is an area in Slough, Slough with 3,430 households², where the most expensive property was sold for £1.01M.
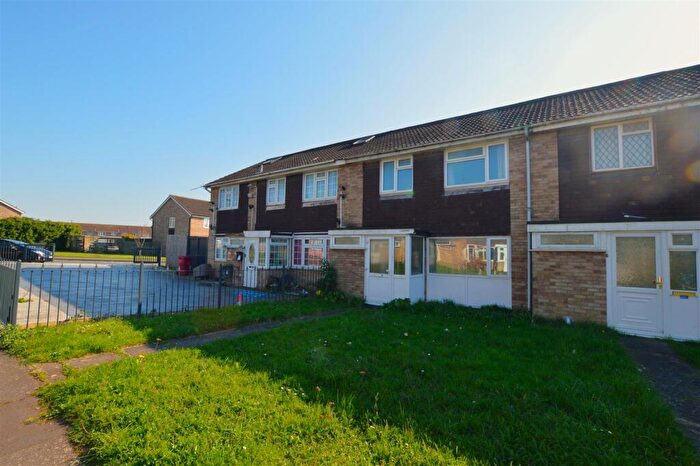
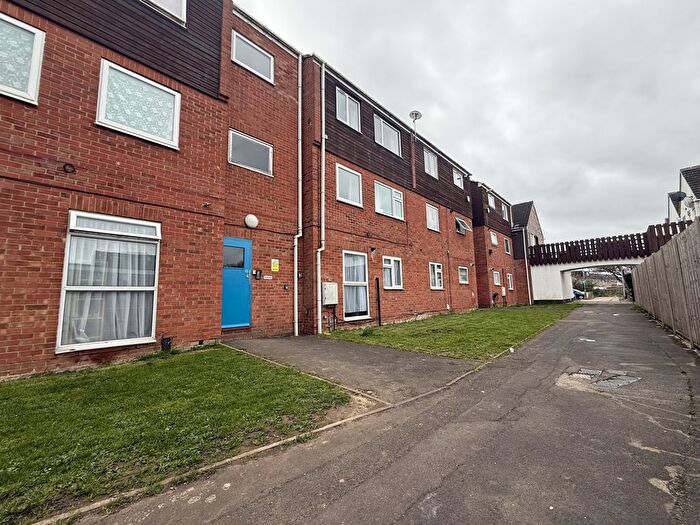
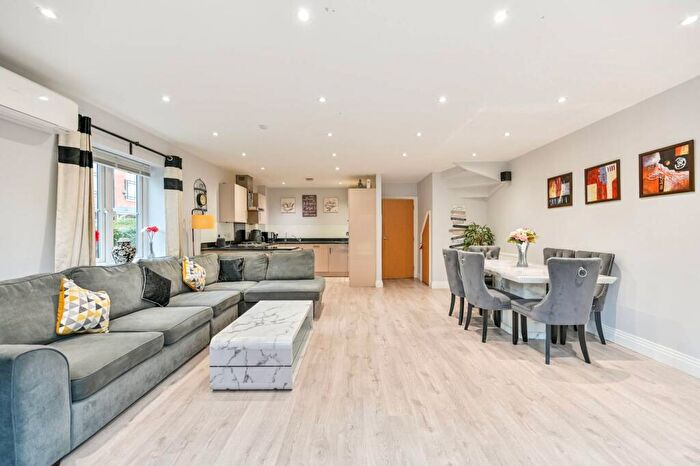
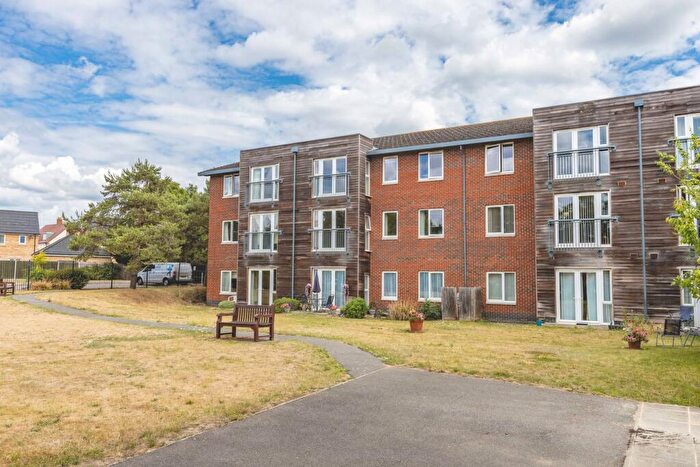
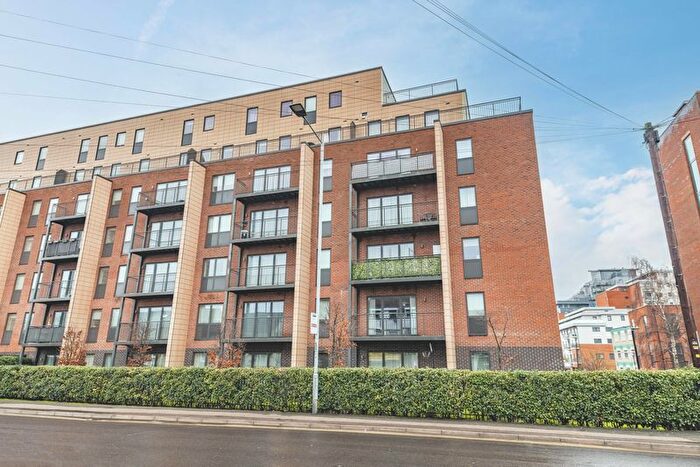
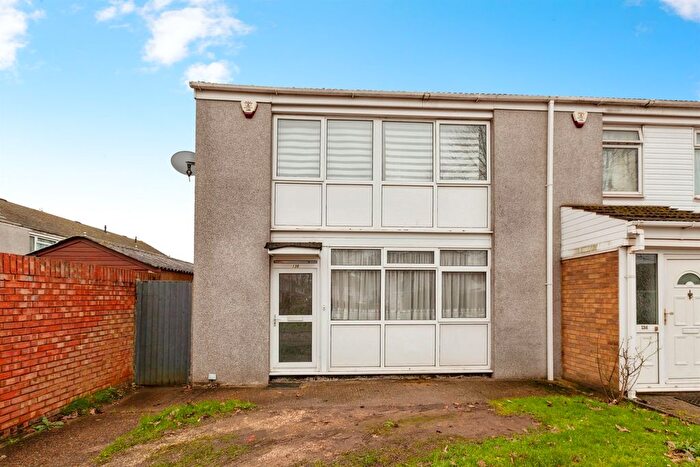
Properties for sale in Wexham Lea
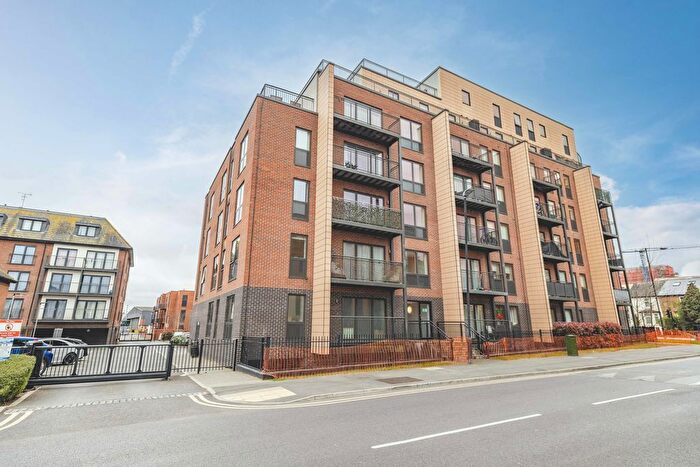
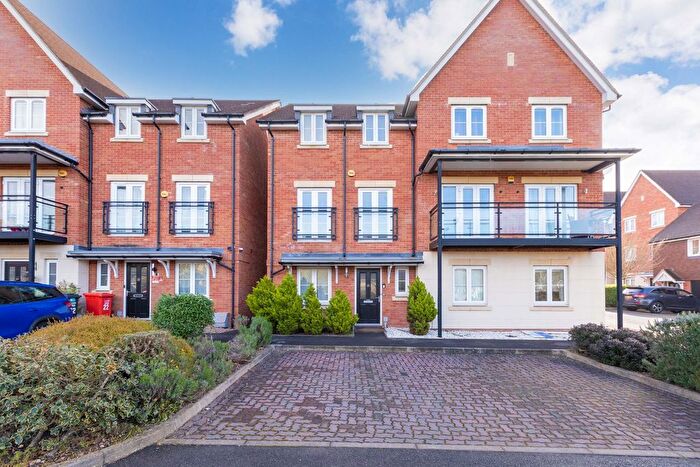
![]()
If you are looking to sell your house, let it out, or receive a property valuation, an expert can help you.
Click the button below to get started.

Roads and Postcodes in Wexham Lea
Navigate through our locations to find the location of your next house in Wexham Lea, Slough for sale or to rent.
Transport near Wexham Lea


- FAQ
- Price Paid By Year
- Property Type Price
Frequently asked questions about Wexham Lea
What is the average price for a property for sale in Wexham Lea?
The average price for a property for sale in Wexham Lea is £392,527. This amount is 3% higher than the average price in Slough. There are 672 property listings for sale in Wexham Lea.
What streets have the most expensive properties for sale in Wexham Lea?
The streets with the most expensive properties for sale in Wexham Lea are Century Lane at an average of £548,750, Dornels at an average of £522,000 and Fernleigh Row at an average of £520,000.
What streets have the most affordable properties for sale in Wexham Lea?
The streets with the most affordable properties for sale in Wexham Lea are Forest Close at an average of £159,375, Preston Road at an average of £207,000 and Holmedale at an average of £210,500.
Which train stations are available in or near Wexham Lea?
Some of the train stations available in or near Wexham Lea are Slough, Langley and Datchet.
Property Price Paid in Wexham Lea by Year
The average sold property price by year was:
| Year | Average Sold Price | Price Change |
Sold Properties
|
|---|---|---|---|
| 2026 | £590,000 | 32% |
1 Property |
| 2025 | £401,868 | 1% |
47 Properties |
| 2024 | £398,343 | 6% |
72 Properties |
| 2023 | £375,776 | -2% |
63 Properties |
| 2022 | £385,120 | 9% |
61 Properties |
| 2021 | £350,789 | -3% |
82 Properties |
| 2020 | £361,896 | -11% |
69 Properties |
| 2019 | £401,818 | 2% |
91 Properties |
| 2018 | £394,191 | 19% |
105 Properties |
| 2017 | £320,226 | 3% |
71 Properties |
| 2016 | £311,905 | 17% |
67 Properties |
| 2015 | £259,159 | 8% |
77 Properties |
| 2014 | £239,632 | 5% |
83 Properties |
| 2013 | £228,767 | 9% |
88 Properties |
| 2012 | £209,235 | 9% |
58 Properties |
| 2011 | £191,114 | 1% |
59 Properties |
| 2010 | £190,043 | -6% |
56 Properties |
| 2009 | £201,982 | -6% |
97 Properties |
| 2008 | £214,587 | 1% |
73 Properties |
| 2007 | £211,488 | 11% |
149 Properties |
| 2006 | £189,274 | 6% |
153 Properties |
| 2005 | £178,841 | 4% |
130 Properties |
| 2004 | £171,246 | 6% |
155 Properties |
| 2003 | £160,487 | 22% |
168 Properties |
| 2002 | £125,019 | 13% |
161 Properties |
| 2001 | £108,287 | 12% |
153 Properties |
| 2000 | £95,602 | 22% |
151 Properties |
| 1999 | £74,966 | 6% |
152 Properties |
| 1998 | £70,842 | 13% |
127 Properties |
| 1997 | £61,344 | 4% |
130 Properties |
| 1996 | £58,728 | 7% |
102 Properties |
| 1995 | £54,671 | - |
109 Properties |
Property Price per Property Type in Wexham Lea
Here you can find historic sold price data in order to help with your property search.
The average Property Paid Price for specific property types in the last three years are:
| Property Type | Average Sold Price | Sold Properties |
|---|---|---|
| Flat | £203,651.00 | 38 Flats |
| Semi Detached House | £461,568.00 | 44 Semi Detached Houses |
| Detached House | £575,107.00 | 7 Detached Houses |
| Terraced House | £422,968.00 | 94 Terraced Houses |