Houses for sale & to rent in Knoll, Highbridge
House Prices in Knoll
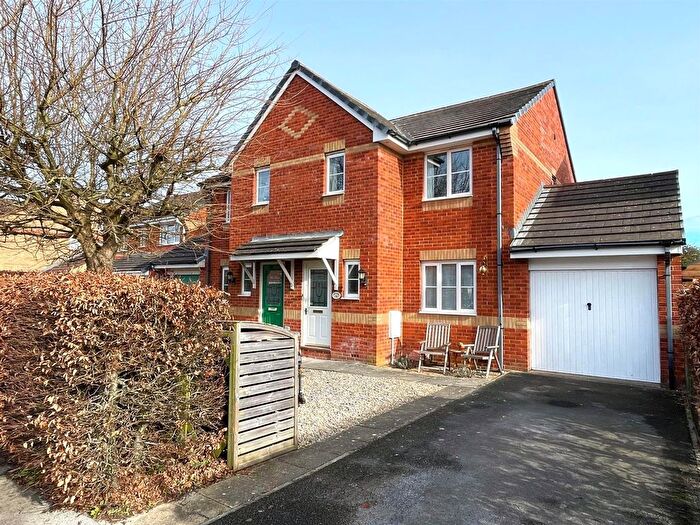
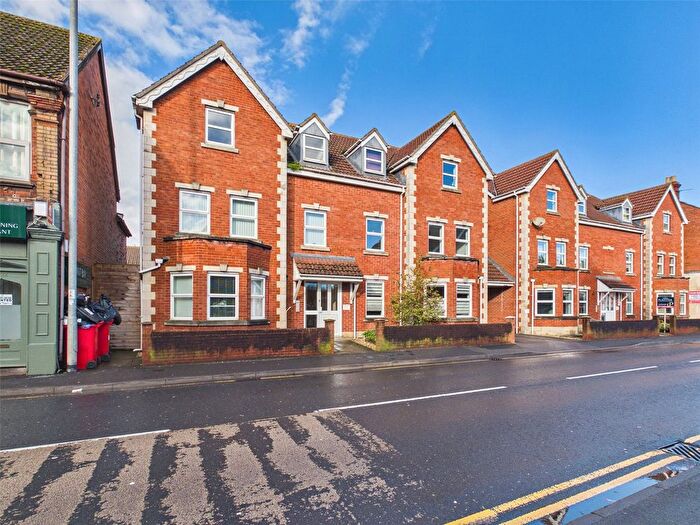
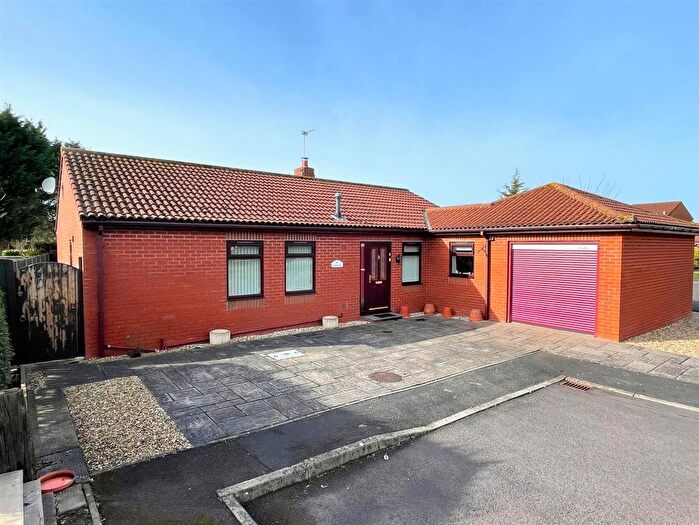
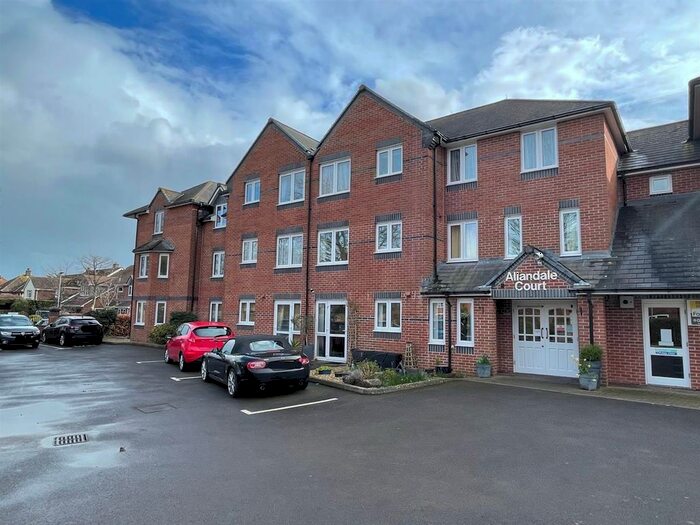
Properties in Knoll have an average house price of £428,030.00 and had 104 Property Transactions within the last 3 years¹.
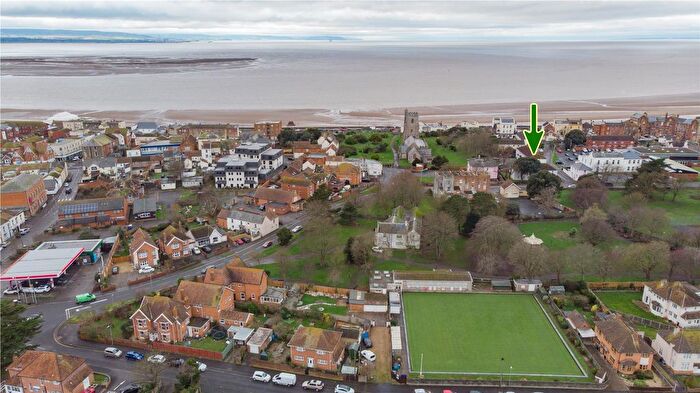
Knoll is an area in Highbridge, Somerset with 1,371 households², where the most expensive property was sold for £1,130,000.00.
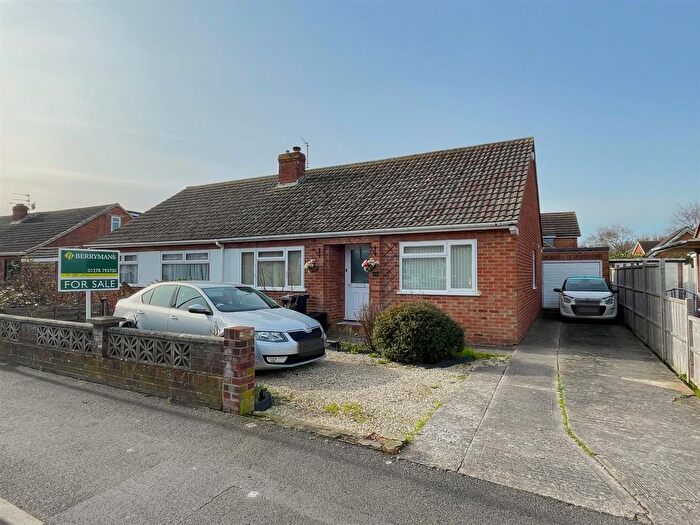
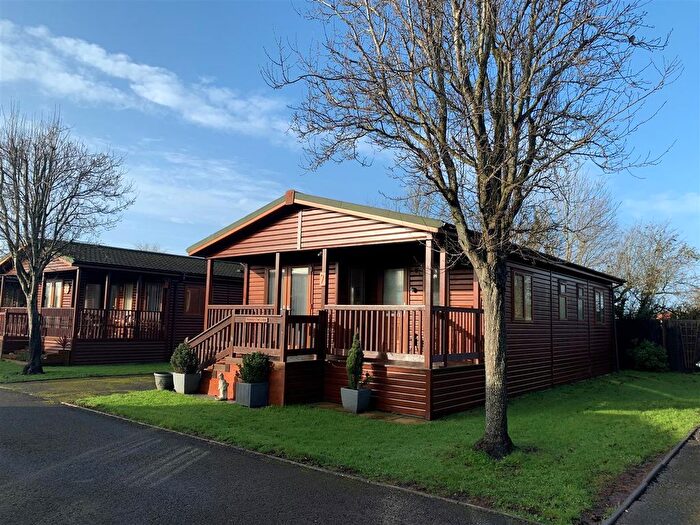
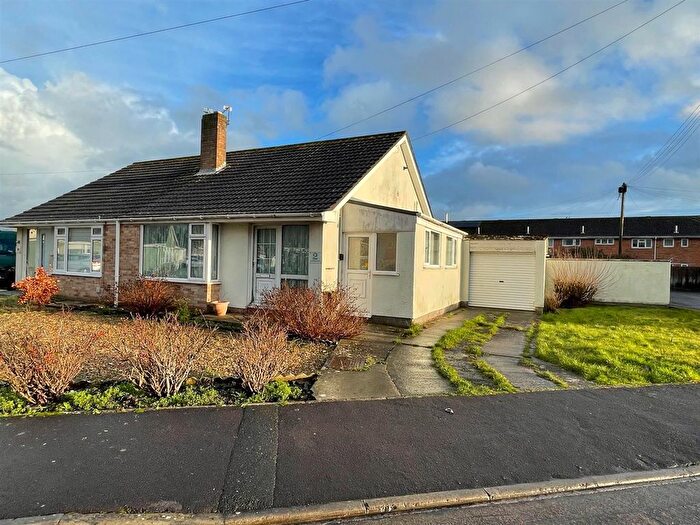
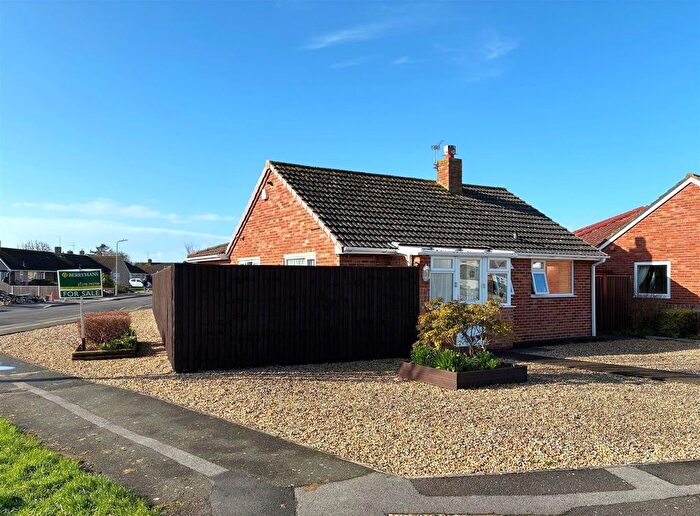
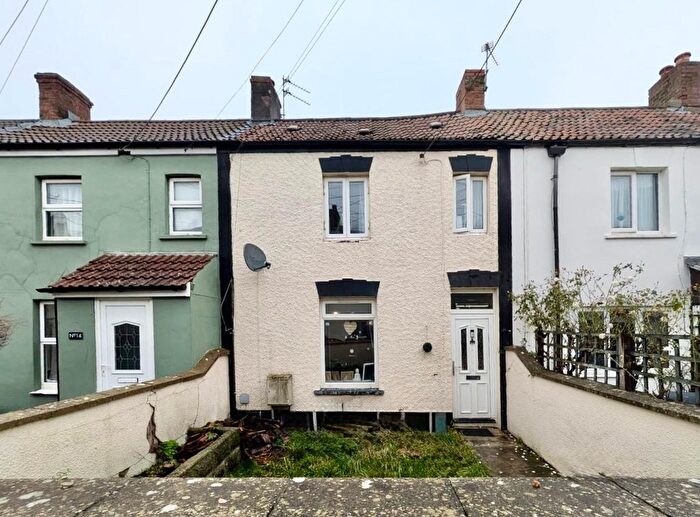
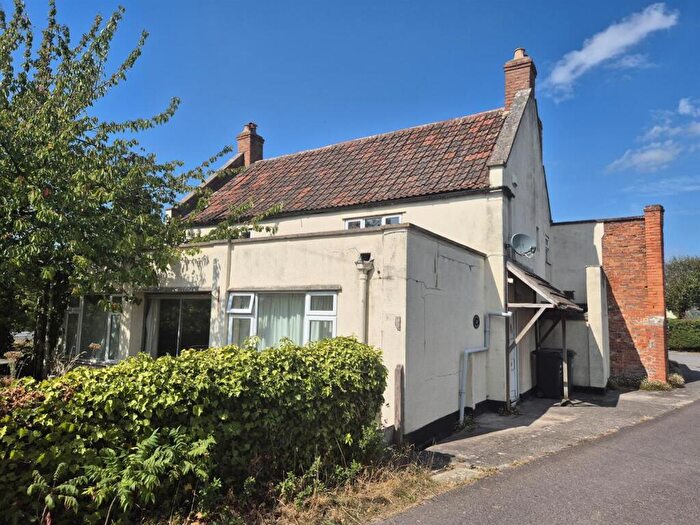
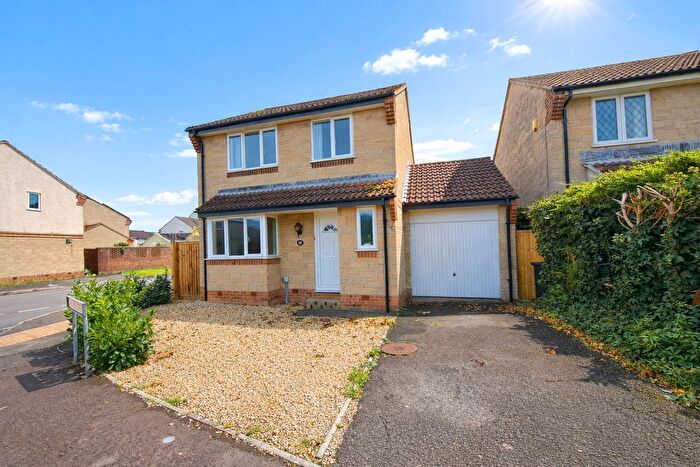
Properties for sale in Knoll
Roads and Postcodes in Knoll
Navigate through our locations to find the location of your next house in Knoll, Highbridge for sale or to rent.
| Streets | Postcodes |
|---|---|
| Ash Trees | TA9 4DQ |
| Ashlea Park | TA9 3QQ |
| Bason Bridge | TA9 4RF |
| Battleborough Lane | TA9 4DS TA9 4AS |
| Belle Vue Villas | TA9 4BW |
| Brent Close | TA9 4EB |
| Brent Corner | TA9 4BN |
| Brent Hill | TA9 4DE |
| Brent Knoll | TA9 4AP |
| Brent Road | TA9 4DB TA9 4HY TA9 4JD TA9 4JG |
| Brent Street | TA9 4BB TA9 4BE TA9 4DT TA9 4DU TA9 4DX TA9 4EH TA9 4EQ |
| Bridgwater Road | TA9 4HP TA9 4HR |
| Bristol Road | TA9 4HA TA9 4HG TA9 4HJ TA9 4HL TA9 4HH |
| Burton Row | TA9 4BP TA9 4BX TA9 4BY TA9 4DA |
| Catherine Street | TA9 3PX |
| Cedar Close | TA9 4EE |
| Chapel Lane | TA9 3NQ |
| Chestnut Close | TA9 3FQ |
| Church Close | TA9 3QF |
| Church Lane | TA9 3PJ TA9 4DG TA9 4EG |
| Church Lane Corner | TA9 4EF |
| Church Road | TA9 3NG TA9 3PG TA9 3PL TA9 3PQ TA9 4HZ TA9 4RG TA9 4RL |
| Church View | TA9 3PW |
| Combe Terrace | TA9 3PP |
| Coombe Side | TA9 4ED |
| Cornmoor Crescent | TA9 3NY |
| Cornmoor Lane | TA9 3NZ |
| Cote | TA9 3PD TA9 3PE |
| Cote Corner | TA9 3PB |
| Crooked Lane | TA9 4BQ |
| Durston Cottage | TA9 4RA |
| East Drive | TA9 4JQ |
| East Ride | TA9 4EA |
| Edithmead | TA9 4HF |
| Edithmead Lane | TA9 4HB |
| Factory Lane | TA9 4RN |
| Hackness Road | TA9 3PR |
| Ham Road | TA9 4BJ |
| Harp Road | TA9 4HQ |
| Hill Lane | TA9 4DF TA9 4DD |
| Jarvis Lane | TA9 4HS |
| Johnson Close | TA9 4RZ |
| Lake House Lane | TA9 4HN |
| Land Adjoining | TA9 4HE |
| Laurel Avenue | TA9 4BD |
| Manor Close | TA9 4JF |
| Manor Ride | TA9 4DY TA9 4DZ |
| Mead Close | TA9 3NF |
| Meadow Drive | TA9 3GT |
| Mercia Close | TA9 3NT |
| Merry Lane | TA9 3PS |
| Middle Street | TA9 4BT |
| Mill Lane | TA9 3NR |
| New Road | TA9 3PT TA9 3PU TA9 3PZ TA9 3QB TA9 3QA |
| Newmans Lane | TA9 4RH TA9 4RJ |
| Northwick | TA9 4PF |
| Nut Tree Close | TA9 3PN |
| Old Bristol Road | TA9 4HT TA9 4HU TA9 4HX |
| Orchard Close | TA9 3HH TA9 4JL |
| Pillmore Lane | TA9 4JZ TA9 4LB |
| Popham Close | TA9 4RY |
| Poples Bow | TA9 4EZ |
| Portland Place | TA9 4EL |
| Prospect Close | TA9 4JW |
| Puddys Lane | TA9 4LA |
| Red House Road | TA9 4RX |
| South Brent Close | TA9 4BS |
| Southwick Road | TA9 4RE |
| Station Road | TA9 4BH |
| Stoddens Lane | TA9 4HD |
| Strowlands | TA9 4JH |
| The Mead | TA9 4JJ |
| The Willows | TA9 4EJ |
| Toomer Close | TA9 4AE |
| Vole Road | TA9 4PE |
| West Road | TA9 4BZ |
| Weston Road | TA9 4JE |
| Wick Lane | TA9 4BU |
| Wickham Way | TA9 4JB |
| Willow Close | TA9 3NU TA9 3NX |
| Withy Grove | TA9 3NP |
| Withy Road | TA9 3NS TA9 3NW |
| TA9 3PA TA9 4RB TA9 4RD TA9 3PH TA9 4JN TA9 4LD |
Transport near Knoll
-
Highbridge and Burnham Station
-
Weston-Super-Mare Station
-
Bridgwater Station
-
Weston Milton Station
-
Worle Station
- FAQ
- Price Paid By Year
- Property Type Price
Frequently asked questions about Knoll
What is the average price for a property for sale in Knoll?
The average price for a property for sale in Knoll is £428,030. This amount is 44% higher than the average price in Highbridge. There are 842 property listings for sale in Knoll.
What streets have the most expensive properties for sale in Knoll?
The streets with the most expensive properties for sale in Knoll are Cote at an average of £755,000, Brent Road at an average of £655,000 and Catherine Street at an average of £641,500.
What streets have the most affordable properties for sale in Knoll?
The streets with the most affordable properties for sale in Knoll are Orchard Close at an average of £178,550, Manor Close at an average of £230,000 and East Ride at an average of £243,000.
Which train stations are available in or near Knoll?
Some of the train stations available in or near Knoll are Highbridge and Burnham, Weston-Super-Mare and Bridgwater.
Property Price Paid in Knoll by Year
The average sold property price by year was:
| Year | Average Sold Price | Price Change |
Sold Properties
|
|---|---|---|---|
| 2025 | £432,006 | 15% |
33 Properties |
| 2024 | £365,967 | -29% |
31 Properties |
| 2023 | £472,849 | 6% |
40 Properties |
| 2022 | £442,163 | 15% |
53 Properties |
| 2021 | £374,306 | 4% |
68 Properties |
| 2020 | £358,550 | 6% |
49 Properties |
| 2019 | £338,668 | -1% |
48 Properties |
| 2018 | £340,625 | 5% |
45 Properties |
| 2017 | £324,768 | 17% |
58 Properties |
| 2016 | £270,098 | -7% |
57 Properties |
| 2015 | £288,756 | 13% |
48 Properties |
| 2014 | £251,489 | -1% |
61 Properties |
| 2013 | £254,026 | -8% |
39 Properties |
| 2012 | £273,341 | 5% |
43 Properties |
| 2011 | £258,579 | -4% |
44 Properties |
| 2010 | £269,841 | 16% |
48 Properties |
| 2009 | £227,318 | -29% |
27 Properties |
| 2008 | £293,747 | 9% |
22 Properties |
| 2007 | £268,454 | -6% |
72 Properties |
| 2006 | £284,509 | 6% |
70 Properties |
| 2005 | £267,503 | 14% |
36 Properties |
| 2004 | £228,804 | 10% |
54 Properties |
| 2003 | £205,875 | 11% |
55 Properties |
| 2002 | £184,151 | 23% |
70 Properties |
| 2001 | £141,357 | 0,4% |
85 Properties |
| 2000 | £140,721 | 10% |
76 Properties |
| 1999 | £126,633 | 6% |
88 Properties |
| 1998 | £118,929 | 13% |
76 Properties |
| 1997 | £103,680 | 3% |
79 Properties |
| 1996 | £100,929 | 6% |
70 Properties |
| 1995 | £94,764 | - |
66 Properties |
Property Price per Property Type in Knoll
Here you can find historic sold price data in order to help with your property search.
The average Property Paid Price for specific property types in the last three years are:
| Property Type | Average Sold Price | Sold Properties |
|---|---|---|
| Semi Detached House | £339,462.00 | 27 Semi Detached Houses |
| Detached House | £506,476.00 | 64 Detached Houses |
| Terraced House | £253,019.00 | 10 Terraced Houses |
| Flat | £135,000.00 | 3 Flats |

