Houses for sale & to rent in Burnham North, Burnham-on-sea
House Prices in Burnham North
Properties in Burnham North have an average house price of £295,705.00 and had 364 Property Transactions within the last 3 years¹.
Burnham North is an area in Burnham-on-sea, Somerset with 2,946 households², where the most expensive property was sold for £1,400,000.00.
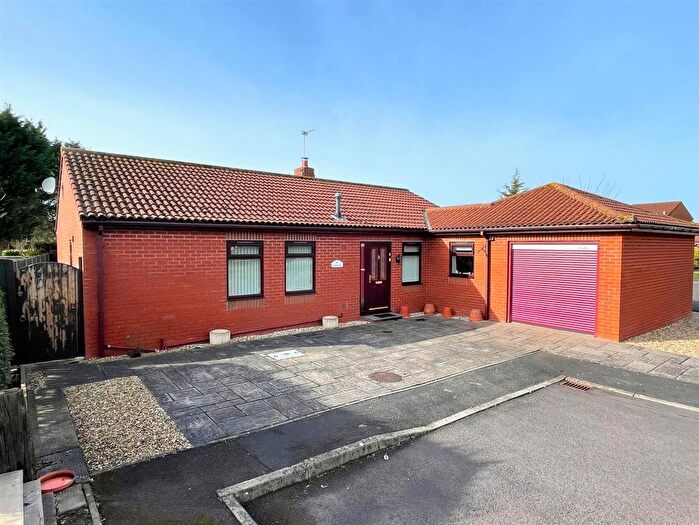
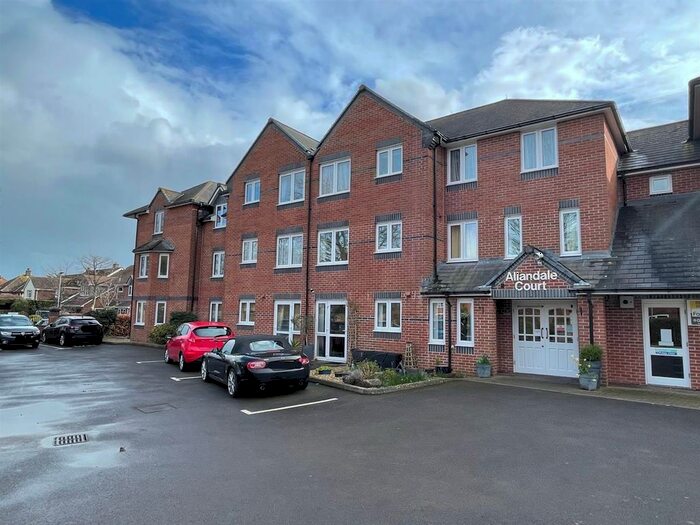
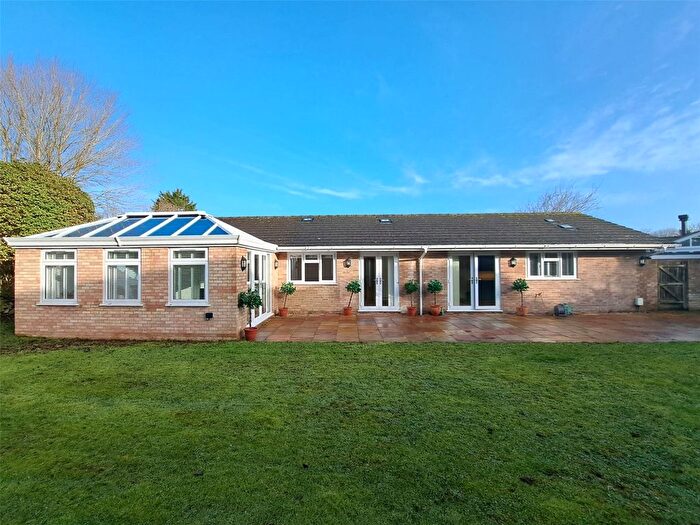
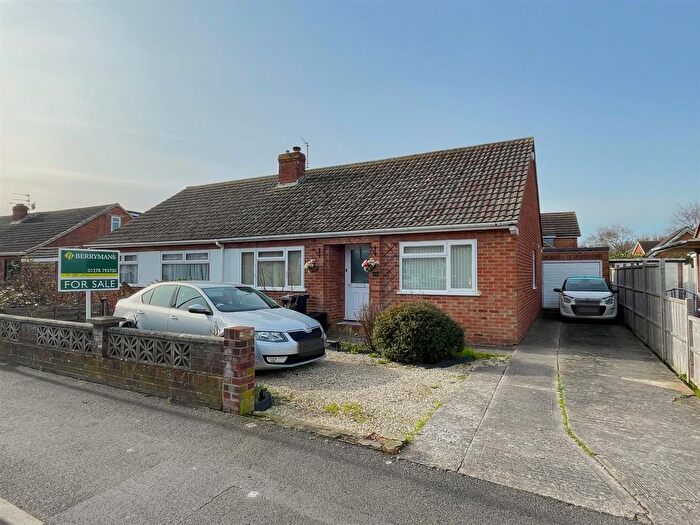
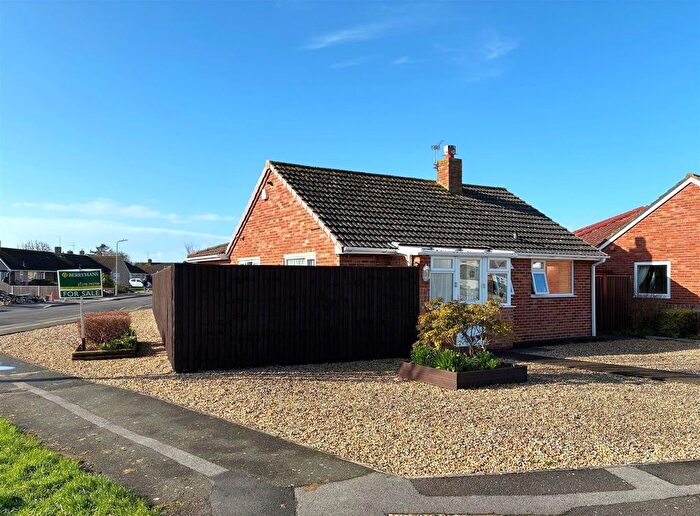
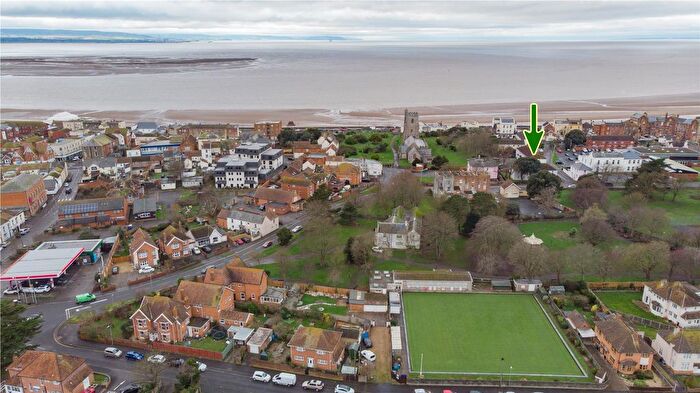
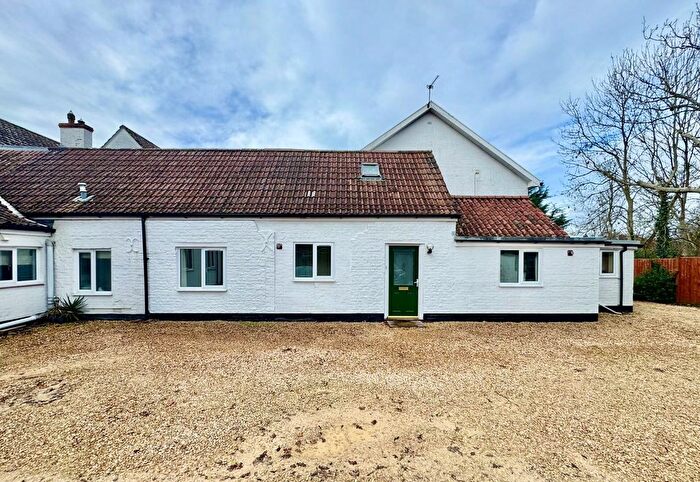
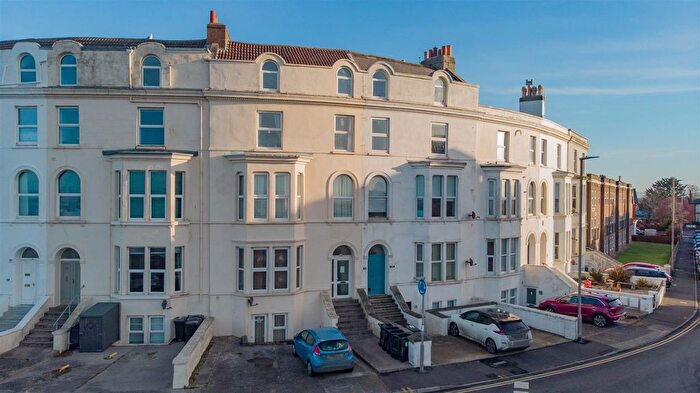
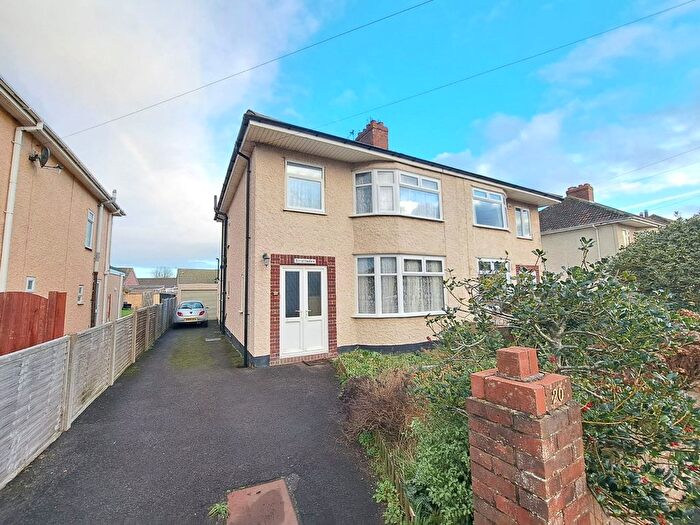
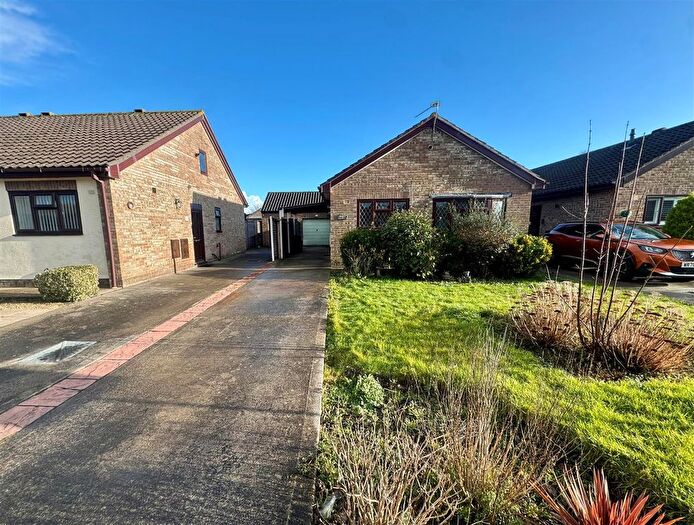
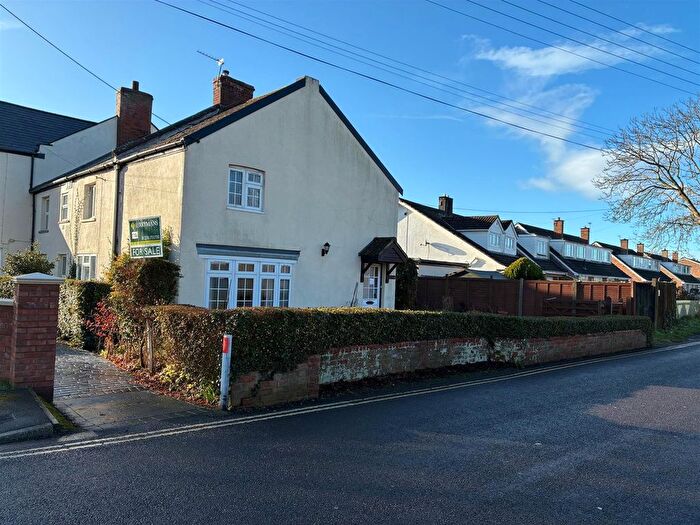
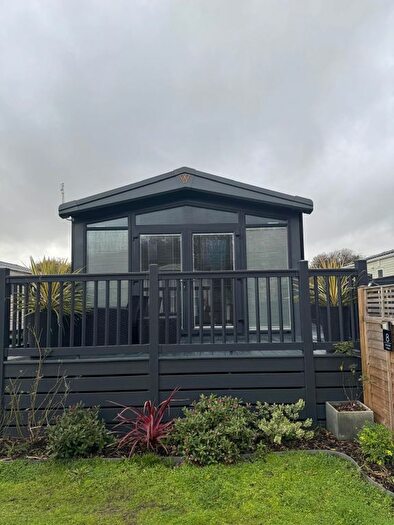
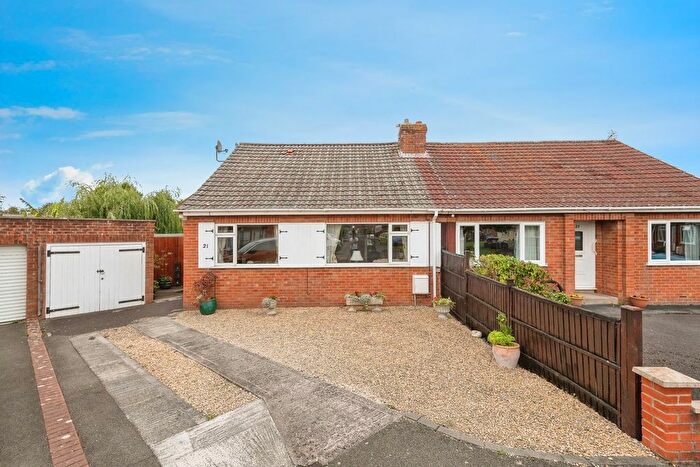
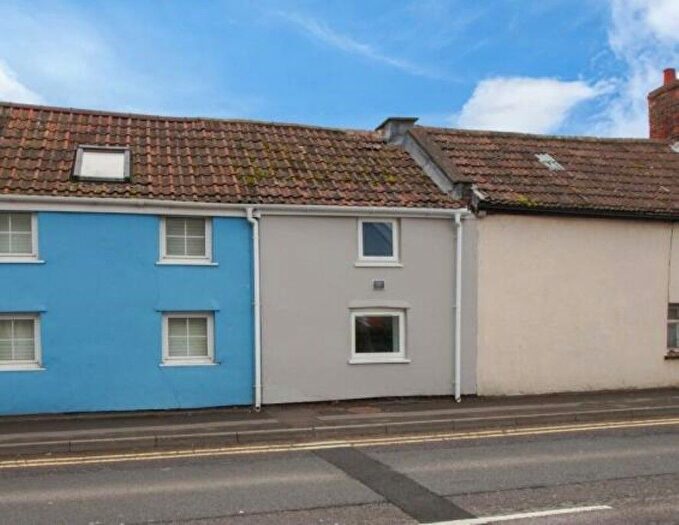
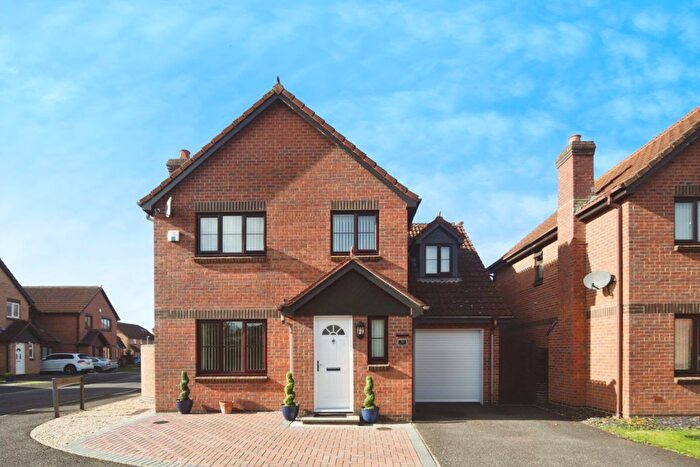
Properties for sale in Burnham North
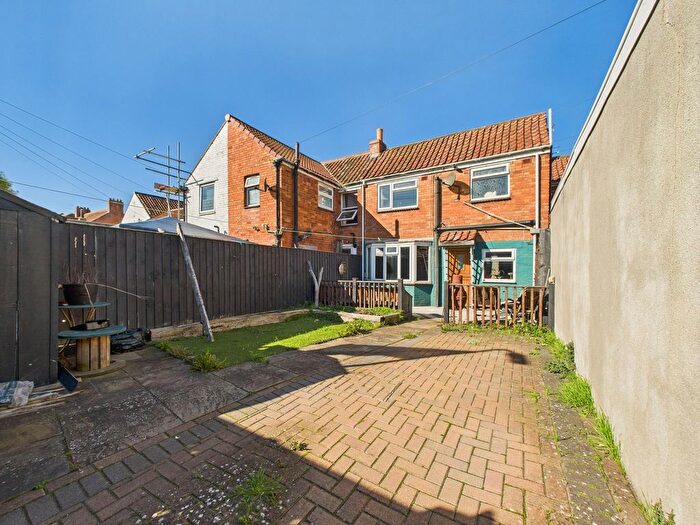
Previously listed properties in Burnham North
Roads and Postcodes in Burnham North
Navigate through our locations to find the location of your next house in Burnham North, Burnham-on-sea for sale or to rent.
| Streets | Postcodes |
|---|---|
| Allandale Road | TA8 2HG |
| Ash Tree Close | TA8 2JZ |
| Ash Tree Crescent | TA8 2JY |
| Ash Tree Place | TA8 2LA |
| Ash Tree Road | TA8 2LB TA8 2LD |
| Atlanta Key | TA8 2AL |
| Atyeo Close | TA8 2EJ |
| Axbridge Close | TA8 2FA |
| Balmoral Drive | TA8 2DG |
| Berrow Road | TA8 2ET TA8 2EX TA8 2EY TA8 2EZ TA8 2GZ TA8 2HJ TA8 2HN TA8 2HZ TA8 2JE TA8 2JF TA8 2JG TA8 2PF TA8 2PG TA8 2PH TA8 2PN TA8 2ES |
| Blythe Way | TA8 2LF |
| Braithwaite Place | TA8 2PJ |
| Brambles Road | TA8 2PY |
| Brent Broad | TA8 2PX |
| Brightstowe Road | TA8 2HP TA8 2HW |
| Cadbury Close | TA8 2UL |
| Caernarvon Way | TA8 2DQ |
| Chapel Street | TA8 1AU |
| Charlestone Road | TA8 2AP |
| Cheddar Close | TA8 2FD |
| Chichester Close | TA8 2AR |
| Coleridge Gardens | TA8 2QA |
| College Street | TA8 1AR TA8 1AT TA8 1AE |
| Conway Crescent | TA8 2SL TA8 2UW |
| Creswick Way | TA8 2EH |
| Eastleigh Close | TA8 2EW |
| Edith Close | TA8 2NR |
| Enmore Close | TA8 2FB |
| Esplanade | TA8 1BQ TA8 2AG TA8 2AH TA8 2AQ |
| Finches Way | TA8 2QQ |
| Gardenhurst | TA8 2QG |
| Gardenhurst Close | TA8 2EQ |
| George Street | TA8 1BA |
| Golf Links Mews | TA8 2QL |
| Golf Links Road | TA8 2PP TA8 2PW |
| Gore Road | TA8 2HL |
| Grove Road | TA8 2HF TA8 2EB |
| Hall Terrace | TA8 2EU |
| Harbourne Close | TA8 2SR |
| Herbert Road | TA8 2HE |
| High Street | TA8 1AG TA8 1NP TA8 1PE |
| Hillsborough Gardens | TA8 2DH |
| Kinver Terrace | TA8 1BH |
| Knoll View | TA8 2DY |
| Links Close | TA8 2JD |
| Links Gardens | TA8 2LG TA8 2PT TA8 2PU |
| Love Lane | TA8 1ED |
| Maddocks Slade | TA8 2AN |
| Magpie Close | TA8 2QH |
| Manor Road | TA8 2AS |
| Marlborough Court | TA8 2PZ |
| Martins Close | TA8 2JX |
| Marwood Close | TA8 2ED |
| Meadowcroft Drive | TA8 2SU |
| Mountbatten Close | TA8 2HT |
| Myrtle Drive | TA8 2HB TA8 2HY |
| Naish Road | TA8 2LE |
| Newton Close | TA8 2PL |
| Nightingale Close | TA8 2QJ |
| Nunney Close | TA8 2UN |
| Oak Tree Place | TA8 2LH |
| Oxford Street | TA8 1EF |
| Palmers Close | TA8 2SS |
| Parnell Way | TA8 2EG |
| Patricia Close | TA8 2NT |
| Pembroke Close | TA8 2EN |
| Pizey Avenue | TA8 2HS |
| Poplar Road | TA8 2HD |
| Princess Street | TA8 1EH |
| Ravensworth Terrace | TA8 1EP |
| Rectory Drive | TA8 2DT TA8 2DU |
| Rectory Lawn | TA8 2DP |
| Rectory Place | TA8 2DZ |
| Rectory Road | TA8 2BT TA8 2BX TA8 2BY TA8 2BZ |
| Regency Close | TA8 2PB |
| Regent Street | TA8 1AX TA8 1AB |
| Saxondale Avenue | TA8 2PR TA8 2PS |
| Seaview Road | TA8 2AJ |
| Shelley Close | TA8 2NX |
| Shelley Drive | TA8 2QD TA8 2QE TA8 2QF |
| Sidmouth Close | TA8 2SX |
| Southernlea Road | TA8 2EP TA8 2ER |
| Spaxton Close | TA8 2FE |
| St Andrews Road | TA8 2AT TA8 2AU |
| St Anns Drive | TA8 2HR |
| St Christophers Way | TA8 2PD TA8 2PE |
| St Johns Road | TA8 2AX |
| St Marys Road | TA8 2AY TA8 2AZ TA8 2BA |
| St Pauls Road | TA8 2BH |
| Stoddens Lane | TA8 2DF |
| Stoddens Road | TA8 2DA TA8 2DB TA8 2DD TA8 2DE TA8 2EL TA8 2NZ TA8 2BS |
| Stoddens Walk | TA8 2DX |
| Stoneleigh Close | TA8 2EE TA8 2EF |
| The Colony | TA8 2HA |
| The Drive | TA8 2PQ |
| The Grove | TA8 2PA |
| The Grove Mews | TA8 2HU TA8 2BU |
| The Orchids | TA8 2NU |
| Tidball Close | TA8 2BP |
| Trinity Close | TA8 2HH |
| Trinity Rise | TA8 2HQ |
| Vicarage Street | TA8 1DX |
| Victoria Cottages | TA8 1AP |
| Victoria Street | TA8 1AL TA8 1AN TA8 1AW TA8 1EQ |
| Warwick Gardens | TA8 2ST |
| Watson Close | TA8 2NS |
| Wedmore Close | TA8 2SY |
| Westfield Close | TA8 2DL |
| Westfield Court | TA8 2DW |
| Westfield Drive | TA8 2DR TA8 2DS |
| Westfield Lawn | TA8 2DN |
| Westfield Road | TA8 2AW TA8 2AE TA8 2AF |
| Westmere Crescent | TA8 2EA |
| Windsor Close | TA8 2DJ |
| Wordsworth Close | TA8 2QB |
Transport near Burnham North
-
Highbridge and Burnham Station
-
Weston-Super-Mare Station
-
Weston Milton Station
-
Bridgwater Station
-
Worle Station
- FAQ
- Price Paid By Year
- Property Type Price
Frequently asked questions about Burnham North
What is the average price for a property for sale in Burnham North?
The average price for a property for sale in Burnham North is £295,705. This amount is 5% higher than the average price in Burnham-on-sea. There are 276 property listings for sale in Burnham North.
What streets have the most expensive properties for sale in Burnham North?
The streets with the most expensive properties for sale in Burnham North are Trinity Rise at an average of £760,000, The Grove at an average of £732,500 and Gardenhurst at an average of £678,331.
What streets have the most affordable properties for sale in Burnham North?
The streets with the most affordable properties for sale in Burnham North are Victoria Street at an average of £44,000, Myrtle Drive at an average of £125,000 and Rectory Road at an average of £140,848.
Which train stations are available in or near Burnham North?
Some of the train stations available in or near Burnham North are Highbridge and Burnham, Weston-Super-Mare and Weston Milton.
Property Price Paid in Burnham North by Year
The average sold property price by year was:
| Year | Average Sold Price | Price Change |
Sold Properties
|
|---|---|---|---|
| 2025 | £290,329 | -1% |
108 Properties |
| 2024 | £291,937 | -4% |
129 Properties |
| 2023 | £304,104 | -1% |
127 Properties |
| 2022 | £308,256 | 8% |
131 Properties |
| 2021 | £284,603 | 16% |
180 Properties |
| 2020 | £240,287 | -3% |
111 Properties |
| 2019 | £246,527 | -9% |
130 Properties |
| 2018 | £268,229 | 10% |
154 Properties |
| 2017 | £241,399 | 10% |
151 Properties |
| 2016 | £216,254 | 1% |
177 Properties |
| 2015 | £213,544 | 4% |
141 Properties |
| 2014 | £205,945 | 4% |
154 Properties |
| 2013 | £198,504 | 1% |
136 Properties |
| 2012 | £196,930 | 6% |
114 Properties |
| 2011 | £185,046 | 1% |
127 Properties |
| 2010 | £182,586 | 9% |
125 Properties |
| 2009 | £166,796 | -18% |
115 Properties |
| 2008 | £197,275 | -3% |
100 Properties |
| 2007 | £202,540 | 0,4% |
202 Properties |
| 2006 | £201,703 | 10% |
249 Properties |
| 2005 | £182,291 | 4% |
172 Properties |
| 2004 | £175,766 | 13% |
197 Properties |
| 2003 | £152,879 | 11% |
199 Properties |
| 2002 | £135,645 | 20% |
198 Properties |
| 2001 | £108,681 | 12% |
200 Properties |
| 2000 | £96,106 | 12% |
179 Properties |
| 1999 | £84,127 | 18% |
192 Properties |
| 1998 | £68,787 | -3% |
190 Properties |
| 1997 | £70,677 | 9% |
206 Properties |
| 1996 | £64,488 | 2% |
196 Properties |
| 1995 | £63,184 | - |
167 Properties |
Property Price per Property Type in Burnham North
Here you can find historic sold price data in order to help with your property search.
The average Property Paid Price for specific property types in the last three years are:
| Property Type | Average Sold Price | Sold Properties |
|---|---|---|
| Flat | £138,360.00 | 86 Flats |
| Semi Detached House | £306,583.00 | 108 Semi Detached Houses |
| Detached House | £395,816.00 | 140 Detached Houses |
| Terraced House | £240,416.00 | 30 Terraced Houses |

