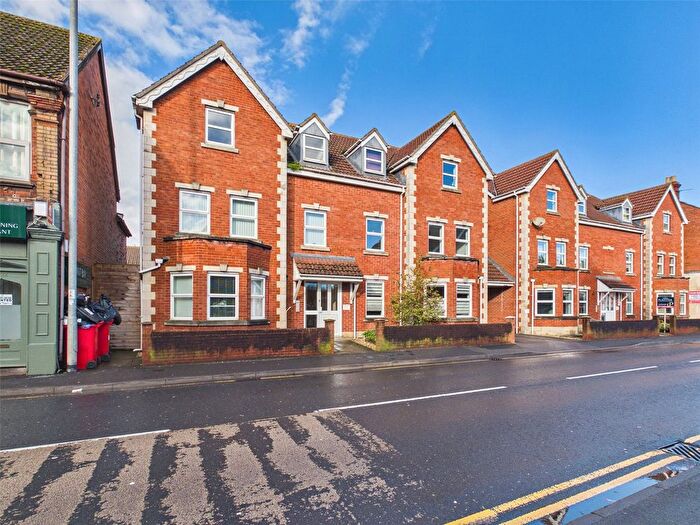
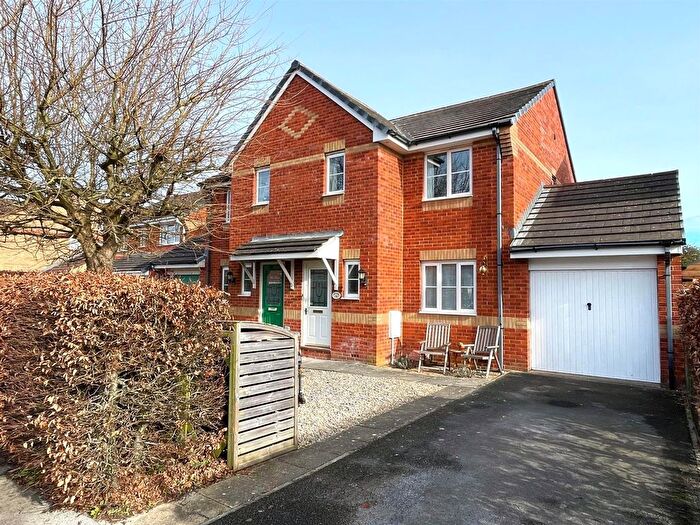
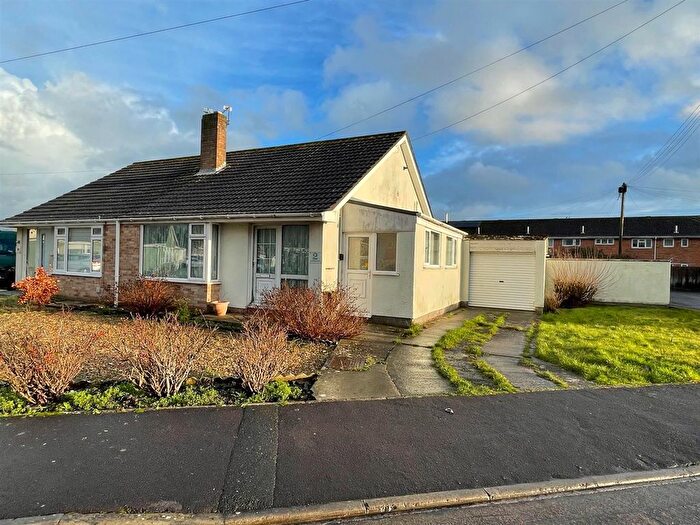
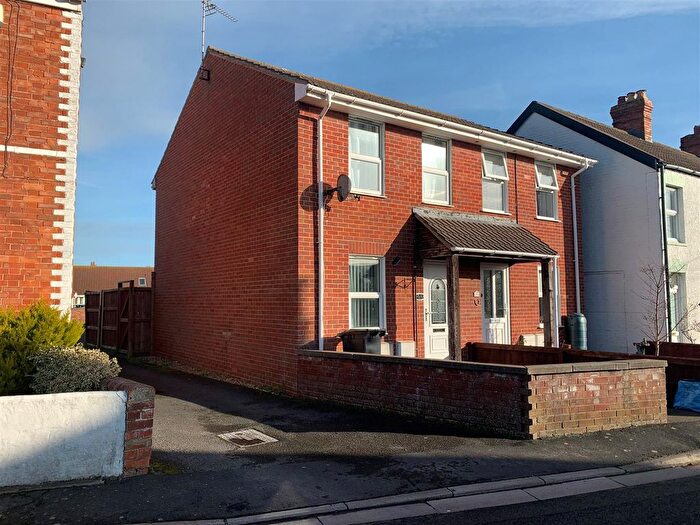
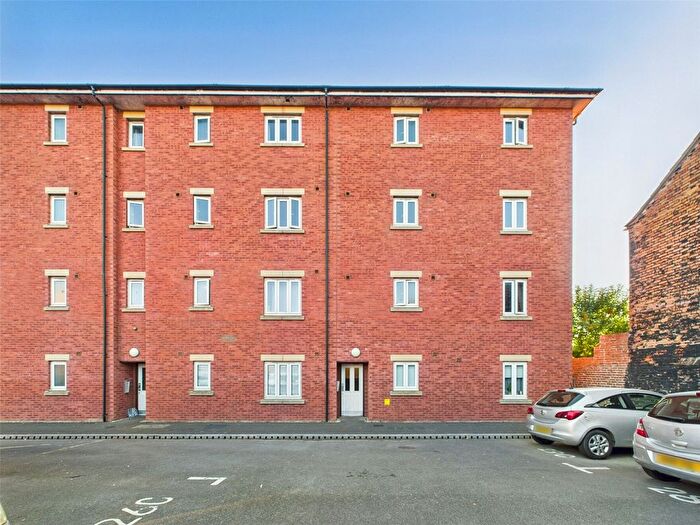
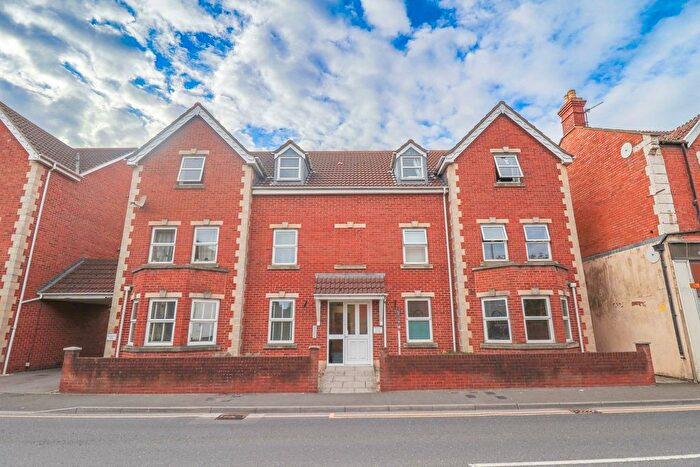
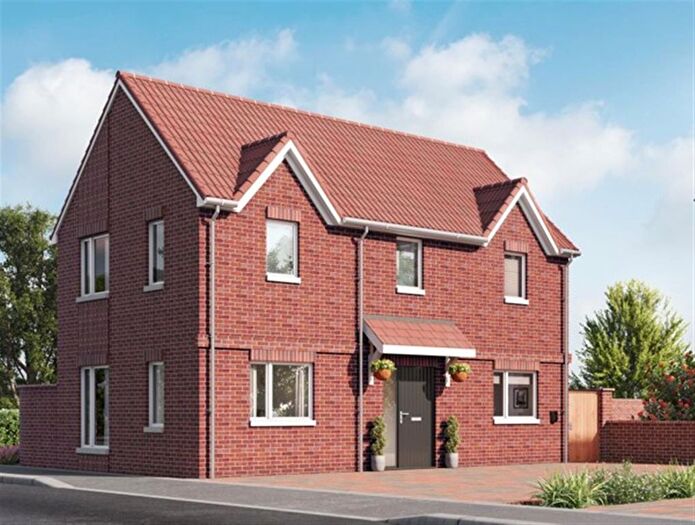
Houses for sale & to rent in Highbridge And Burnham Marine, Highbridge
House Prices in Highbridge And Burnham Marine
Properties in Highbridge And Burnham Marine have an average house price of £206,378.00 and had 232 Property Transactions within the last 3 years¹.
Highbridge And Burnham Marine is an area in Highbridge, Somerset with 2,871 households², where the most expensive property was sold for £585,000.00.
Properties for sale in Highbridge And Burnham Marine
Previously listed properties in Highbridge And Burnham Marine
Roads and Postcodes in Highbridge And Burnham Marine
Navigate through our locations to find the location of your next house in Highbridge And Burnham Marine, Highbridge for sale or to rent.
| Streets | Postcodes |
|---|---|
| Acorn Close | TA9 3LJ |
| Adams Close | TA9 3DX |
| Alstone Gardens | TA9 3DP |
| Alstone Lane | TA9 3DR TA9 3DS |
| Alstone Road | TA9 3DG TA9 3DT |
| Apex Drive | TA9 3ES |
| Armstrong Court | TA9 3FA |
| Artillery Mews | TA9 3FX |
| Avalon Road | TA9 3JW |
| Ballentine Walk | TA9 3FB |
| Bank Street | TA9 3DA |
| Bennett Road | TA9 4PW |
| Bertha Terrace | TA9 3BY |
| Bishops Place | TA9 3EB |
| Blakes Crescent | TA9 3LE |
| Bolton Close | TA9 4JR |
| Brue Way | TA9 4AW |
| Brunels Way | TA9 3LF TA9 3LG |
| Burnham Road | TA9 3EF TA9 3EG TA9 3EH TA9 3EJ TA9 3EQ TA9 3JF TA9 3JG TA9 3JH TA9 3EE |
| Caxton Drive | TA9 3GF TA9 3FS |
| Caxton Road | TA9 3BX TA9 3FT TA9 3FW TA9 3GA |
| Church Street | TA9 3AE TA9 3AF TA9 3AG TA9 3AQ TA9 3HN TA9 3HP TA9 3HR TA9 3HS TA9 3HT TA9 3HU TA9 3HW TA9 3GE |
| Clover Way | TA9 3LL |
| Clyce Road | TA9 3DH TA9 3DJ TA9 3DL |
| Commerce Way | TA9 4AG TA9 4AQ |
| Coronation Road | TA9 3JD TA9 3JE |
| Cuthbert Street | TA9 3AS |
| Daunton Close | TA9 3LS |
| Donstan Road | TA9 3JZ TA9 3LA |
| Dorset Close | TA9 4AU |
| Duckett Way | TA9 3GH |
| Dunbar Close | TA9 3HD |
| East Avenue | TA9 3EU |
| Edison Court | TA9 3FD |
| Elder Close | TA9 3LY |
| Evercreech Way | TA9 4AR |
| Fairdean Road | TA9 3JR |
| Fairford Close | TA9 3JN |
| Fairford Road | TA9 3JJ TA9 3JL |
| Field Way | TA9 3LX |
| Foster Court | TA9 3HL |
| Gass Close | TA9 4JT |
| Grange Avenue | TA9 3AJ TA9 3AL |
| Gulliford Close | TA9 3BA TA9 3BH |
| Havage Close | TA9 3LU |
| Hendon Close | TA9 3LB |
| Highbridge Quay | TA9 3TE TA9 3TF TA9 3TG TA9 3TH TA9 3GQ TA9 3TJ |
| Huish Close | TA9 3HF |
| Huntspill Road | TA9 3DD TA9 3DE TA9 3DF TA9 3DQ TA9 3TQ TA9 3BL |
| Isleport Business Park | TA9 4AL TA9 4JU |
| Isleport Road | TA9 4QX |
| Jasmine Close | TA9 3NA |
| John Street | TA9 3AR |
| Kennedy Close | TA9 3JP |
| Kiln Drive | TA9 3EL |
| Kimber Close | TA9 3QP |
| King Street | TA9 3JB |
| Ladd Close | TA9 3HG |
| Lakeside | TA9 4EX |
| Lakeview Crescent | TA9 4AF |
| Lawrence Close | TA9 4JP |
| Lobelia Close | TA9 3LZ |
| Lockyer Close | TA9 3GP |
| Main Road | TA9 3DN TA9 3DW |
| Mallard Place | TA9 3HE |
| Marconi Drive | TA9 3FE TA9 3FF |
| Maritime Walk | TA9 3FG |
| Market Street | TA9 3BP TA9 3BT TA9 3BW |
| Market Terrace | TA9 3BZ |
| Maxwell Drive | TA9 3FH |
| Mayfield Terrace | TA9 3AT |
| Mayflower Court | TA9 3BQ |
| Meadow Close | TA9 3LP |
| Meadow View | TA9 3DB |
| Millard Court | TA9 3GD |
| Morland Road | TA9 3BB TA9 3BD TA9 3ET TA9 3GG |
| Mulholland Way | TA9 3FJ |
| Newtown Road | TA9 3HX TA9 3HZ |
| North Avenue | TA9 3EP TA9 3ER TA9 3EW |
| Oldway Place | TA9 3LW |
| Orchard Close | TA9 3LN |
| Orchard Court | TA9 3FY |
| Paddock Drive | TA9 3LH TA9 3LQ |
| Parsons Road | TA9 3HA |
| Pearce Drive | TA9 3FU |
| Pepperall Road | TA9 3YA TA9 3YH |
| Poplar Estate | TA9 3AN TA9 3AP TA9 3AW |
| Poples Bow | TA9 3LR TA9 4EY |
| Quaker Close | TA9 3GN |
| Queens Square | TA9 3EZ |
| Sandacre Caravan Site | TA9 3JQ |
| Sandy Close | TA9 3EN |
| Scott Road | TA9 3QJ |
| Siger Drive | TA9 4BA |
| Smith Way | TA9 3QW |
| Somerset Way | TA9 4AT |
| South Avenue | TA9 3EX TA9 3EY |
| Southend Gardens | TA9 3LD |
| Southwell Crescent | TA9 3BN TA9 3BJ |
| Sparks Way | TA9 3QL |
| Springfield Road | TA9 3AH TA9 3FR |
| Station Walk | TA9 3HQ |
| Stiling Close | TA9 3LT |
| Stockley Road | TA9 3FL |
| Susini Drive | TA9 3FN |
| Talbot Close | TA9 3AX |
| Tanning Drive | TA9 3GL |
| Tesla Place | TA9 3FP |
| Three Yards Court | TA9 3EA |
| Tregelles Close | TA9 3AY |
| Trowbridge Close | TA9 3AZ |
| Tyler Way | TA9 3FZ |
| Tylers End | TA9 4JS |
| Victoria Place | TA9 3AU |
| Wall Court | TA9 3GJ |
| Walrow Road | TA9 4AB TA9 4AD TA9 4QZ TA9 4QY |
| Walrow Terrace | TA9 4AA |
| West Avenue | TA9 3HB |
| Willet Close | TA9 3QR |
| Woodberry Court | TA9 3GB |
| Worston Orchard | TA9 3JT |
| Worston Road | TA9 3JS TA9 3JU TA9 3JX |
Transport near Highbridge And Burnham Marine
-
Highbridge and Burnham Station
-
Bridgwater Station
-
Weston-Super-Mare Station
-
Weston Milton Station
-
Worle Station
- FAQ
- Price Paid By Year
- Property Type Price
Frequently asked questions about Highbridge And Burnham Marine
What is the average price for a property for sale in Highbridge And Burnham Marine?
The average price for a property for sale in Highbridge And Burnham Marine is £206,378. This amount is 31% lower than the average price in Highbridge. There are 245 property listings for sale in Highbridge And Burnham Marine.
What streets have the most expensive properties for sale in Highbridge And Burnham Marine?
The streets with the most expensive properties for sale in Highbridge And Burnham Marine are Donstan Road at an average of £460,000, Alstone Lane at an average of £413,500 and Lakeview Crescent at an average of £310,000.
What streets have the most affordable properties for sale in Highbridge And Burnham Marine?
The streets with the most affordable properties for sale in Highbridge And Burnham Marine are Market Street at an average of £68,125, Foster Court at an average of £74,375 and Bishops Place at an average of £74,666.
Which train stations are available in or near Highbridge And Burnham Marine?
Some of the train stations available in or near Highbridge And Burnham Marine are Highbridge and Burnham, Bridgwater and Weston-Super-Mare.
Property Price Paid in Highbridge And Burnham Marine by Year
The average sold property price by year was:
| Year | Average Sold Price | Price Change |
Sold Properties
|
|---|---|---|---|
| 2025 | £192,028 | -14% |
75 Properties |
| 2024 | £218,417 | 5% |
79 Properties |
| 2023 | £207,982 | -3% |
78 Properties |
| 2022 | £215,079 | 10% |
101 Properties |
| 2021 | £193,845 | 8% |
133 Properties |
| 2020 | £178,062 | -7% |
87 Properties |
| 2019 | £189,655 | 12% |
102 Properties |
| 2018 | £166,107 | - |
92 Properties |
| 2017 | £166,064 | 5% |
97 Properties |
| 2016 | £157,802 | 4% |
117 Properties |
| 2015 | £151,255 | 10% |
89 Properties |
| 2014 | £136,570 | -7% |
95 Properties |
| 2013 | £145,980 | 7% |
125 Properties |
| 2012 | £135,237 | -4% |
92 Properties |
| 2011 | £140,659 | 6% |
97 Properties |
| 2010 | £132,350 | -1% |
85 Properties |
| 2009 | £133,330 | -22% |
80 Properties |
| 2008 | £162,914 | 7% |
101 Properties |
| 2007 | £151,414 | 3% |
191 Properties |
| 2006 | £146,530 | 3% |
224 Properties |
| 2005 | £142,617 | 6% |
117 Properties |
| 2004 | £134,299 | 19% |
131 Properties |
| 2003 | £109,002 | 12% |
117 Properties |
| 2002 | £95,830 | 23% |
119 Properties |
| 2001 | £74,083 | 9% |
179 Properties |
| 2000 | £67,407 | 13% |
92 Properties |
| 1999 | £58,678 | 13% |
122 Properties |
| 1998 | £51,148 | 5% |
99 Properties |
| 1997 | £48,610 | 13% |
86 Properties |
| 1996 | £42,514 | -1% |
80 Properties |
| 1995 | £43,008 | - |
95 Properties |
Property Price per Property Type in Highbridge And Burnham Marine
Here you can find historic sold price data in order to help with your property search.
The average Property Paid Price for specific property types in the last three years are:
| Property Type | Average Sold Price | Sold Properties |
|---|---|---|
| Flat | £107,925.00 | 63 Flats |
| Semi Detached House | £251,944.00 | 65 Semi Detached Houses |
| Detached House | £315,806.00 | 29 Detached Houses |
| Terraced House | £207,275.00 | 75 Terraced Houses |

