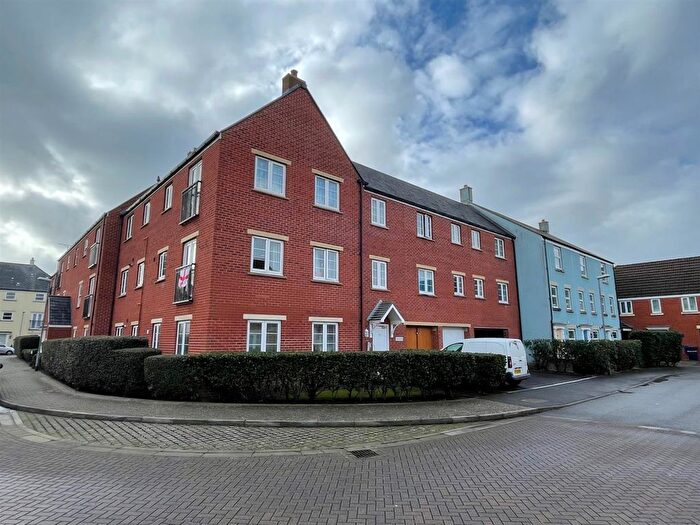
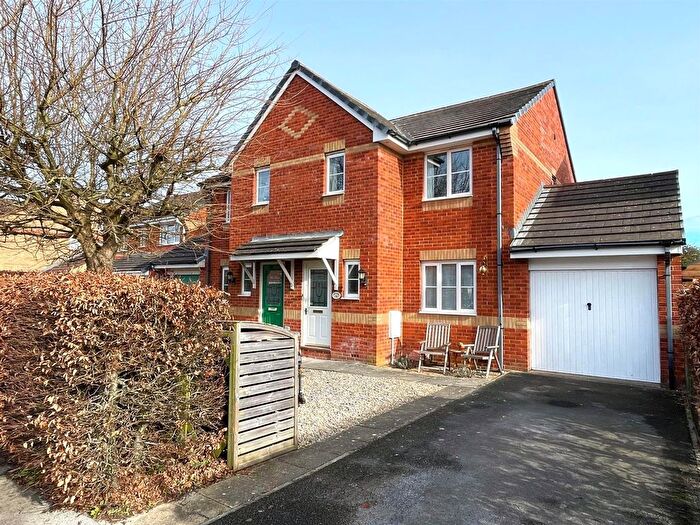
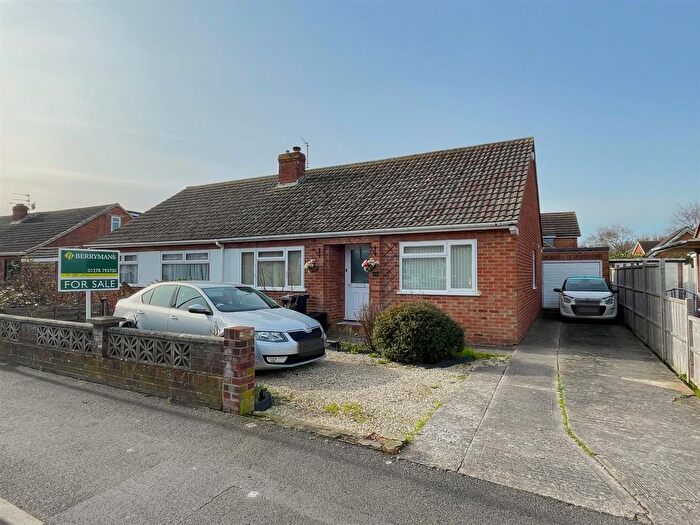
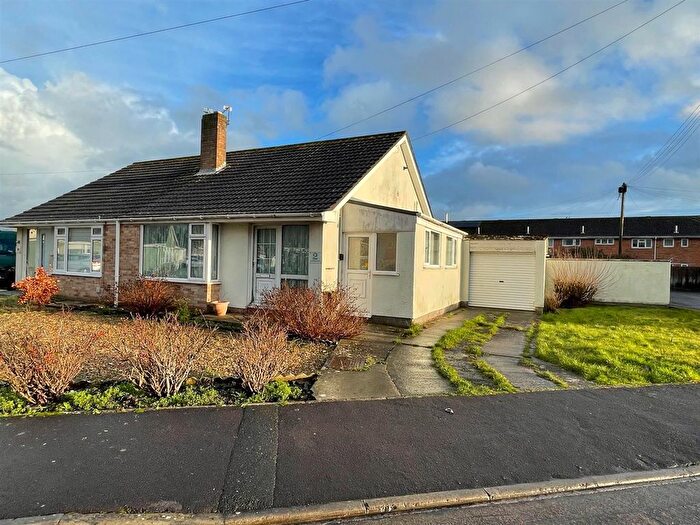
Houses for sale & to rent in Highbridge And Burnham Marine, Burnham-on-sea
House Prices in Highbridge And Burnham Marine
Properties in Highbridge And Burnham Marine have an average house price of £280,541.00 and had 64 Property Transactions within the last 3 years¹.
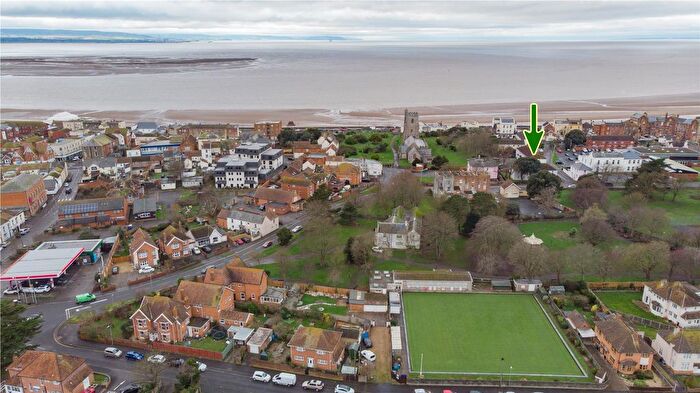
Highbridge And Burnham Marine is an area in Burnham-on-sea, Somerset with 559 households², where the most expensive property was sold for £450,000.00.
Properties for sale in Highbridge And Burnham Marine
Previously listed properties in Highbridge And Burnham Marine
Roads and Postcodes in Highbridge And Burnham Marine
Navigate through our locations to find the location of your next house in Highbridge And Burnham Marine, Burnham-on-sea for sale or to rent.
| Streets | Postcodes |
|---|---|
| Atlantic Crescent | TA8 1NF |
| Bay View Gardens | TA8 1LD |
| Beale Way | TA8 1JS |
| Broadhurst Gardens | TA8 1LP |
| Brue Crescent | TA8 1LR |
| Burnham Road | TA8 1LS TA8 1LT |
| Cassis Close | TA8 1NN |
| Channel Court | TA8 1NE |
| Channing Close | TA8 1RJ |
| Churchill Close | TA8 1NA |
| Hamley Close | TA8 1DS |
| Hatcher Close | TA8 1JR |
| Heal Close | TA8 1JG |
| Highbridge Road | TA8 1LN TA8 1LW |
| Highburn Close | TA8 1LU |
| Holm Close | TA8 1NJ |
| Hooper Close | TA8 1JQ |
| Lawrence Close | TA8 1JT |
| Lundy Drive | TA8 1NG |
| Marine Drive | TA8 1NQ TA8 1QJ TA8 1LA TA8 1NL |
| Severn Grove | TA8 1NH |
| Stone Road | TA8 1JU |
| Thorne Park | TA8 1QH |
| Wallace Wells Road | TA8 1JP |
Transport near Highbridge And Burnham Marine
-
Highbridge and Burnham Station
-
Bridgwater Station
-
Weston-Super-Mare Station
-
Weston Milton Station
-
Worle Station
- FAQ
- Price Paid By Year
- Property Type Price
Frequently asked questions about Highbridge And Burnham Marine
What is the average price for a property for sale in Highbridge And Burnham Marine?
The average price for a property for sale in Highbridge And Burnham Marine is £280,541. This amount is 0.33% lower than the average price in Burnham-on-sea. There are 309 property listings for sale in Highbridge And Burnham Marine.
What streets have the most expensive properties for sale in Highbridge And Burnham Marine?
The streets with the most expensive properties for sale in Highbridge And Burnham Marine are Wallace Wells Road at an average of £406,333, Holm Close at an average of £405,000 and Severn Grove at an average of £398,000.
What streets have the most affordable properties for sale in Highbridge And Burnham Marine?
The streets with the most affordable properties for sale in Highbridge And Burnham Marine are Marine Drive at an average of £200,700, Stone Road at an average of £226,714 and Heal Close at an average of £231,290.
Which train stations are available in or near Highbridge And Burnham Marine?
Some of the train stations available in or near Highbridge And Burnham Marine are Highbridge and Burnham, Bridgwater and Weston-Super-Mare.
Property Price Paid in Highbridge And Burnham Marine by Year
The average sold property price by year was:
| Year | Average Sold Price | Price Change |
Sold Properties
|
|---|---|---|---|
| 2025 | £282,163 | -2% |
18 Properties |
| 2024 | £287,046 | 6% |
28 Properties |
| 2023 | £268,800 | -0,1% |
18 Properties |
| 2022 | £269,157 | 3% |
23 Properties |
| 2021 | £259,867 | 7% |
28 Properties |
| 2020 | £241,214 | 4% |
28 Properties |
| 2019 | £232,309 | 1% |
16 Properties |
| 2018 | £228,875 | 4% |
29 Properties |
| 2017 | £218,725 | 11% |
27 Properties |
| 2016 | £195,050 | 5% |
25 Properties |
| 2015 | £185,691 | 2% |
41 Properties |
| 2014 | £181,750 | 10% |
68 Properties |
| 2013 | £164,426 | -4% |
24 Properties |
| 2012 | £170,400 | 9% |
15 Properties |
| 2011 | £154,557 | -5% |
33 Properties |
| 2010 | £161,863 | 11% |
11 Properties |
| 2009 | £144,768 | -27% |
27 Properties |
| 2008 | £184,100 | 2% |
14 Properties |
| 2007 | £180,824 | 1% |
38 Properties |
| 2006 | £178,198 | 14% |
42 Properties |
| 2005 | £153,067 | -10% |
31 Properties |
| 2004 | £168,940 | 22% |
31 Properties |
| 2003 | £131,093 | 17% |
32 Properties |
| 2002 | £109,120 | 21% |
44 Properties |
| 2001 | £86,636 | -2% |
55 Properties |
| 2000 | £88,257 | 22% |
47 Properties |
| 1999 | £68,943 | 12% |
56 Properties |
| 1998 | £60,523 | 5% |
31 Properties |
| 1997 | £57,261 | -8% |
46 Properties |
| 1996 | £61,958 | 17% |
54 Properties |
| 1995 | £51,493 | - |
46 Properties |
Property Price per Property Type in Highbridge And Burnham Marine
Here you can find historic sold price data in order to help with your property search.
The average Property Paid Price for specific property types in the last three years are:
| Property Type | Average Sold Price | Sold Properties |
|---|---|---|
| Semi Detached House | £243,669.00 | 23 Semi Detached Houses |
| Terraced House | £209,222.00 | 11 Terraced Houses |
| Detached House | £334,960.00 | 30 Detached Houses |

