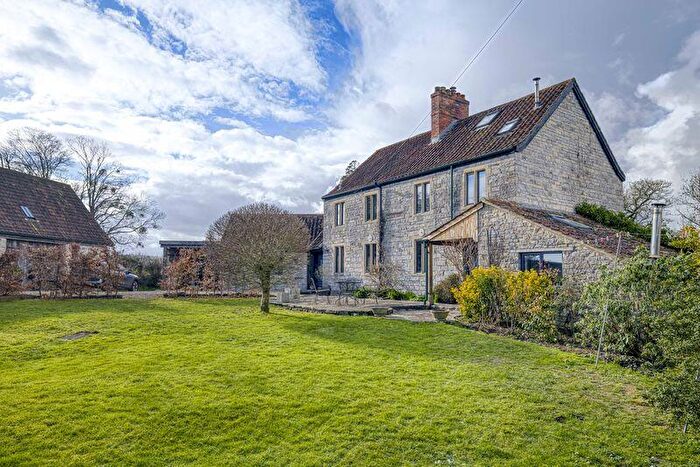
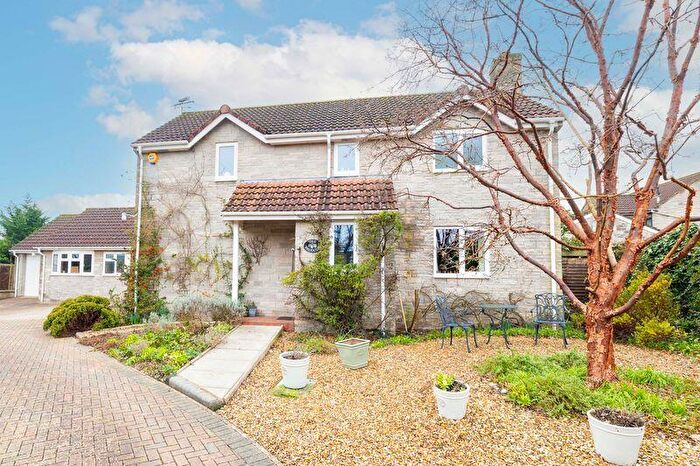
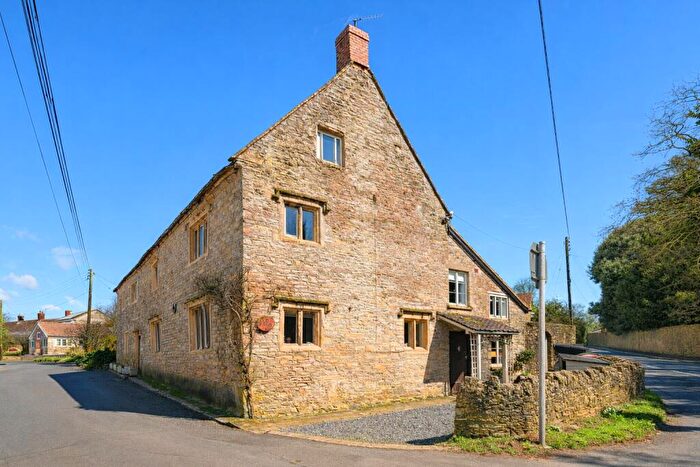
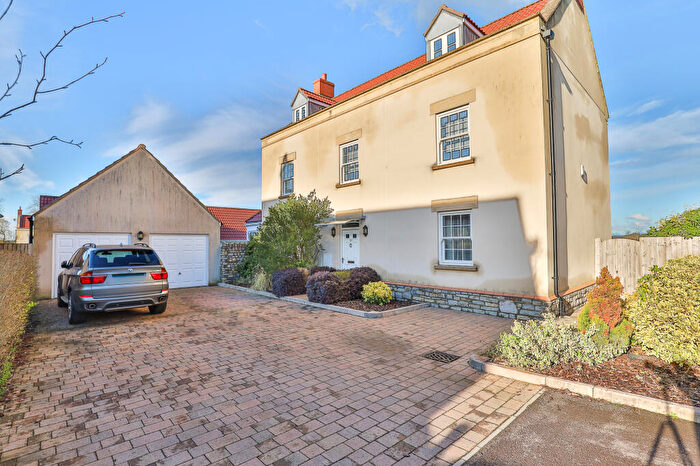
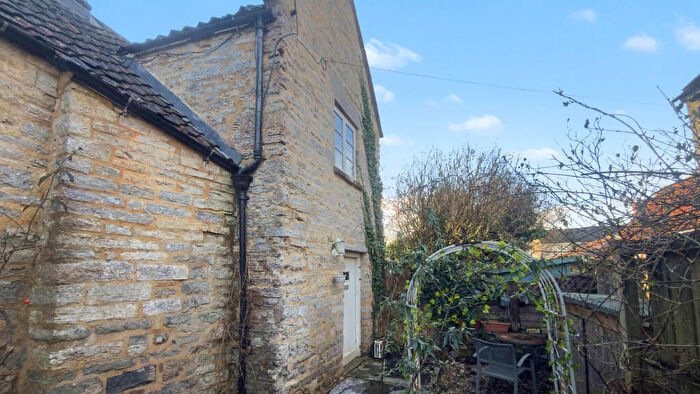
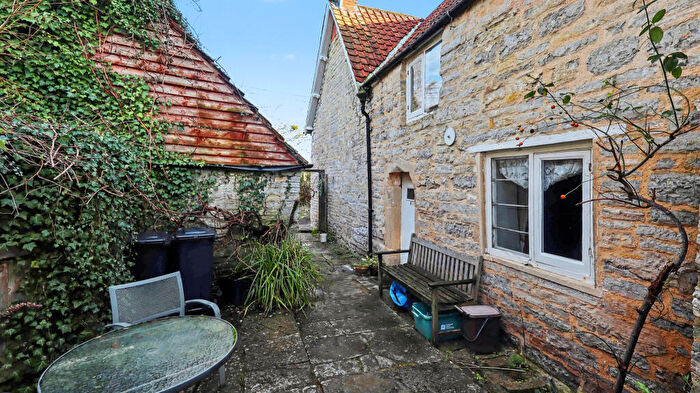
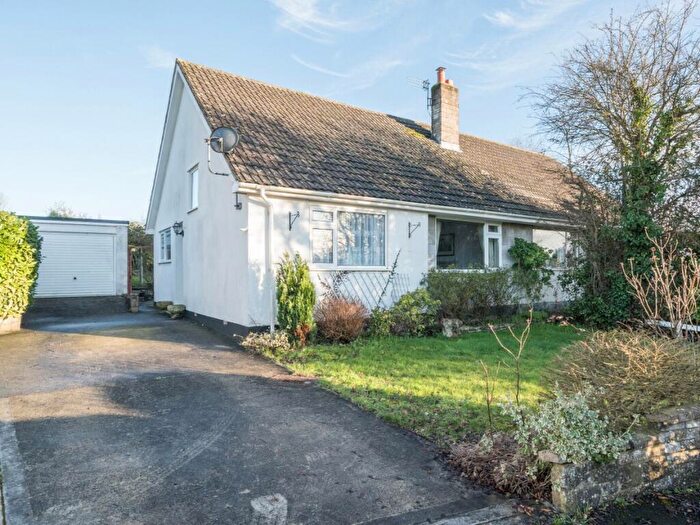
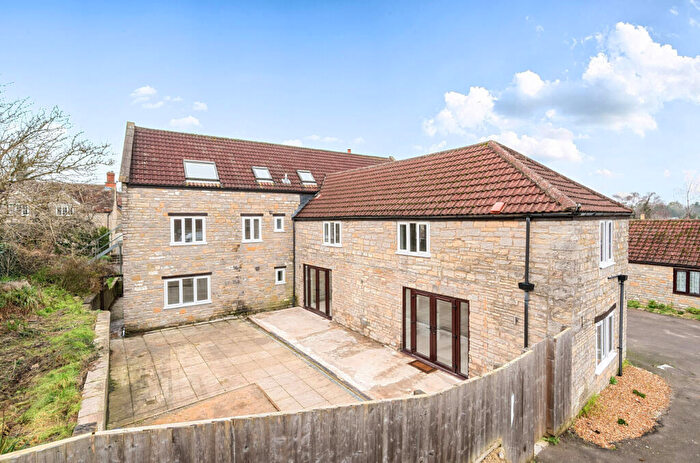
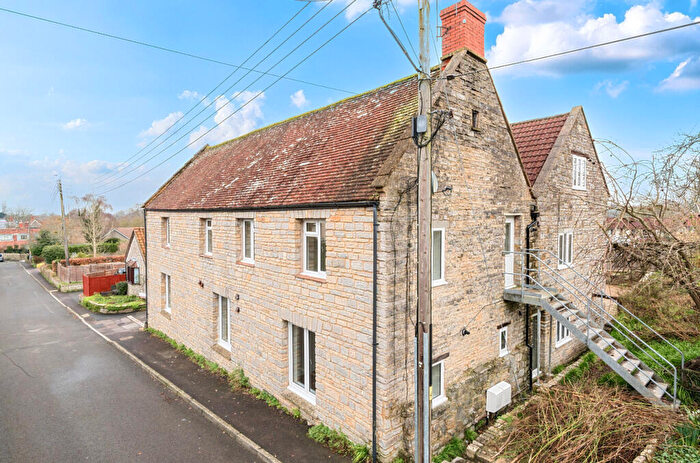
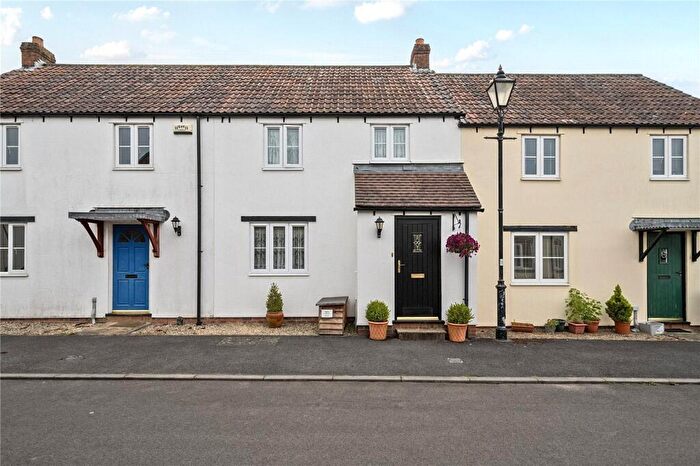
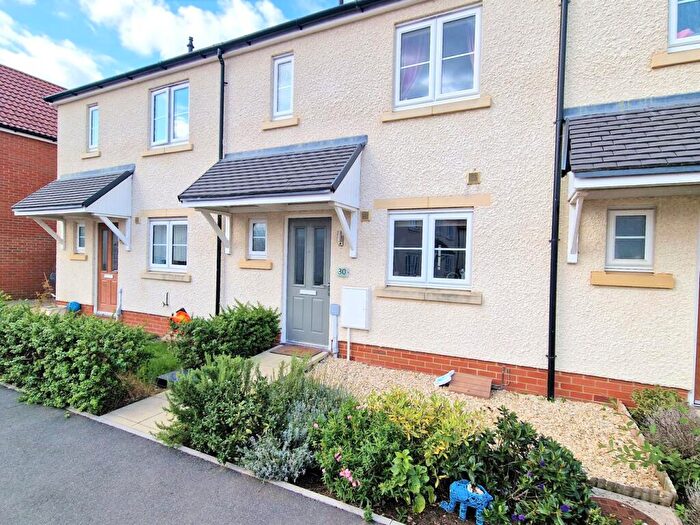
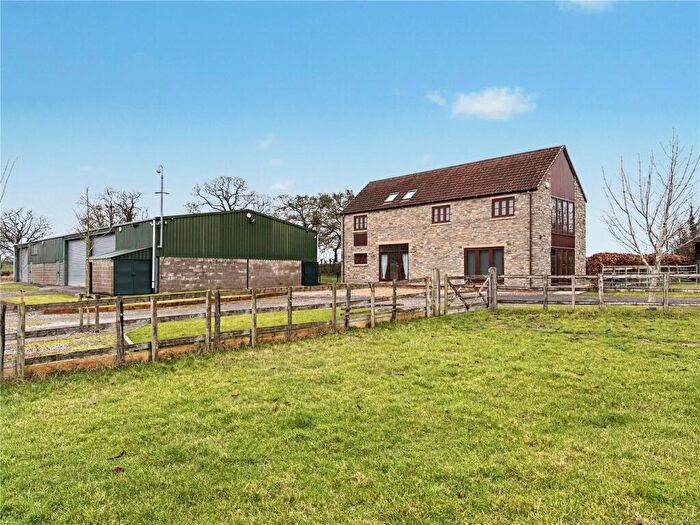
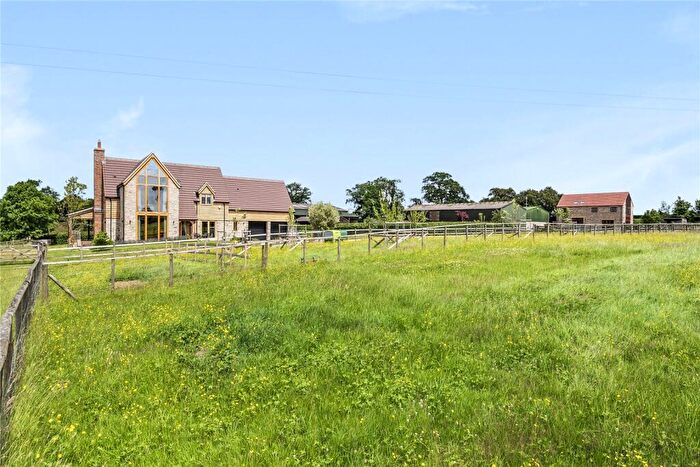
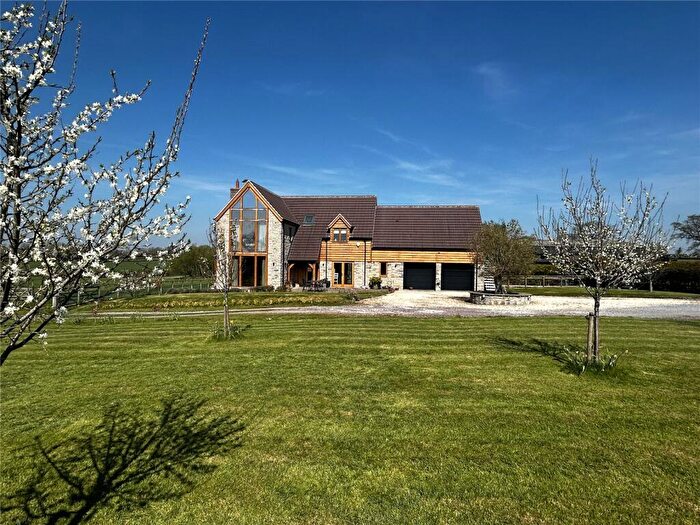
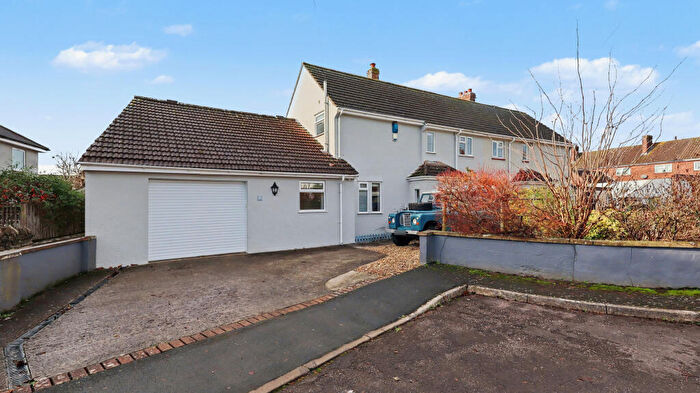
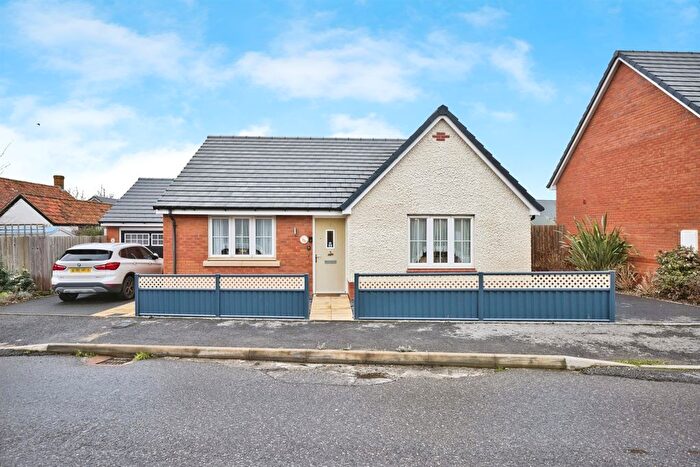
Houses for sale & to rent in Butleigh And Baltonsborough, Glastonbury
House Prices in Butleigh And Baltonsborough
Properties in Butleigh And Baltonsborough have an average house price of £471,384.00 and had 76 Property Transactions within the last 3 years¹.
Butleigh And Baltonsborough is an area in Glastonbury, Somerset with 724 households², where the most expensive property was sold for £1,380,000.00.
Properties for sale in Butleigh And Baltonsborough
Roads and Postcodes in Butleigh And Baltonsborough
Navigate through our locations to find the location of your next house in Butleigh And Baltonsborough, Glastonbury for sale or to rent.
| Streets | Postcodes |
|---|---|
| Adams Orchard | BA6 8FJ |
| Admirals Mead | BA6 8UE |
| Apple Meadow | BA6 8FQ |
| Archbishop Close | BA6 8NZ |
| Back Lane | BA6 8QB |
| Back Town | BA6 8RU |
| Baltonsborough Road | BA6 8SN |
| Banbury Lane | BA6 8TN |
| Barton Road | BA6 8TH BA6 8TL |
| Burgess Lane | BA6 8RE BA6 8RF |
| Burnetts Lane | BA6 8RD |
| Butleigh Hill | BA6 8TW |
| Butleigh Moor | BA6 8TT |
| Chapel Lane | BA6 8SS BA6 8TA BA6 8TB |
| Chestnut Close | BA6 8PH |
| Church Close | BA6 8SH BA6 8SJ |
| Church Lane | BA6 8RP |
| Church Walk | BA6 8RL |
| Compton Street | BA6 8SE BA6 8SF |
| Coxbridge Road | BA6 8RA |
| Coxs Drive | BA6 8RG |
| Cross Roads | BA6 8QN |
| Dunford Terrace | BA6 8QL |
| Farrant Close | BA6 8RN |
| Gilberts Corner | BA6 8RB |
| Grenville Close | BA6 8SL |
| Ham Street | BA6 8PN BA6 8PR BA6 8PS BA6 8PU BA6 8PW BA6 8PX BA6 8QG |
| Harepits Lane | BA6 8FR |
| Hayward Drive | BA6 8PJ |
| Henley Lane | BA6 8TJ BA6 8UA |
| High Street | BA6 8SU BA6 8SX BA6 8SY BA6 8SZ |
| Holm Oaks | BA6 8UB |
| Holmans | BA6 8UD |
| Kingweston Road | BA6 8TF BA6 8FL |
| Looks Lane | BA6 8TZ |
| Lottisham Green | BA6 8PP |
| Lubborn Lane | BA6 8QP BA6 8QR |
| Mansfield Way | BA6 8FN |
| Martin Street | BA6 8QS BA6 8QU BA6 8QY BA6 8QT BA6 8QX BA6 8QZ |
| Mill Leat | BA6 8HX |
| Mill Street | BA6 8RJ |
| Moorhouse | BA6 8TS |
| Mounsdon Close | BA6 8RX |
| Muchelney Road | BA6 8QD |
| Neville Close | BA6 8PT |
| Neville Park | BA6 8PY |
| Orchard View | BA6 8QH |
| Parkfields Orchard | BA6 8UH |
| Quarry Lane | BA6 8TE |
| St Annes Close | BA6 8RQ |
| St Dunstans Park | BA6 8PZ |
| St James Square | BA6 8SD |
| Sub Road | BA6 8SG BA6 8SQ BA6 8SR BA6 8TQ |
| Teapot Lane | BA6 8QE BA6 8QF |
| The Cross | BA6 8QW |
| Tuckers Lane | BA6 8RH |
| Water Lane | BA6 8SP |
| West Park | BA6 8SW |
| Wickham Cross | BA6 8TP |
| Wood Lane | BA6 8TG BA6 8TR |
| Wootton Hill | BA6 8TU |
| BA6 8PG BA6 8PQ BA6 8QA BA6 8QJ BA6 8QQ BA6 8SA BA6 8SB BA6 8ST BA6 8TX BA6 8TY BA6 8LU BA6 8PE BA6 8RS BA6 8TD |
Transport near Butleigh And Baltonsborough
-
Castle Cary Station
-
Bruton Station
-
Yeovil Pen Mill Station
-
Yeovil Junction Station
-
Templecombe Station
-
Sherborne Station
-
Thornford Station
-
Bridgwater Station
- FAQ
- Price Paid By Year
- Property Type Price
Frequently asked questions about Butleigh And Baltonsborough
What is the average price for a property for sale in Butleigh And Baltonsborough?
The average price for a property for sale in Butleigh And Baltonsborough is £471,384. This amount is 40% higher than the average price in Glastonbury. There are 532 property listings for sale in Butleigh And Baltonsborough.
What streets have the most expensive properties for sale in Butleigh And Baltonsborough?
The streets with the most expensive properties for sale in Butleigh And Baltonsborough are Kingweston Road at an average of £950,000, Compton Street at an average of £801,250 and Water Lane at an average of £795,000.
What streets have the most affordable properties for sale in Butleigh And Baltonsborough?
The streets with the most affordable properties for sale in Butleigh And Baltonsborough are Butleigh Moor at an average of £150,000, Parkfields Orchard at an average of £182,500 and The Cross at an average of £228,500.
Which train stations are available in or near Butleigh And Baltonsborough?
Some of the train stations available in or near Butleigh And Baltonsborough are Castle Cary, Bruton and Yeovil Pen Mill.
Property Price Paid in Butleigh And Baltonsborough by Year
The average sold property price by year was:
| Year | Average Sold Price | Price Change |
Sold Properties
|
|---|---|---|---|
| 2025 | £454,263 | 9% |
19 Properties |
| 2024 | £414,689 | -31% |
29 Properties |
| 2023 | £541,721 | -1% |
28 Properties |
| 2022 | £549,119 | -10% |
21 Properties |
| 2021 | £603,014 | 30% |
34 Properties |
| 2020 | £424,275 | -17% |
29 Properties |
| 2019 | £495,612 | 10% |
31 Properties |
| 2018 | £446,551 | 8% |
29 Properties |
| 2017 | £411,907 | 3% |
38 Properties |
| 2016 | £400,304 | 11% |
53 Properties |
| 2015 | £355,955 | -1% |
34 Properties |
| 2014 | £359,591 | 1% |
39 Properties |
| 2013 | £355,996 | 17% |
25 Properties |
| 2012 | £294,068 | -21% |
20 Properties |
| 2011 | £354,687 | -2% |
16 Properties |
| 2010 | £361,268 | 10% |
24 Properties |
| 2009 | £325,492 | 4% |
20 Properties |
| 2008 | £312,844 | -5% |
18 Properties |
| 2007 | £327,476 | -2% |
26 Properties |
| 2006 | £334,241 | 24% |
30 Properties |
| 2005 | £253,925 | 5% |
22 Properties |
| 2004 | £241,279 | 2% |
32 Properties |
| 2003 | £237,145 | 11% |
30 Properties |
| 2002 | £210,452 | 16% |
55 Properties |
| 2001 | £177,659 | -18% |
36 Properties |
| 2000 | £209,425 | 41% |
32 Properties |
| 1999 | £123,750 | 6% |
41 Properties |
| 1998 | £115,787 | 16% |
39 Properties |
| 1997 | £97,764 | -42% |
41 Properties |
| 1996 | £138,825 | 36% |
30 Properties |
| 1995 | £88,519 | - |
20 Properties |
Property Price per Property Type in Butleigh And Baltonsborough
Here you can find historic sold price data in order to help with your property search.
The average Property Paid Price for specific property types in the last three years are:
| Property Type | Average Sold Price | Sold Properties |
|---|---|---|
| Semi Detached House | £353,650.00 | 15 Semi Detached Houses |
| Detached House | £579,056.00 | 43 Detached Houses |
| Terraced House | £312,277.00 | 18 Terraced Houses |

