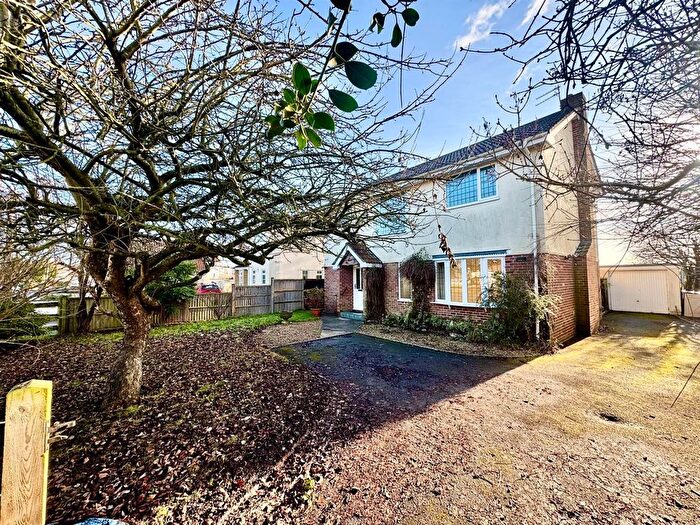
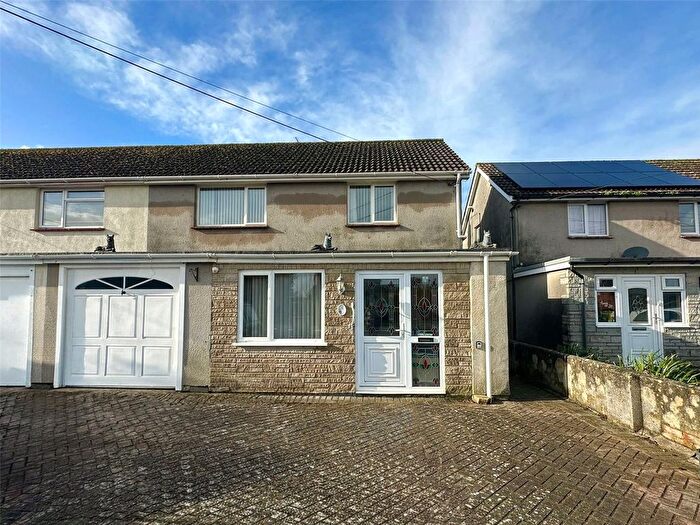
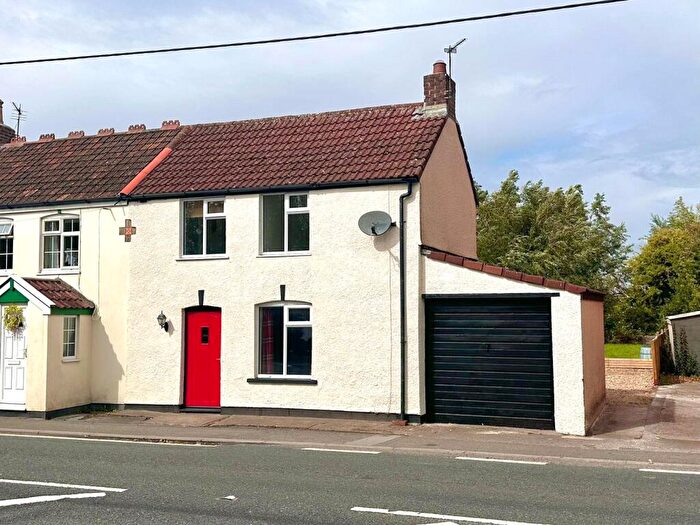
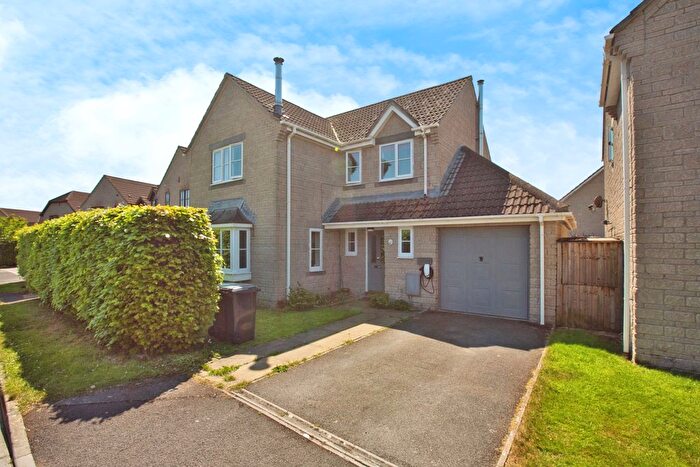
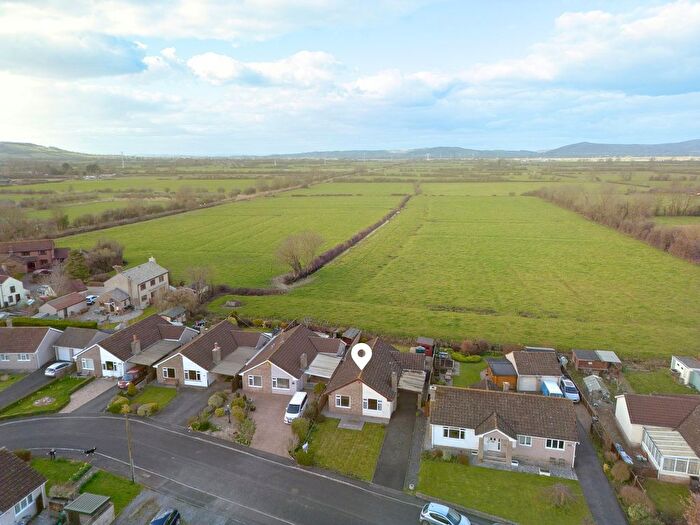
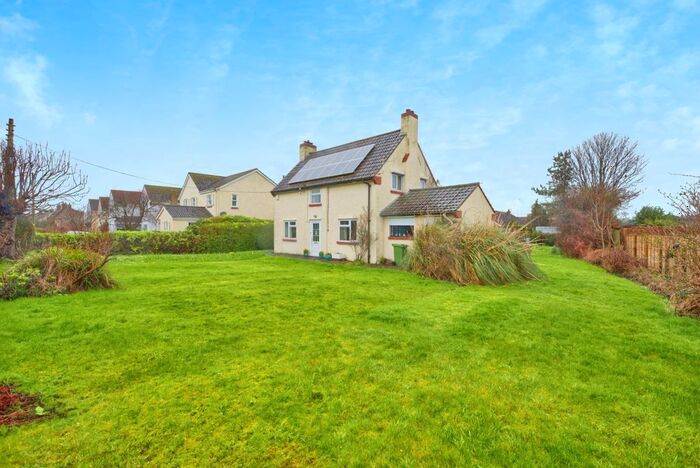
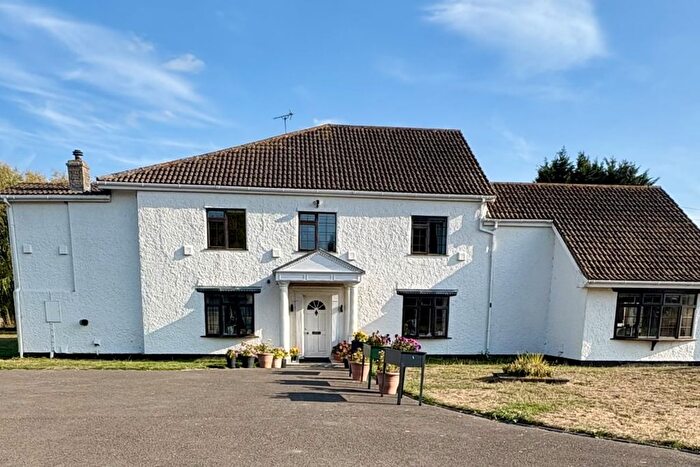
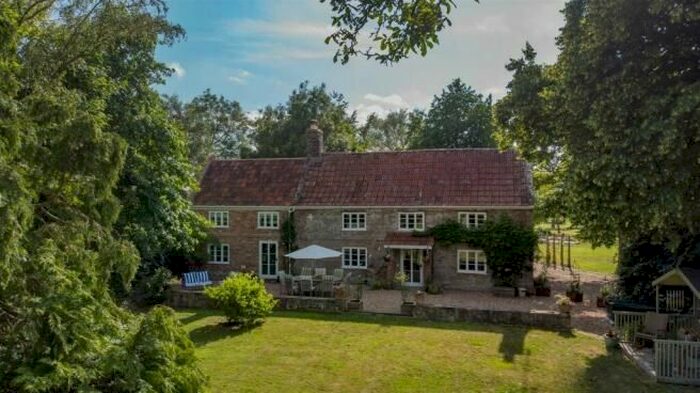
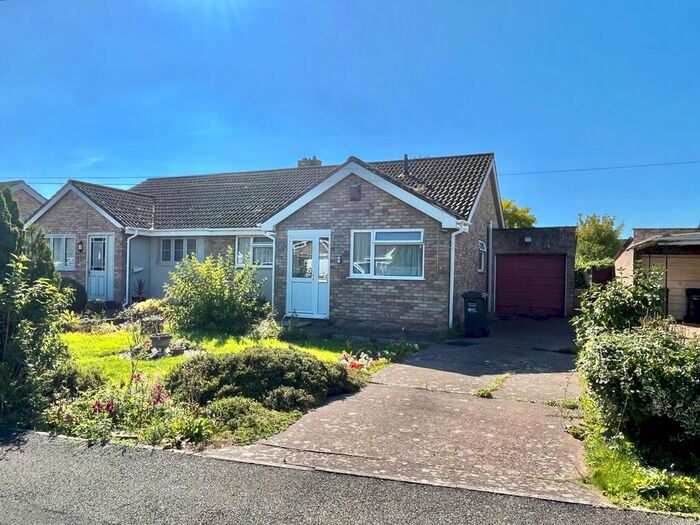
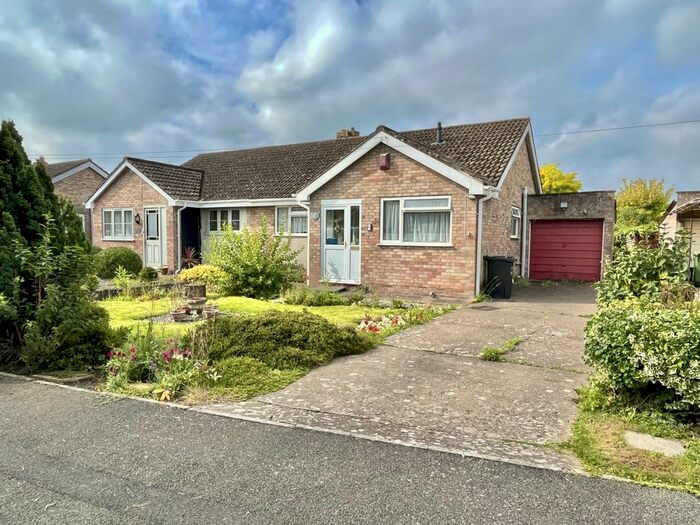
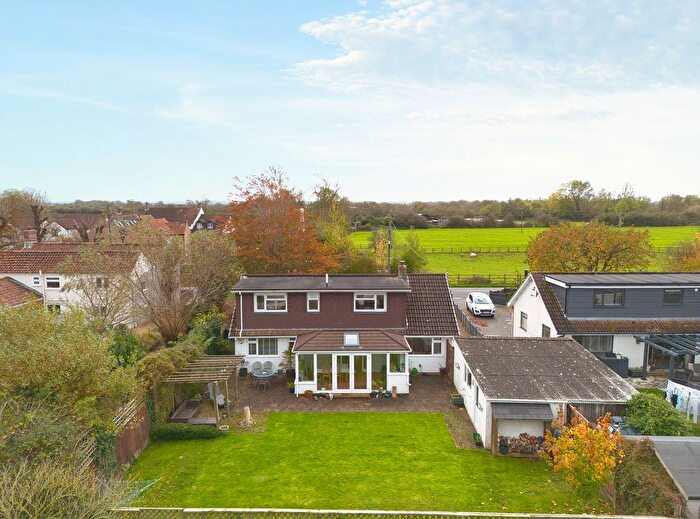
Houses for sale & to rent in Wedmore And Mark, Highbridge
House Prices in Wedmore And Mark
Properties in Wedmore And Mark have an average house price of £505,054.00 and had 34 Property Transactions within the last 3 years¹.
Wedmore And Mark is an area in Highbridge, Somerset with 543 households², where the most expensive property was sold for £1,275,000.00.
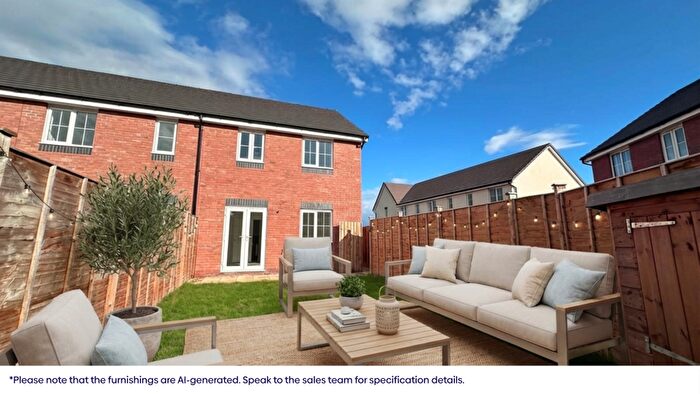
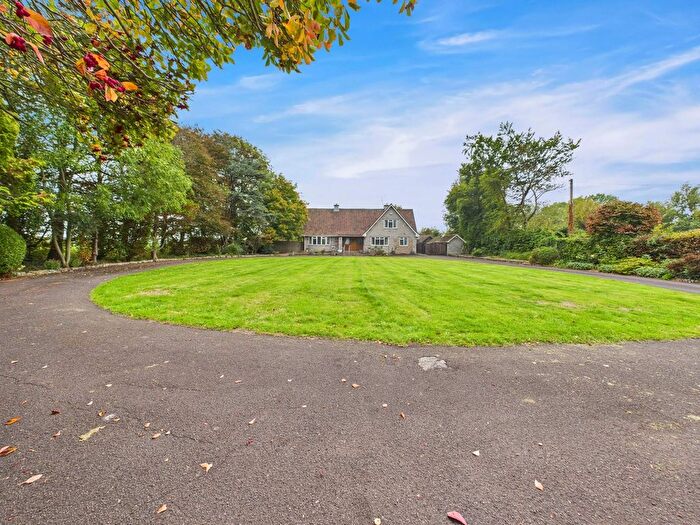
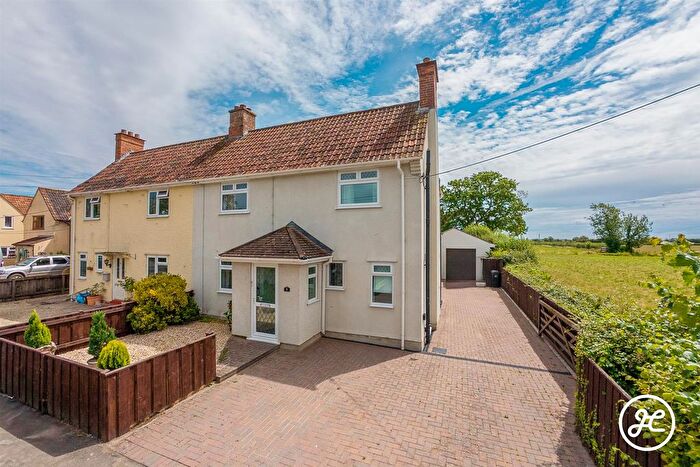
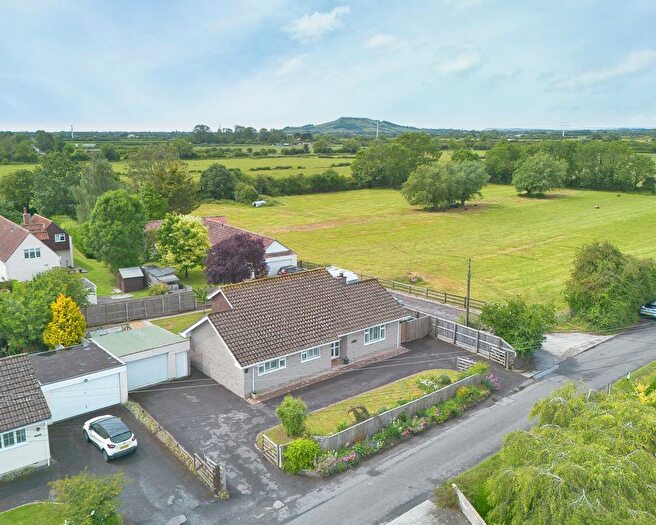
Properties for sale in Wedmore And Mark
Previously listed properties in Wedmore And Mark
Roads and Postcodes in Wedmore And Mark
Navigate through our locations to find the location of your next house in Wedmore And Mark, Highbridge for sale or to rent.
| Streets | Postcodes |
|---|---|
| Blackford Road | TA9 4NP TA9 4NR |
| Church Street | TA9 4LY TA9 4NA TA9 4NE TA9 4NF TA9 4NW |
| Churchlands | TA9 4ND |
| Council Houses | TA9 4QG |
| Dutch Road | TA9 4QP TA9 4QR |
| Fishers Lane | TA9 4LZ |
| Grange Paddock | TA9 4RW |
| Green Drove | TA9 4AX TA9 4DH |
| Harp Road | TA9 4QL TA9 4QN TA9 4QW |
| Kingsway | TA9 4NT TA9 4NU |
| Littlemoor | TA9 4NL |
| Littlemoor Road | TA9 4NG TA9 4NJ TA9 4NQ |
| Mark Moor | TA7 8NP |
| Merryfield | TA9 4NB |
| Northwick | TA9 4PQ |
| Northwick Road | TA9 4NX TA9 4PG |
| Perry Lane | TA9 4NS |
| Perry Road | TA9 4AY TA9 4BF |
| Pill Road | TA9 4PB |
| Poplar Lane | TA9 4QU |
| Queensway Close | TA9 4PH |
| Southwick | TA9 4LG TA9 4LH TA9 4LJ TA9 4LQ |
| The Causeway | TA9 4LF TA9 4PT TA9 4PX TA9 4PY TA9 4PZ TA9 4QA TA9 4QD TA9 4QF TA9 4QH TA9 4QJ TA9 4QQ TA9 4QS TA9 4QT |
| The Croft | TA9 4QB |
| The Uplands | TA9 4NH |
| The Wall | TA9 4LX |
| Tuckers Close | TA9 4AZ |
| Vicarage Lane | TA9 4NN |
| Vole Road | TA9 4NY TA9 4PA TA9 4PD TA9 4NZ |
| West Close | TA9 4PU |
| Yardwall Road | TA9 4QE |
| Yarrow | TA9 4LN |
| Yarrow Road | TA9 4LP TA9 4LR TA9 4LW TA9 4LS |
| TA9 4LE TA9 4LT TA7 8NS |
Transport near Wedmore And Mark
-
Highbridge and Burnham Station
-
Bridgwater Station
-
Weston Milton Station
-
Weston-Super-Mare Station
-
Worle Station
- FAQ
- Price Paid By Year
- Property Type Price
Frequently asked questions about Wedmore And Mark
What is the average price for a property for sale in Wedmore And Mark?
The average price for a property for sale in Wedmore And Mark is £505,054. This amount is 70% higher than the average price in Highbridge. There are 80 property listings for sale in Wedmore And Mark.
What streets have the most expensive properties for sale in Wedmore And Mark?
The streets with the most expensive properties for sale in Wedmore And Mark are Vicarage Lane at an average of £1,275,000, Harp Road at an average of £995,000 and Yarrow Road at an average of £708,333.
What streets have the most affordable properties for sale in Wedmore And Mark?
The streets with the most affordable properties for sale in Wedmore And Mark are The Wall at an average of £195,000, The Croft at an average of £259,475 and Council Houses at an average of £320,000.
Which train stations are available in or near Wedmore And Mark?
Some of the train stations available in or near Wedmore And Mark are Highbridge and Burnham, Bridgwater and Weston Milton.
Property Price Paid in Wedmore And Mark by Year
The average sold property price by year was:
| Year | Average Sold Price | Price Change |
Sold Properties
|
|---|---|---|---|
| 2025 | £569,166 | 17% |
9 Properties |
| 2024 | £474,138 | -5% |
17 Properties |
| 2023 | £498,625 | 2% |
8 Properties |
| 2022 | £490,350 | 24% |
20 Properties |
| 2021 | £374,722 | -12% |
24 Properties |
| 2020 | £419,233 | 14% |
15 Properties |
| 2019 | £361,055 | 13% |
18 Properties |
| 2018 | £314,313 | -7% |
19 Properties |
| 2017 | £335,214 | -6% |
14 Properties |
| 2016 | £356,267 | -7% |
26 Properties |
| 2015 | £380,384 | 21% |
22 Properties |
| 2014 | £302,052 | -1% |
19 Properties |
| 2013 | £303,966 | -2% |
15 Properties |
| 2012 | £309,617 | 26% |
17 Properties |
| 2011 | £230,431 | -27% |
8 Properties |
| 2010 | £292,310 | 15% |
14 Properties |
| 2009 | £248,076 | -30% |
13 Properties |
| 2008 | £321,832 | 1% |
12 Properties |
| 2007 | £318,969 | -12% |
33 Properties |
| 2006 | £356,479 | 23% |
24 Properties |
| 2005 | £272,980 | -2% |
19 Properties |
| 2004 | £278,942 | 27% |
19 Properties |
| 2003 | £204,984 | -5% |
26 Properties |
| 2002 | £215,895 | 30% |
24 Properties |
| 2001 | £150,916 | 1% |
30 Properties |
| 2000 | £148,973 | 14% |
23 Properties |
| 1999 | £127,737 | 8% |
29 Properties |
| 1998 | £117,803 | 10% |
42 Properties |
| 1997 | £106,050 | 18% |
42 Properties |
| 1996 | £87,165 | 12% |
30 Properties |
| 1995 | £77,012 | - |
16 Properties |
Property Price per Property Type in Wedmore And Mark
Here you can find historic sold price data in order to help with your property search.
The average Property Paid Price for specific property types in the last three years are:
| Property Type | Average Sold Price | Sold Properties |
|---|---|---|
| Semi Detached House | £395,000.00 | 5 Semi Detached Houses |
| Detached House | £557,034.00 | 26 Detached Houses |
| Terraced House | £237,983.00 | 3 Terraced Houses |

