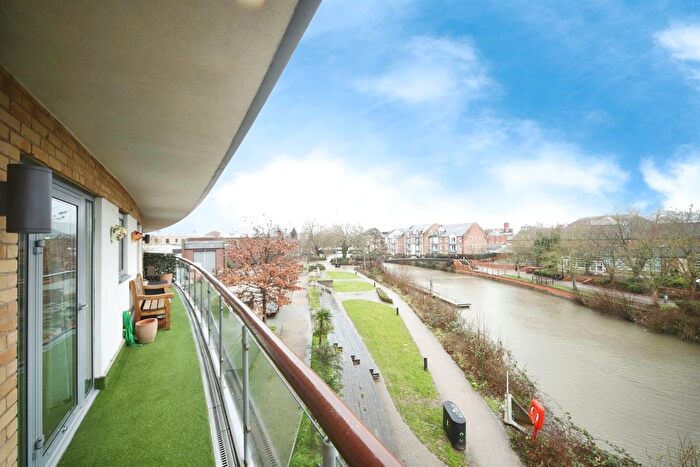
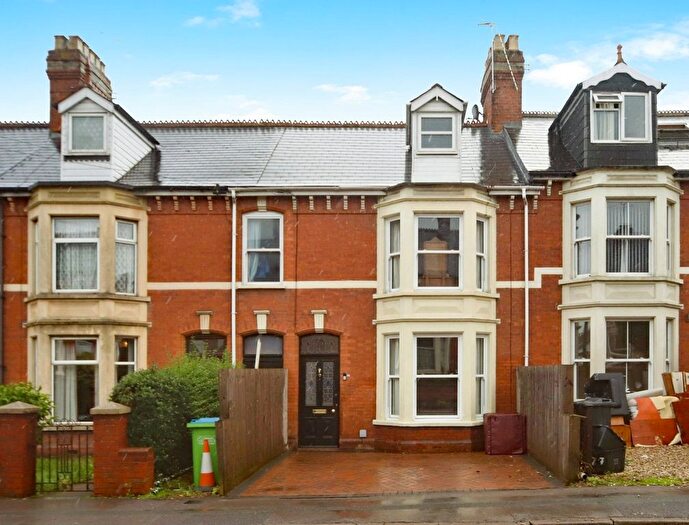
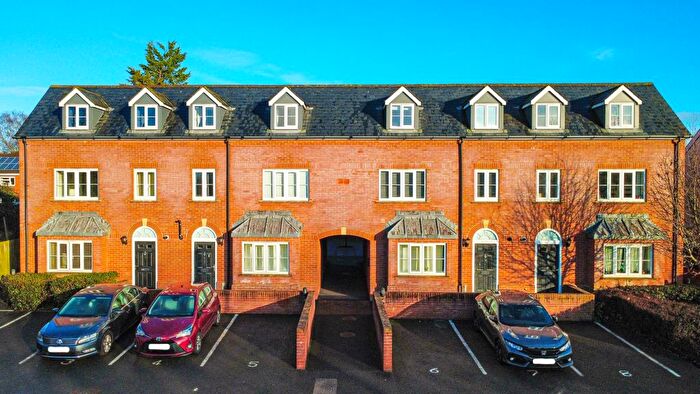
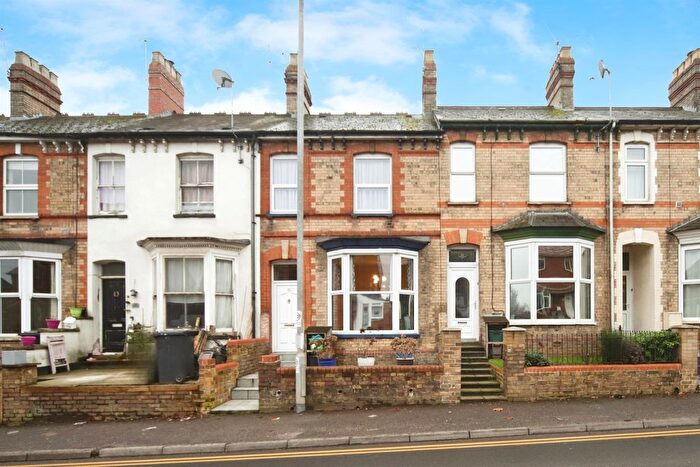
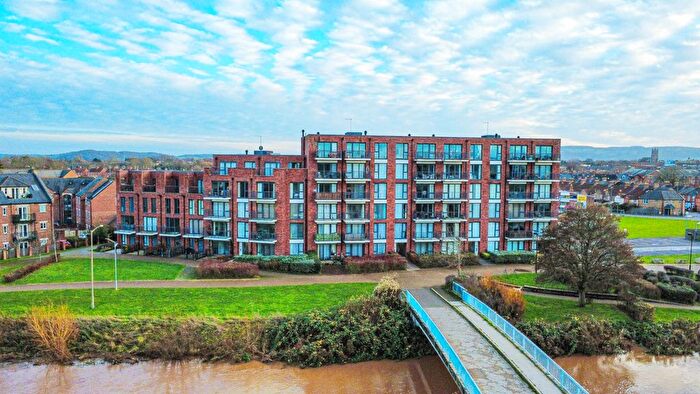
Houses for sale & to rent in North Town, Taunton
House Prices in North Town
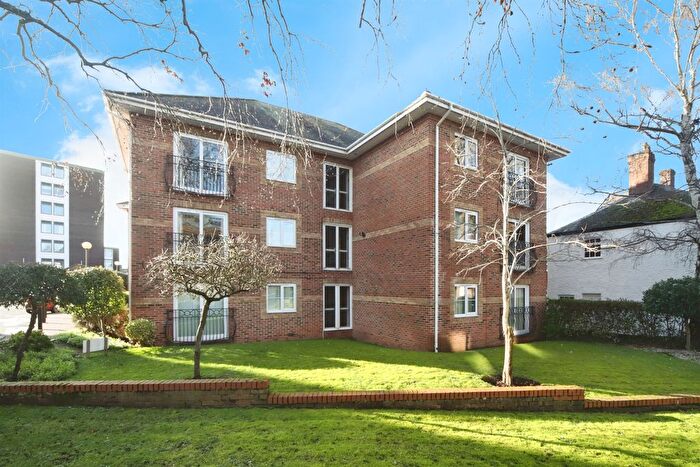
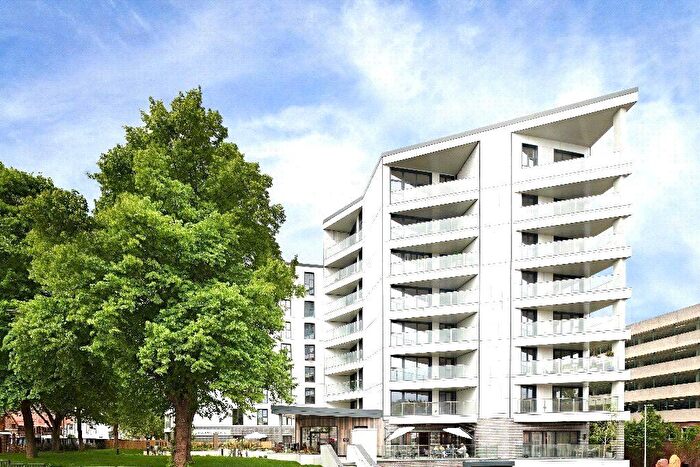
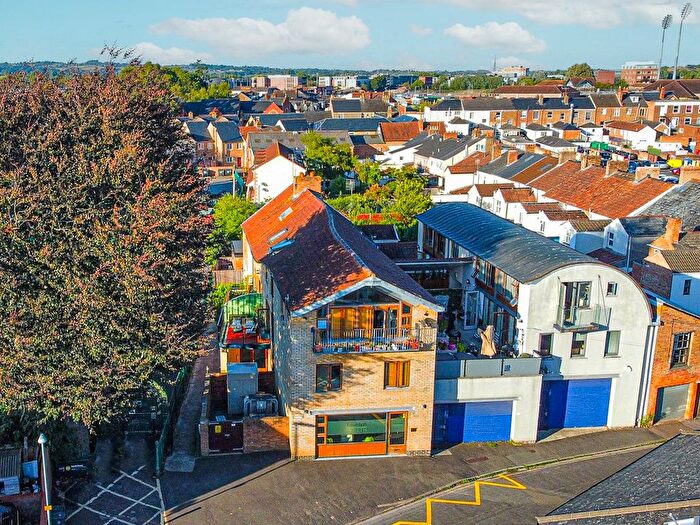
Properties in North Town have an average house price of £256,666.00 and had 3 Property Transactions within the last 3 years¹.
North Town is an area in Taunton, Somerset with 71 households², where the most expensive property was sold for £340,000.00.
Properties for sale in North Town
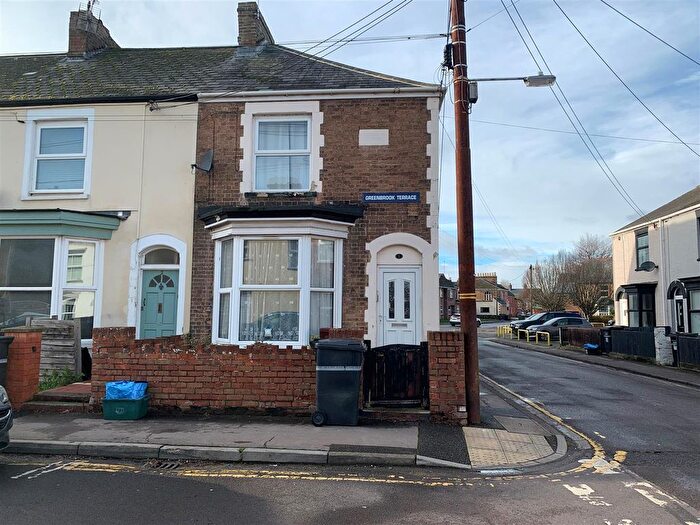
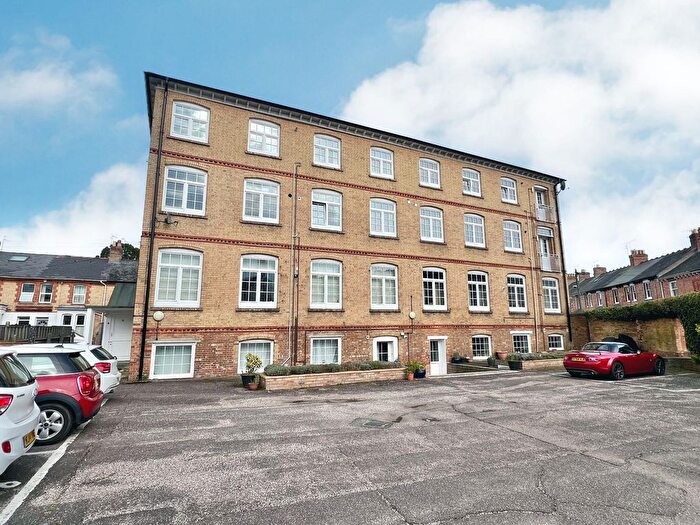
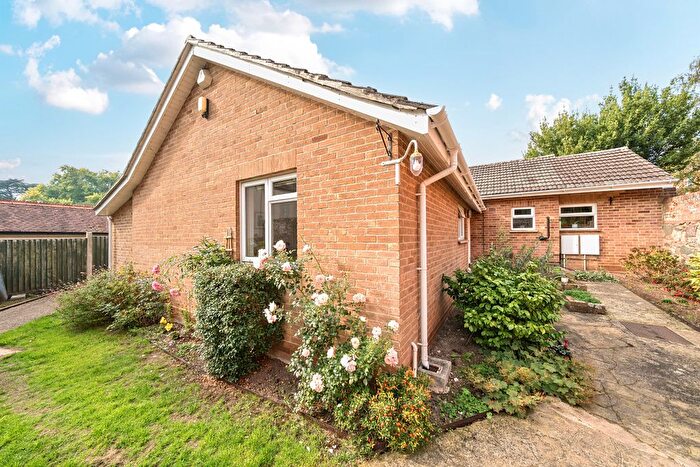
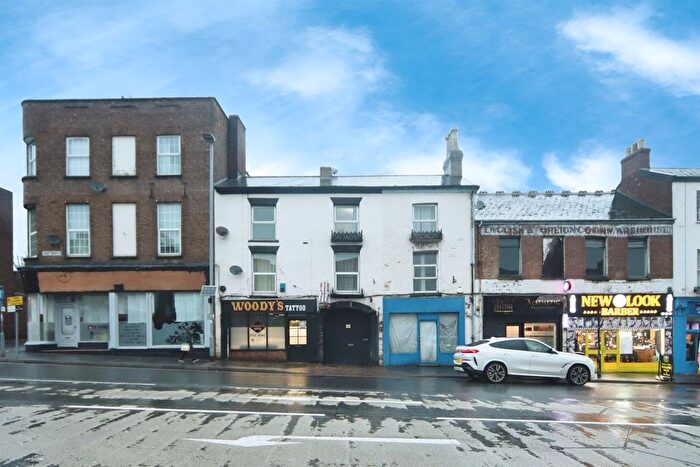
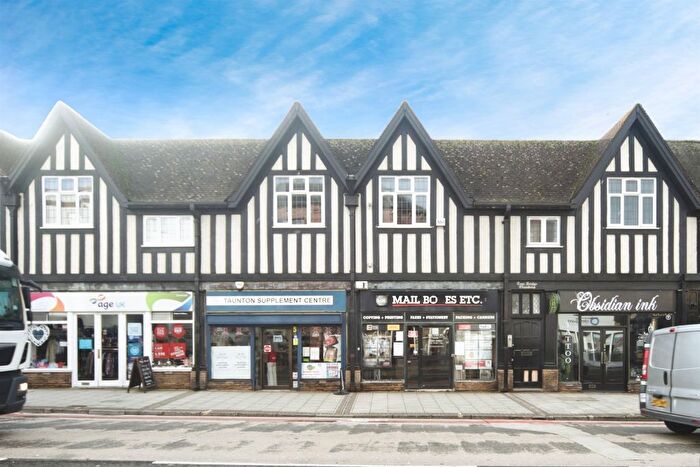
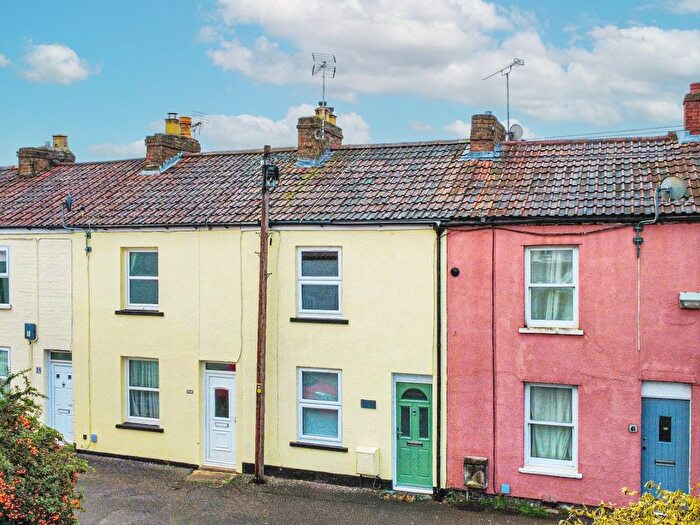
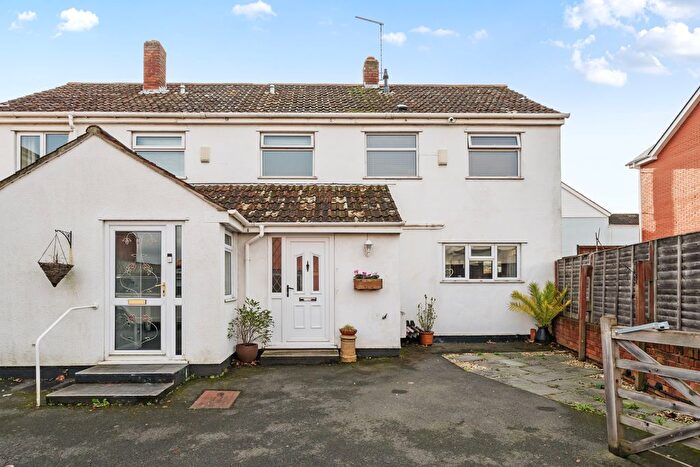
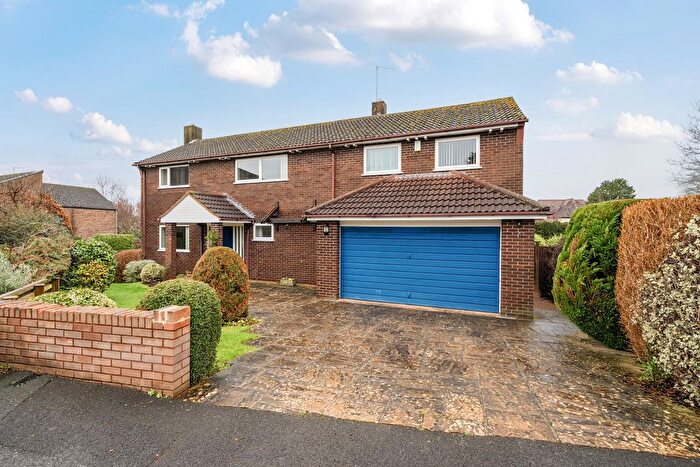
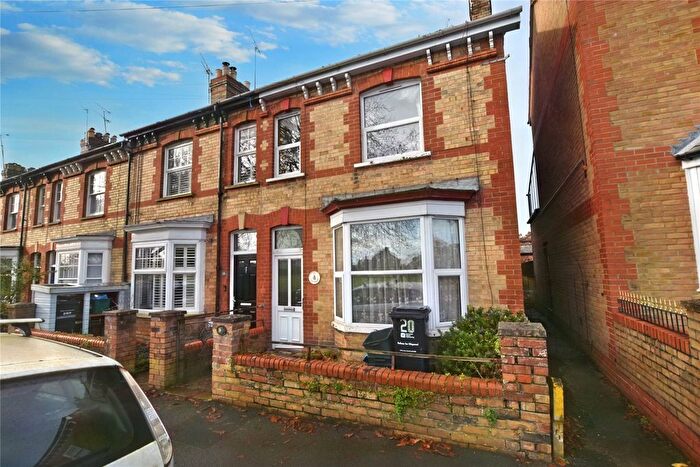
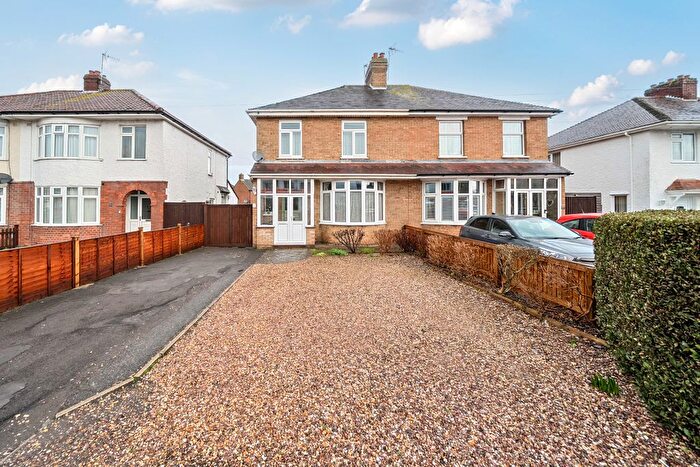
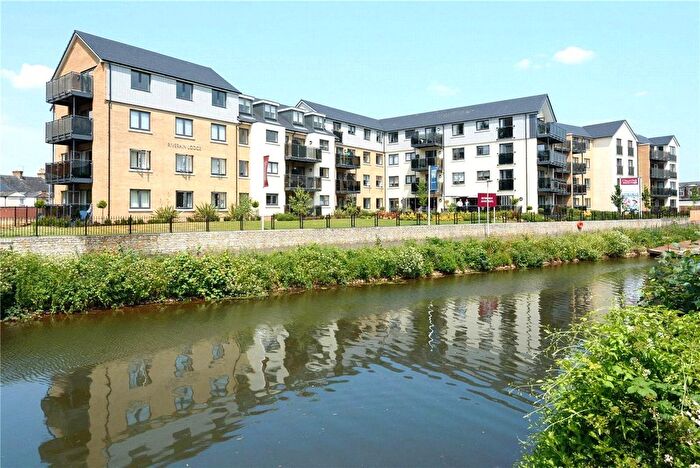
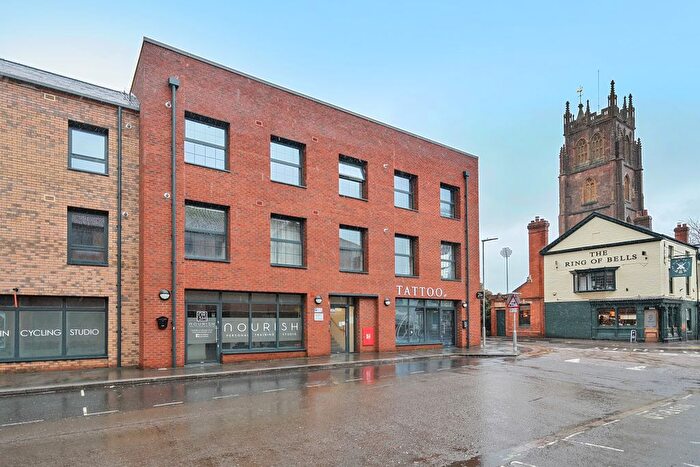
Previously listed properties in North Town
Roads and Postcodes in North Town
Navigate through our locations to find the location of your next house in North Town, Taunton for sale or to rent.
| Streets | Postcodes |
|---|---|
| Albemarle Road | TA1 1BG TA1 1BJ |
| Belvedere Road | TA1 1BT TA1 1HE TA1 9SA TA1 9SB TA1 9SD TA1 9SE TA1 9SF TA1 9SG TA1 9SH TA1 9SJ TA1 9SL TA1 9SN TA1 9SP TA1 9SQ TA1 9SR TA1 9SS TA1 9ST TA1 9SU TA1 9SW TA1 9SX TA1 9SY TA1 9SZ TA1 9TP TA1 9TR TA1 9TS TA1 9TT TA1 9TU TA1 9TY TA1 9TZ TA1 9ZY TA1 9ZZ |
| Belvedere Trading Estate | TA1 1BH |
| Bridge Street | TA1 1TG TA1 1TP TA1 1TQ TA1 1TW |
| Chip Lane | TA1 1AA TA1 1DU |
| French Weir Avenue | TA1 1NW |
| Killick Way | TA1 9XR |
| North Town Lane | TA1 1UL |
| Staplegrove Road | TA1 1DB TA1 1DF |
| Station Road | TA1 1DA TA1 1NN TA1 1NQ TA1 1NZ TA1 1PB |
| Wood Street | TA1 1UP TA1 1XL |
| TA1 1FF TA1 1NG TA1 2WG TA1 9AT TA1 9BA TA1 9GH TA1 9GL TA1 9GN TA1 9GS TA1 9HL TA1 9JL TA1 9JZ TA1 9LB TA1 9LL TA1 9LP TA1 9LQ TA1 9LU TA1 9NA TA1 9NG TA1 9NH TA1 9NJ TA1 9NP TA1 9NT TA1 9NX TA1 9PA TA1 9PB TA2 6YD TA2 8ZQ TA3 7WB TA4 3WR TA4 3WY TA4 3ZE TA4 4WF TA4 4WZ TA4 4YH TA4 4YJ TA4 4YN TA4 4ZN TA1 4ZD TA1 4ZX |
Transport near North Town
- FAQ
- Price Paid By Year
- Property Type Price
Frequently asked questions about North Town
What is the average price for a property for sale in North Town?
The average price for a property for sale in North Town is £256,666. This amount is 17% lower than the average price in Taunton. There are 1,271 property listings for sale in North Town.
Which train stations are available in or near North Town?
Some of the train stations available in or near North Town are Taunton, Bridgwater and Tiverton Parkway.
Property Price Paid in North Town by Year
The average sold property price by year was:
| Year | Average Sold Price | Price Change |
Sold Properties
|
|---|---|---|---|
| 2025 | £315,000 | 56% |
2 Properties |
| 2023 | £140,000 | -151% |
1 Property |
| 2022 | £351,394 | 58% |
27 Properties |
| 2021 | £147,000 | 18% |
2 Properties |
| 2020 | £120,000 | -5% |
1 Property |
| 2019 | £125,666 | -115% |
6 Properties |
| 2018 | £270,000 | 30% |
1 Property |
| 2016 | £190,000 | -16% |
1 Property |
| 2011 | £220,000 | 17% |
1 Property |
| 2009 | £183,000 | -11% |
2 Properties |
| 2007 | £202,500 | 15% |
2 Properties |
| 2006 | £172,500 | - |
2 Properties |
| 2004 | £172,500 | 25% |
2 Properties |
| 2002 | £130,000 | 23% |
4 Properties |
| 2000 | £100,166 | -13% |
6 Properties |
| 1999 | £113,000 | 39% |
1 Property |
| 1998 | £68,500 | 7% |
1 Property |
| 1997 | £63,500 | -89% |
2 Properties |
| 1996 | £120,000 | - |
2 Properties |
Property Price per Property Type in North Town
Here you can find historic sold price data in order to help with your property search.
The average Property Paid Price for specific property types in the last three years are:
| Property Type | Average Sold Price | Sold Properties |
|---|---|---|
| Flat | £256,666.00 | 3 Flats |

