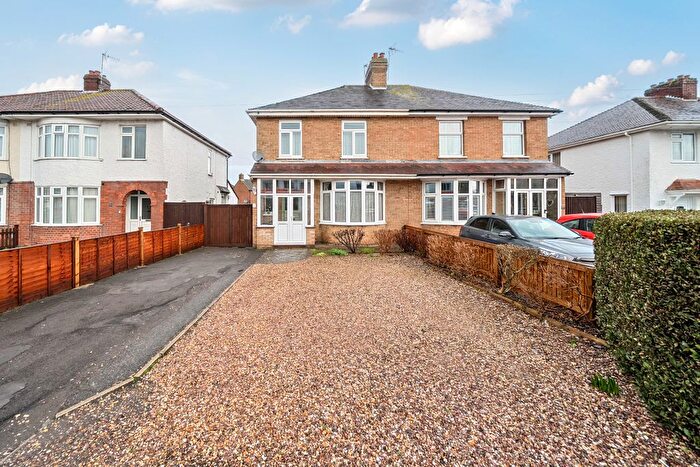
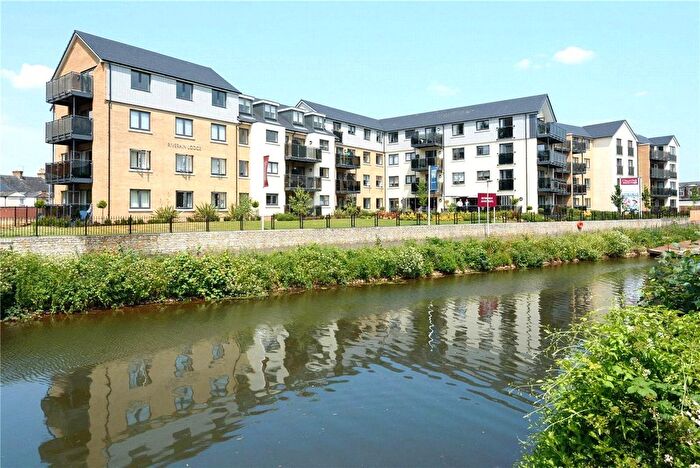
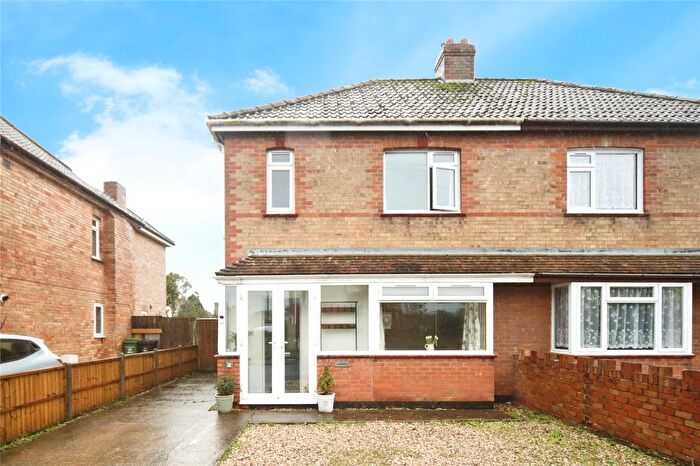
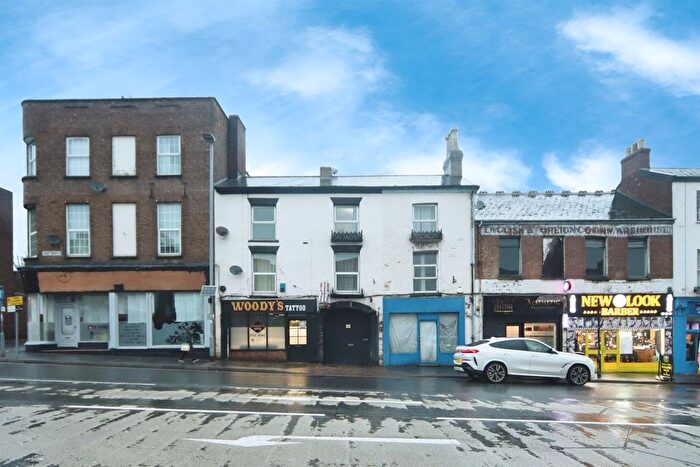
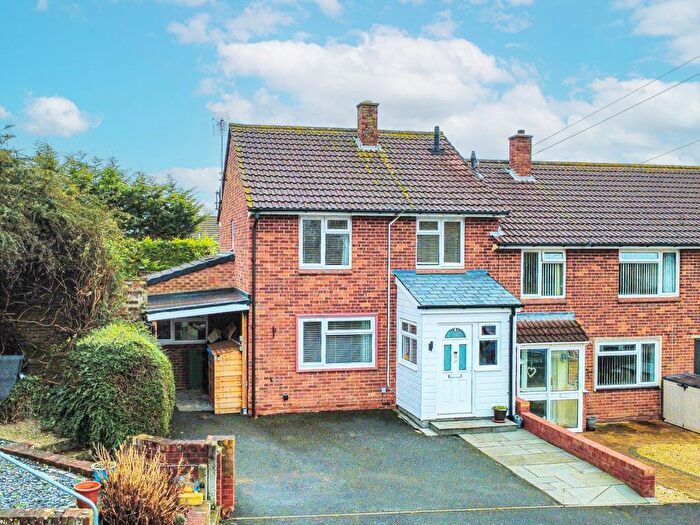
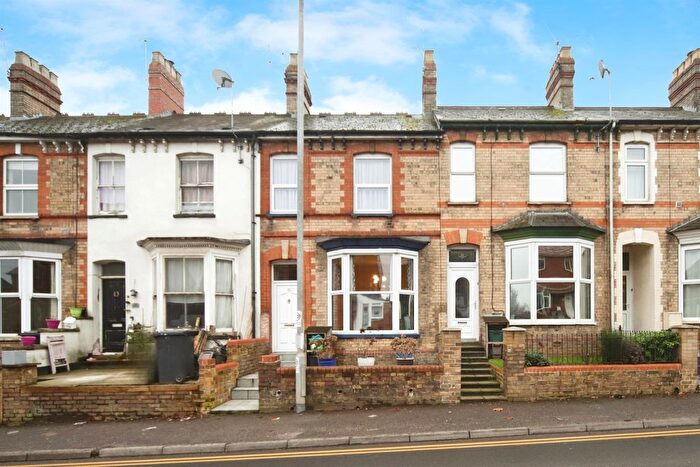
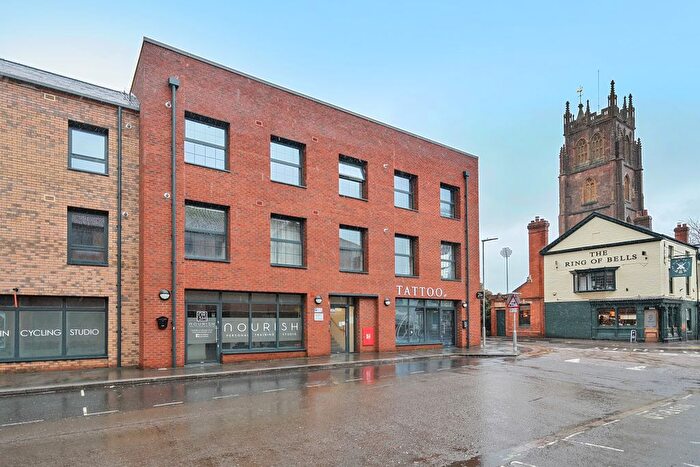
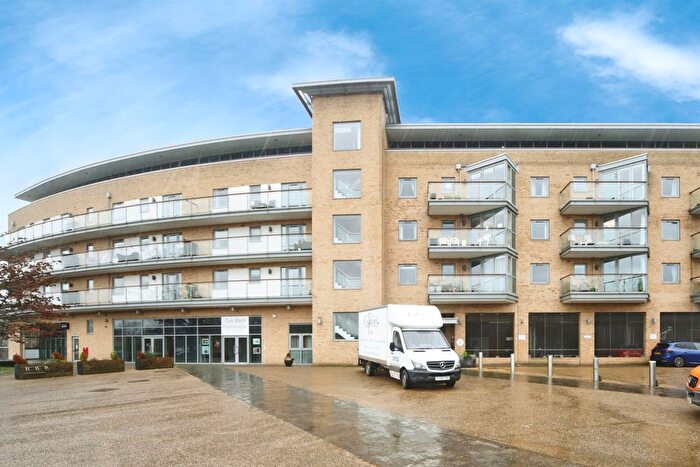
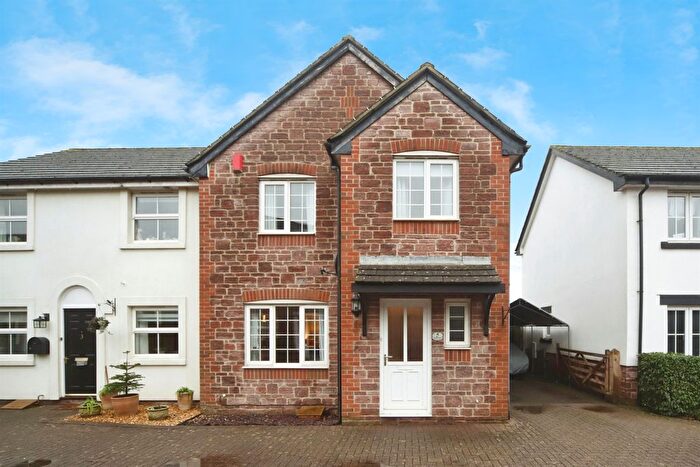
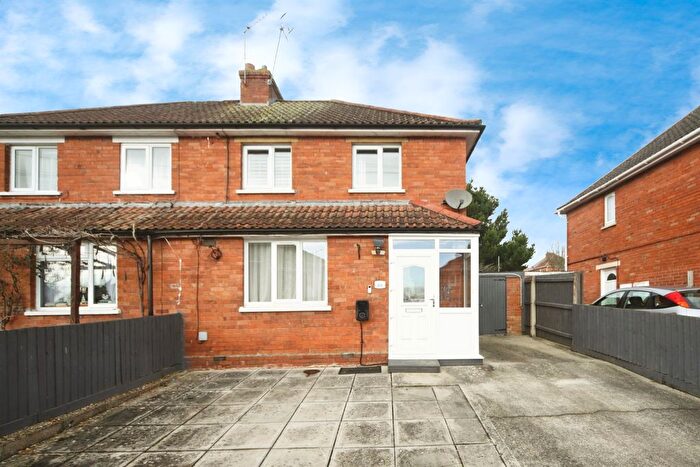
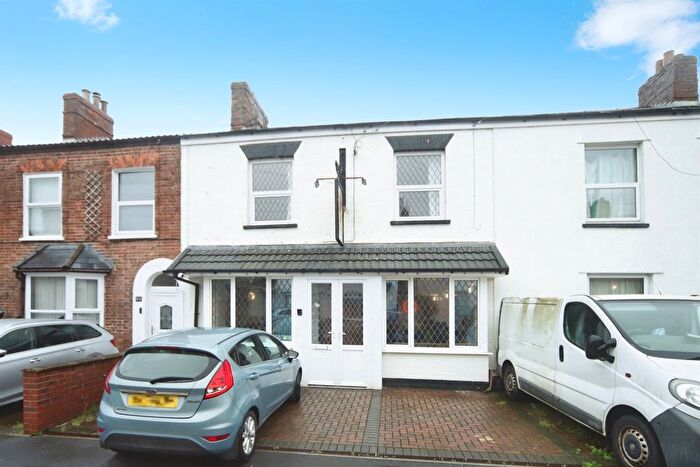
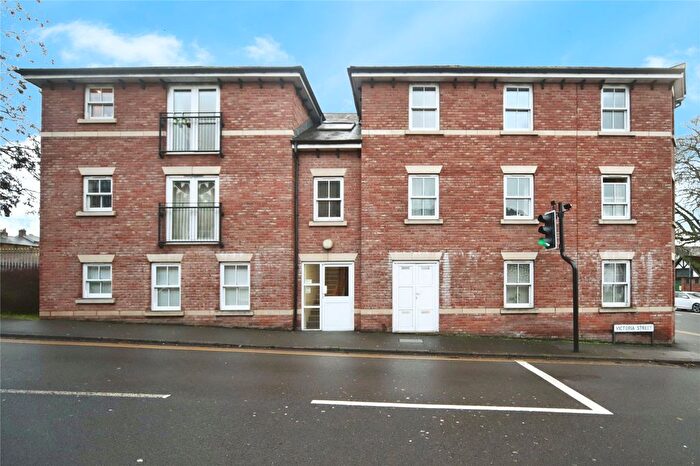
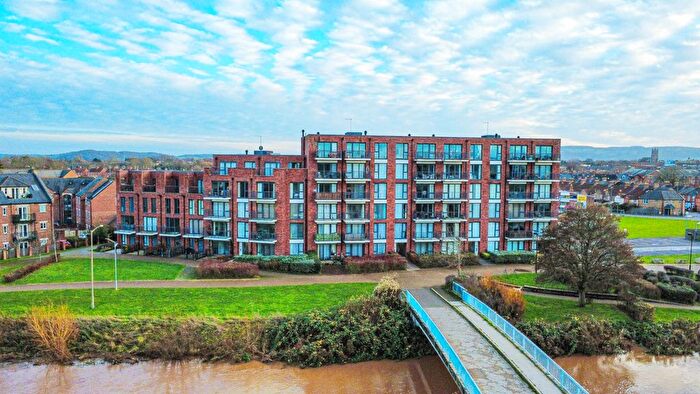
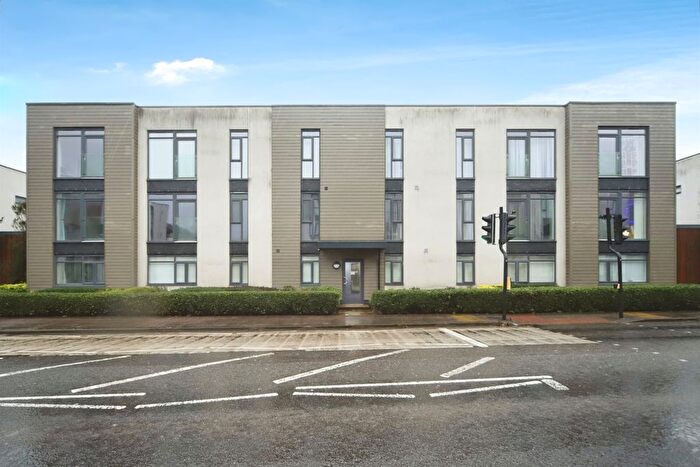
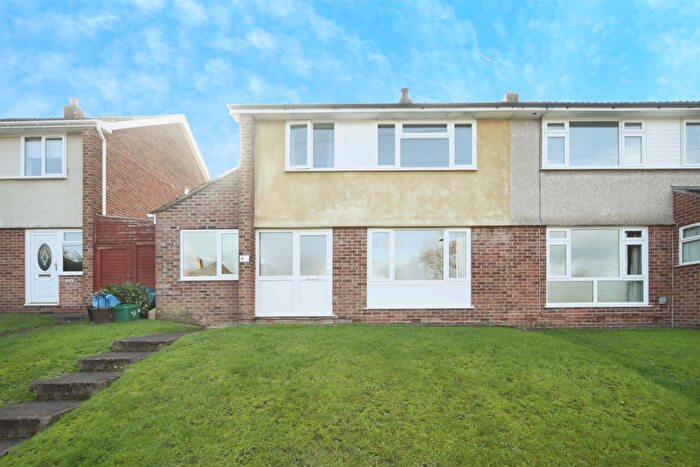
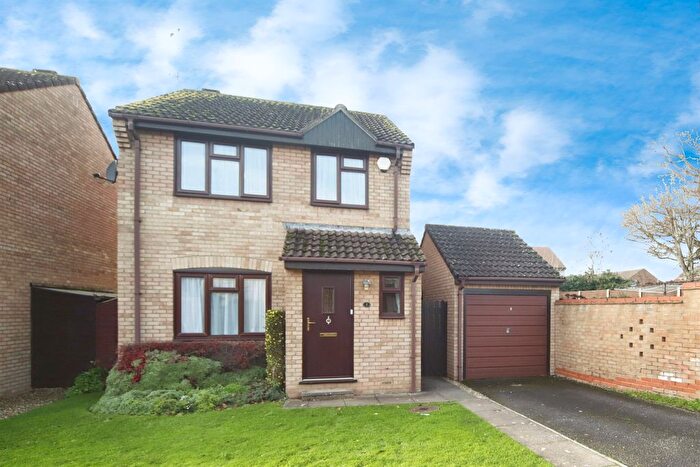
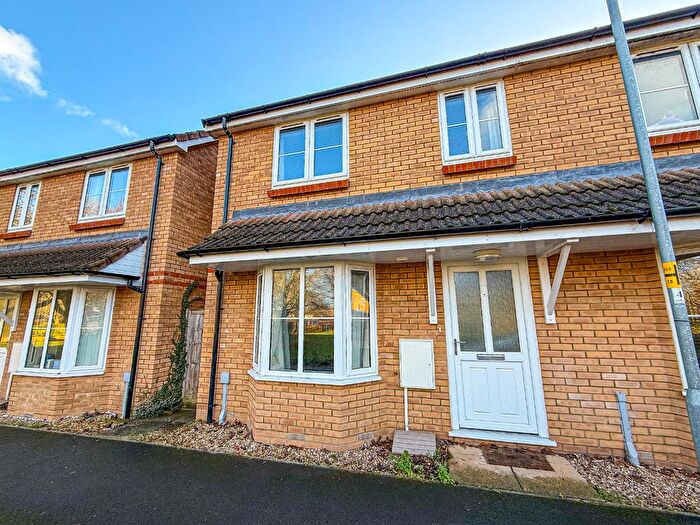
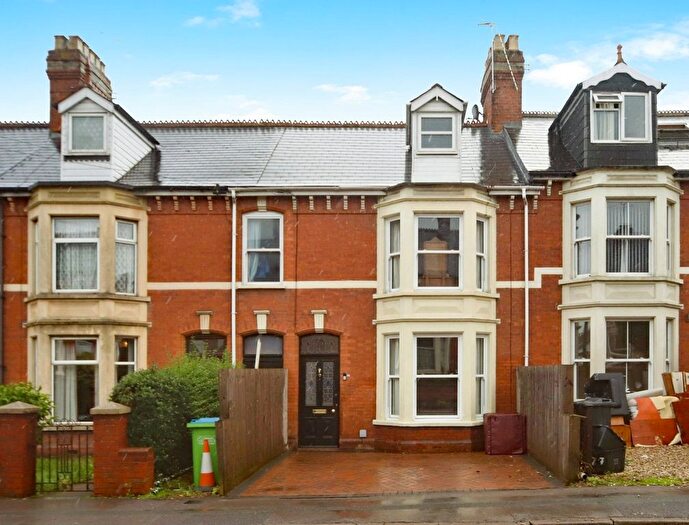
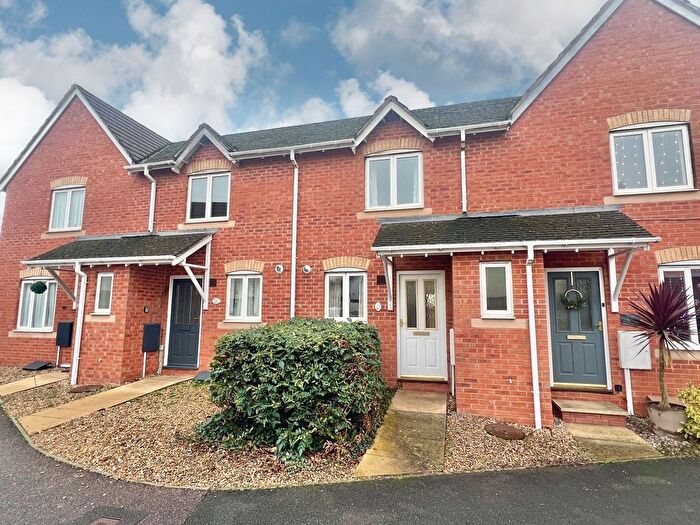
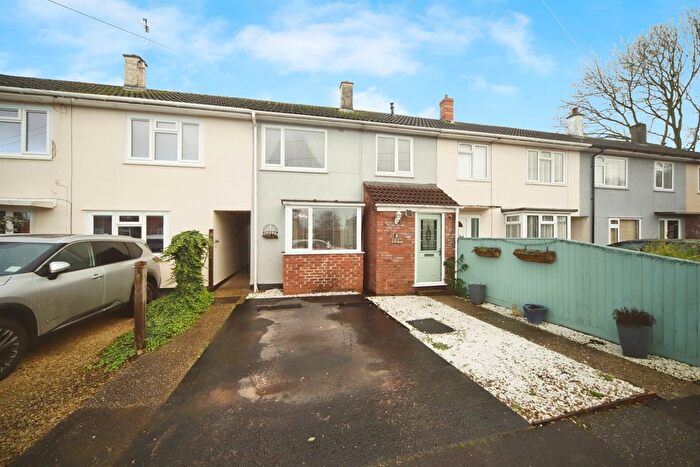
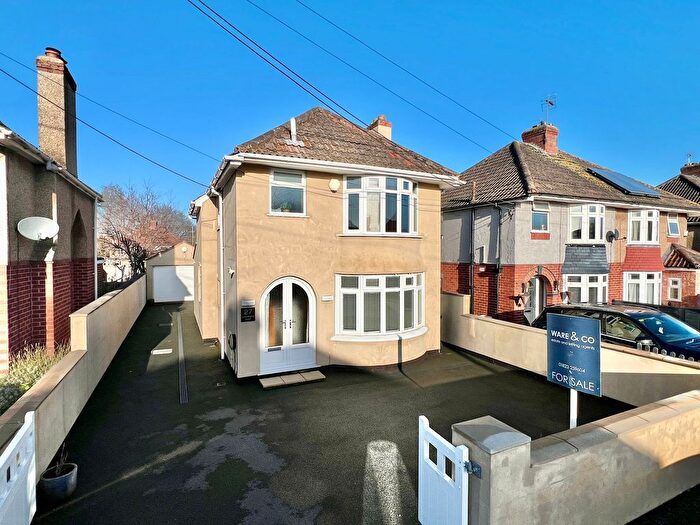
Houses for sale & to rent in Taunton Lyngford, Taunton
House Prices in Taunton Lyngford
Properties in Taunton Lyngford have an average house price of £221,474.00 and had 237 Property Transactions within the last 3 years¹.
Taunton Lyngford is an area in Taunton, Somerset with 2,261 households², where the most expensive property was sold for £565,000.00.
Properties for sale in Taunton Lyngford
Previously listed properties in Taunton Lyngford
Roads and Postcodes in Taunton Lyngford
Navigate through our locations to find the location of your next house in Taunton Lyngford, Taunton for sale or to rent.
| Streets | Postcodes |
|---|---|
| Abbey Close | TA1 1AN |
| Adcombe Road | TA2 8EH |
| Arnold Close | TA2 7SD |
| Barlinch Close | TA2 7HL |
| Blackmoor Road | TA2 8EJ TA2 8EL |
| Bowood Road | TA2 7QE |
| Bridge Street | TA1 1UD |
| Canal Terrace | TA1 1PQ |
| Chantry Close | TA2 8EN |
| Cheddon Road | TA2 7AH TA2 7AL TA2 7DH TA2 7DL TA2 7DN TA2 7DP TA2 7DR TA2 7DW |
| Cleeve Road | TA2 8DX |
| Compton Close | TA2 7UD |
| Dellers Wharf | TA1 1DX |
| Denmark Terrace | TA2 7AG |
| Draycott Avenue | TA2 7QF TA2 7QG |
| Dunster Close | TA2 8EE |
| Eastwick Avenue | TA2 7AJ |
| Eastwick Road | TA2 7HB TA2 7HF TA2 7HG TA2 7HJ TA2 7HQ |
| Eaton Crescent | TA2 7UE TA2 7UF TA2 7UG |
| Enmore Road | TA2 7LR TA2 7LS |
| Fairfield Road | TA2 8EF TA2 8EG TA2 8EQ |
| Firepool View | TA1 1NY TA1 1PS |
| George Street | TA2 7DF TA2 7DG |
| Glenthorne Road | TA2 7PP |
| Grange Drive | TA2 7DY TA2 7DZ |
| Grange Gardens | TA2 7EN |
| Hammets Wharf | TA1 1JY |
| Horner Road | TA2 8DY TA2 8DZ TA2 8EA |
| Kilkenny Avenue | TA2 7PJ |
| Kilve Close | TA2 7TB |
| Kilve Crescent | TA2 7LT |
| Kingston Road | TA2 7SP TA2 7SR |
| Lansdowne Road | TA2 7QB TA2 7QD |
| Lyngford Place | TA2 7EP TA2 7EW |
| Lyngford Road | TA2 7EE TA2 7EF TA2 7EG TA2 7EH TA2 7EJ TA2 7EQ |
| Lyngford Square | TA2 7ES TA2 7ET TA2 7EU TA2 7EX TA2 7EY TA2 7EZ |
| Malvern Terrace | TA2 7PN |
| Massingham Park | TA2 7TG TA2 7TH TA2 7TN TA2 7TQ |
| Obridge Close | TA2 7QJ |
| Obridge Cottages | TA2 7PY |
| Obridge Crescent | TA2 7PZ |
| Obridge Lane | TA2 7QN |
| Obridge Road | TA2 7PU TA2 7PX TA2 7QA |
| Pickeridge Close | TA2 7HN TA2 7HW |
| Plais Street | TA2 7PR |
| Priorswood Road | TA2 7PL TA2 7PS TA2 7PT TA2 7PW TA2 7QH TA2 7QQ |
| Prospect Terrace | TA1 1PH |
| Radlet Close | TA2 8EB TA2 8ED |
| Rowbarton Close | TA2 7DQ |
| St Peters Close | TA2 7HE |
| Station Road | TA1 1NL TA1 1NS TA1 1PD |
| Vera Street | TA2 7BF TA2 7DJ |
| Wedlands | TA2 7AA TA2 7AB TA2 7AD TA2 7AE TA2 7AF |
| Wellesley Street | TA2 7DS |
| Winslade Close | TA2 7HA |
| Woodland Road | TA2 7HR |
Transport near Taunton Lyngford
- FAQ
- Price Paid By Year
- Property Type Price
Frequently asked questions about Taunton Lyngford
What is the average price for a property for sale in Taunton Lyngford?
The average price for a property for sale in Taunton Lyngford is £221,474. This amount is 29% lower than the average price in Taunton. There are 1,180 property listings for sale in Taunton Lyngford.
What streets have the most expensive properties for sale in Taunton Lyngford?
The streets with the most expensive properties for sale in Taunton Lyngford are Malvern Terrace at an average of £347,500, Hammets Wharf at an average of £318,000 and Eastwick Avenue at an average of £304,000.
What streets have the most affordable properties for sale in Taunton Lyngford?
The streets with the most affordable properties for sale in Taunton Lyngford are Dellers Wharf at an average of £109,363, Abbey Close at an average of £153,000 and Kilve Close at an average of £162,700.
Which train stations are available in or near Taunton Lyngford?
Some of the train stations available in or near Taunton Lyngford are Taunton, Bridgwater and Tiverton Parkway.
Property Price Paid in Taunton Lyngford by Year
The average sold property price by year was:
| Year | Average Sold Price | Price Change |
Sold Properties
|
|---|---|---|---|
| 2025 | £226,964 | 3% |
62 Properties |
| 2024 | £219,586 | - |
80 Properties |
| 2023 | £219,480 | 2% |
95 Properties |
| 2022 | £214,543 | 6% |
97 Properties |
| 2021 | £202,600 | 11% |
106 Properties |
| 2020 | £179,592 | -0,2% |
68 Properties |
| 2019 | £179,888 | -2% |
89 Properties |
| 2018 | £183,329 | 12% |
93 Properties |
| 2017 | £162,022 | -4% |
115 Properties |
| 2016 | £169,292 | -1% |
121 Properties |
| 2015 | £171,525 | 0,1% |
120 Properties |
| 2014 | £171,362 | 14% |
143 Properties |
| 2013 | £147,978 | 14% |
109 Properties |
| 2012 | £127,410 | -16% |
70 Properties |
| 2011 | £147,265 | 1% |
62 Properties |
| 2010 | £145,699 | 1% |
67 Properties |
| 2009 | £144,354 | -4% |
71 Properties |
| 2008 | £150,774 | -9% |
56 Properties |
| 2007 | £164,957 | 16% |
110 Properties |
| 2006 | £139,323 | -7% |
177 Properties |
| 2005 | £149,033 | 8% |
126 Properties |
| 2004 | £136,806 | 9% |
141 Properties |
| 2003 | £124,782 | 17% |
106 Properties |
| 2002 | £103,463 | 18% |
100 Properties |
| 2001 | £85,258 | 10% |
124 Properties |
| 2000 | £76,343 | 13% |
105 Properties |
| 1999 | £66,730 | 17% |
211 Properties |
| 1998 | £55,472 | 4% |
98 Properties |
| 1997 | £53,267 | 13% |
69 Properties |
| 1996 | £46,584 | -3% |
69 Properties |
| 1995 | £48,207 | - |
64 Properties |
Property Price per Property Type in Taunton Lyngford
Here you can find historic sold price data in order to help with your property search.
The average Property Paid Price for specific property types in the last three years are:
| Property Type | Average Sold Price | Sold Properties |
|---|---|---|
| Semi Detached House | £258,720.00 | 78 Semi Detached Houses |
| Detached House | £331,488.00 | 9 Detached Houses |
| Terraced House | £232,157.00 | 81 Terraced Houses |
| Flat | £152,478.00 | 69 Flats |

