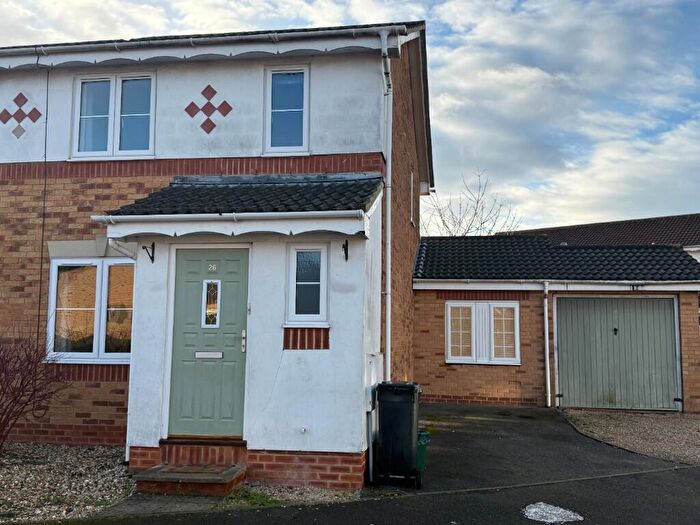
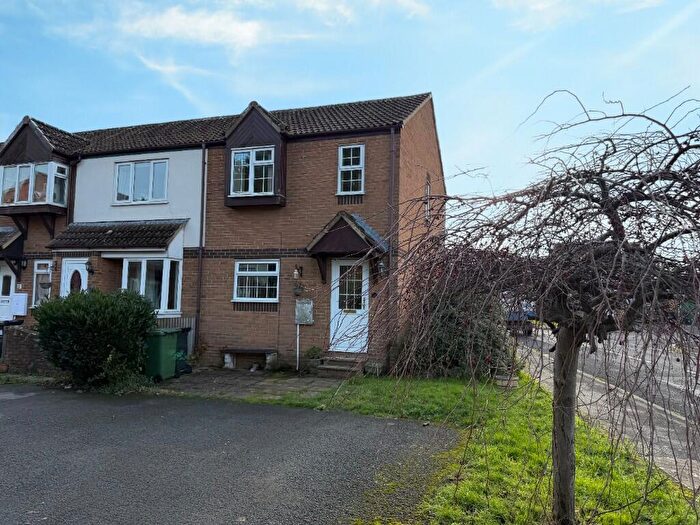
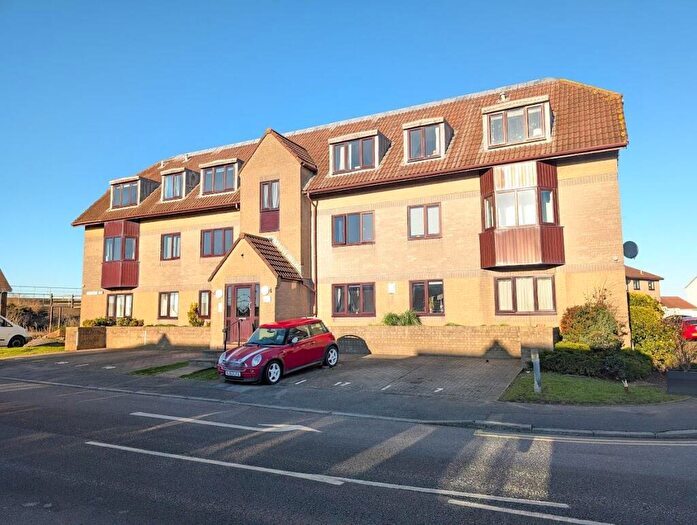
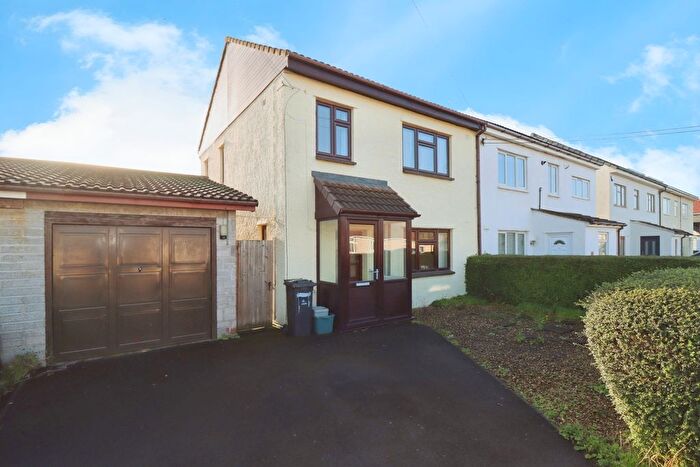
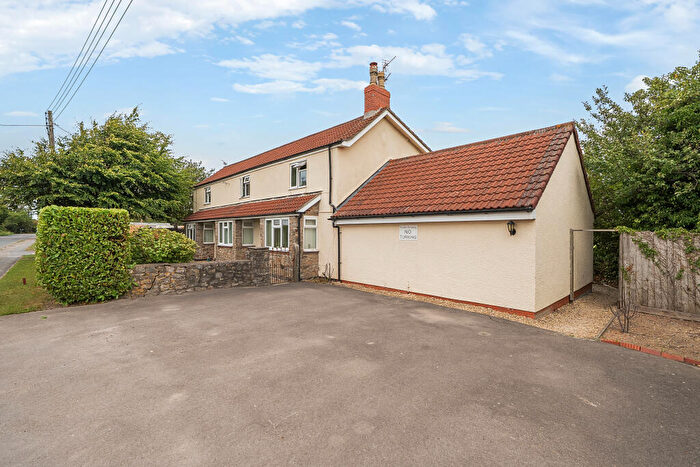
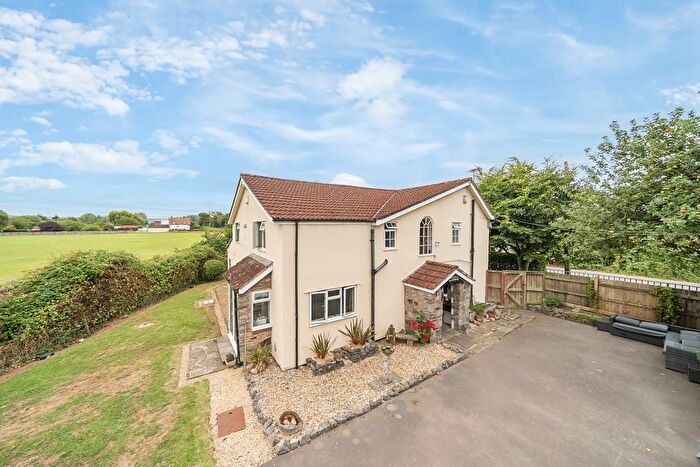
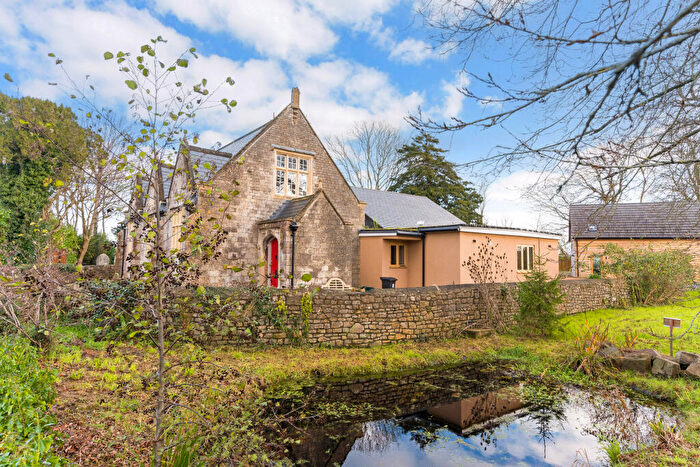
Houses for sale & to rent in Pilning And Severn Beach, Bristol
House Prices in Pilning And Severn Beach
Properties in Pilning And Severn Beach have an average house price of £317,012.00 and had 177 Property Transactions within the last 3 years¹.
Pilning And Severn Beach is an area in Bristol, South Gloucestershire with 1,416 households², where the most expensive property was sold for £913,000.00.
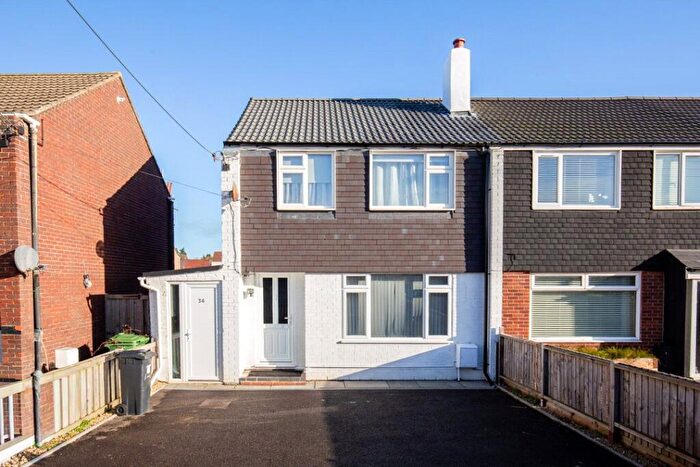
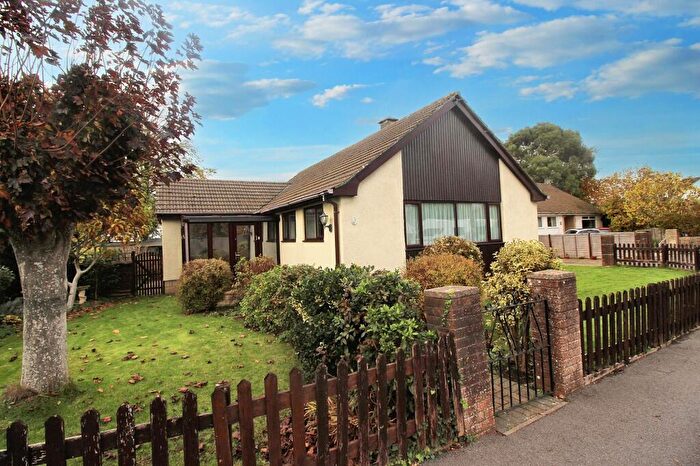
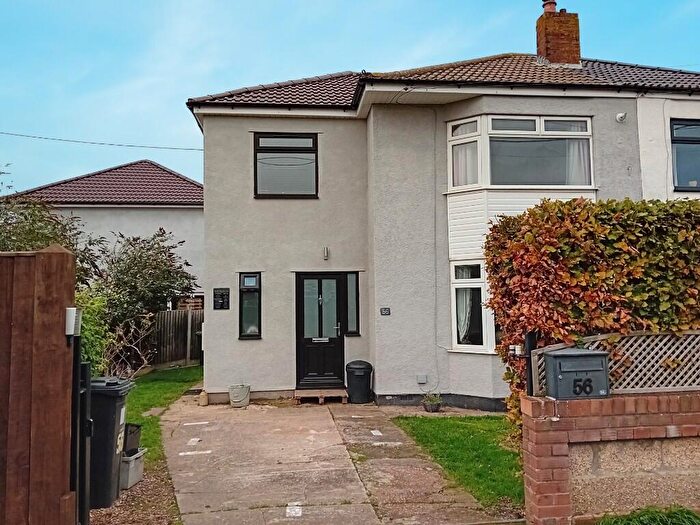
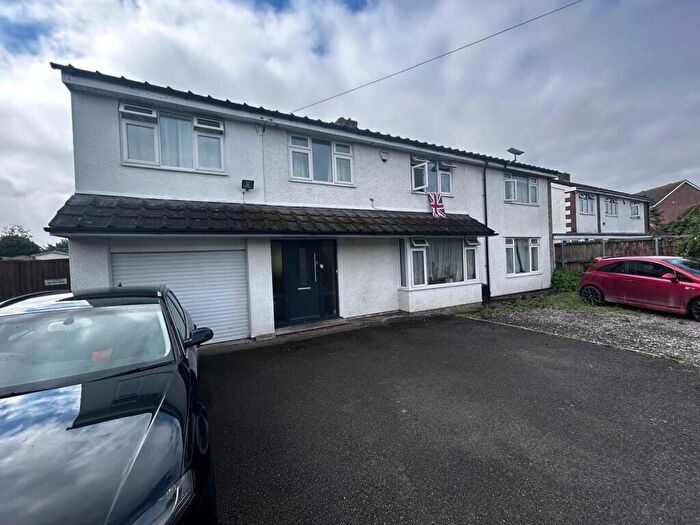
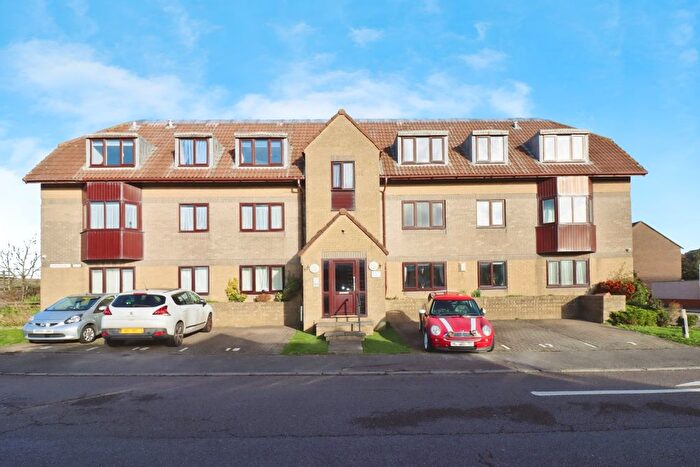
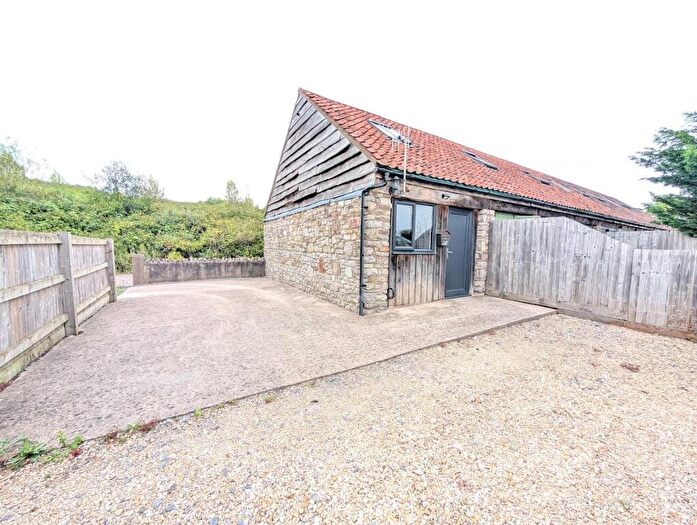
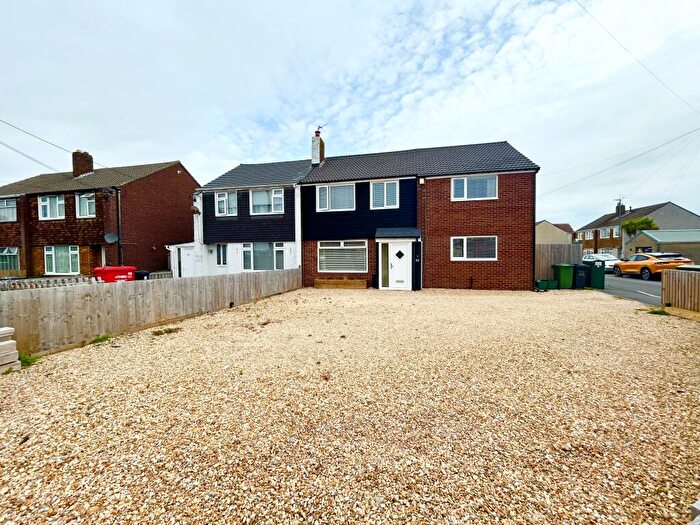
Properties for sale in Pilning And Severn Beach
Previously listed properties in Pilning And Severn Beach
Roads and Postcodes in Pilning And Severn Beach
Navigate through our locations to find the location of your next house in Pilning And Severn Beach, Bristol for sale or to rent.
| Streets | Postcodes |
|---|---|
| Abbott Road | BS35 4PU |
| Ableton Lane | BS35 4PP BS35 4PR |
| Albert Road | BS35 4PT |
| Aust Road | BS35 4HG |
| Bank Road | BS35 4JG BS35 4JH |
| Beach Avenue | BS35 4PB BS35 4PD |
| Beach Road | BS35 4PE BS35 4PF BS35 4PJ BS35 4PQ |
| Bilsham Lane | BS35 4HD |
| Blands Row | BS35 4NF |
| Chessell Avenue | BS35 4LP |
| Church Road | BS35 4NL BS35 4PW |
| Clarence Cottages | BS35 4NB |
| Council Houses | BS35 4HF |
| Cranmoor Green | BS35 4QF |
| Cross Hands Road | BS35 4JB |
| Denny Isle Drive | BS35 4PZ |
| Fern Cottages | BS35 4NE |
| Gorse Cover Road | BS35 4NP BS35 4NR BS35 4NT |
| Keens Grove | BS35 4LW |
| Little Green Lane | BS35 4NJ |
| Marsh Common Road | BS35 4JU BS35 4JX BS35 4JY |
| Meadow View | BS35 4LF |
| New Passage | BS35 4NG |
| New Passage Road | BS35 4LZ |
| Northwick Road | BS35 4HA BS35 4HB BS35 4HE BS35 4JE |
| Osborne Road | BS35 4PG |
| Prospect Road | BS35 4QB |
| Redwick Gardens | BS35 4LL |
| Redwick Road | BS35 4LG BS35 4LQ BS35 4LU BS35 4LY |
| Riverside Park | BS35 4PN |
| Rookery Lane | BS35 4JN |
| Salmon Close | BS35 4NS |
| School Way | BS35 4QA |
| Severn Road | BS35 4HW |
| Severnwood Gardens | BS35 4PX |
| Shaft Road | BS35 4NH BS35 4NQ |
| Station Road | BS35 4JT BS35 4JW BS35 4PL |
| Sunnyside Cottages | BS35 4JA |
| The Glebe | BS35 4LE |
| The Quadrilles | BS35 4QE |
| Vicarage Road | BS35 4LN |
| Victoria Crescent | BS35 4PS |
| Wainbridge Crescent | BS35 4LH BS35 4LJ |
| Whitehouse Lane | BS35 4NN |
| Wick Road | BS35 4LT |
Transport near Pilning And Severn Beach
-
Severn Beach Station
-
Pilning Station
-
St.Andrew's Road Station
-
Patchway Station
-
Avonmouth Station
-
Caldicot Station
- FAQ
- Price Paid By Year
- Property Type Price
Frequently asked questions about Pilning And Severn Beach
What is the average price for a property for sale in Pilning And Severn Beach?
The average price for a property for sale in Pilning And Severn Beach is £317,012. This amount is 10% lower than the average price in Bristol. There are 107 property listings for sale in Pilning And Severn Beach.
What streets have the most expensive properties for sale in Pilning And Severn Beach?
The streets with the most expensive properties for sale in Pilning And Severn Beach are Northwick Road at an average of £667,666, Osborne Road at an average of £465,000 and Beach Avenue at an average of £416,500.
What streets have the most affordable properties for sale in Pilning And Severn Beach?
The streets with the most affordable properties for sale in Pilning And Severn Beach are Blands Row at an average of £232,500, Chessell Avenue at an average of £245,083 and Beach Road at an average of £249,193.
Which train stations are available in or near Pilning And Severn Beach?
Some of the train stations available in or near Pilning And Severn Beach are Severn Beach, Pilning and St.Andrew's Road.
Property Price Paid in Pilning And Severn Beach by Year
The average sold property price by year was:
| Year | Average Sold Price | Price Change |
Sold Properties
|
|---|---|---|---|
| 2025 | £283,437 | -18% |
32 Properties |
| 2024 | £335,823 | 5% |
51 Properties |
| 2023 | £320,615 | 1% |
47 Properties |
| 2022 | £315,858 | 14% |
47 Properties |
| 2021 | £272,230 | 7% |
65 Properties |
| 2020 | £253,430 | -3% |
35 Properties |
| 2019 | £261,199 | 9% |
55 Properties |
| 2018 | £238,135 | -1% |
51 Properties |
| 2017 | £239,723 | 8% |
58 Properties |
| 2016 | £219,488 | 8% |
60 Properties |
| 2015 | £202,692 | 11% |
71 Properties |
| 2014 | £180,450 | -7% |
52 Properties |
| 2013 | £192,727 | 7% |
47 Properties |
| 2012 | £179,776 | -16% |
47 Properties |
| 2011 | £208,861 | 10% |
27 Properties |
| 2010 | £188,628 | -0,4% |
56 Properties |
| 2009 | £189,387 | 6% |
40 Properties |
| 2008 | £177,628 | -9% |
35 Properties |
| 2007 | £194,446 | 6% |
93 Properties |
| 2006 | £182,327 | 9% |
120 Properties |
| 2005 | £165,281 | -2% |
69 Properties |
| 2004 | £168,928 | 18% |
103 Properties |
| 2003 | £137,741 | 10% |
84 Properties |
| 2002 | £123,303 | 12% |
175 Properties |
| 2001 | £108,442 | 21% |
112 Properties |
| 2000 | £85,747 | 6% |
76 Properties |
| 1999 | £80,286 | 16% |
183 Properties |
| 1998 | £67,642 | -9% |
129 Properties |
| 1997 | £74,010 | 12% |
112 Properties |
| 1996 | £64,844 | 30% |
89 Properties |
| 1995 | £45,191 | - |
40 Properties |
Property Price per Property Type in Pilning And Severn Beach
Here you can find historic sold price data in order to help with your property search.
The average Property Paid Price for specific property types in the last three years are:
| Property Type | Average Sold Price | Sold Properties |
|---|---|---|
| Semi Detached House | £299,033.00 | 74 Semi Detached Houses |
| Detached House | £429,623.00 | 43 Detached Houses |
| Terraced House | £278,323.00 | 48 Terraced Houses |
| Flat | £179,125.00 | 12 Flats |

