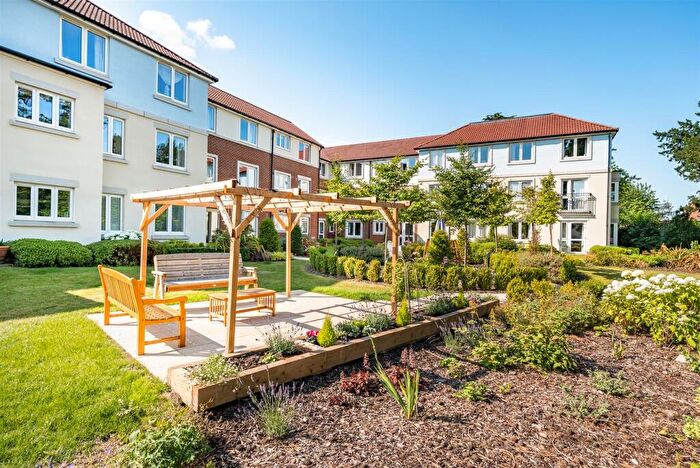
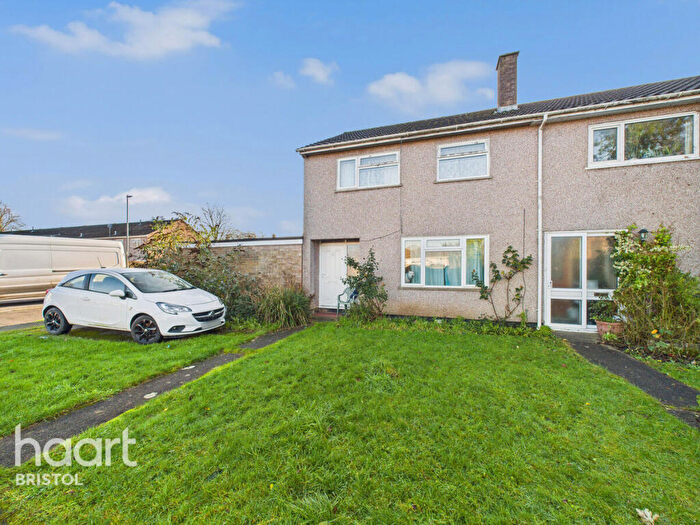
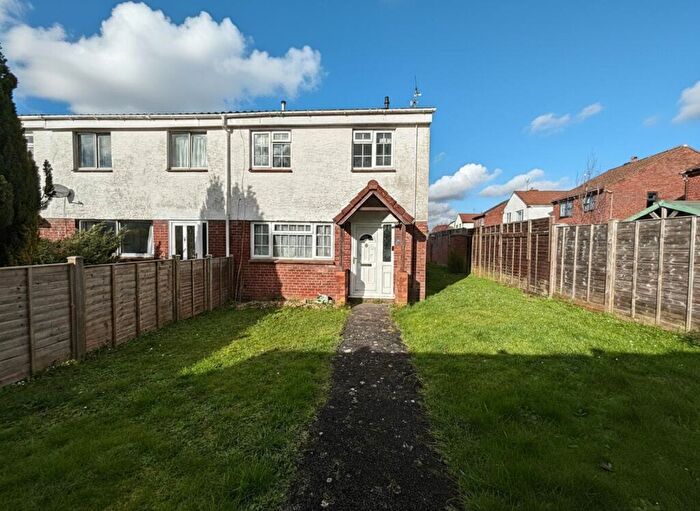
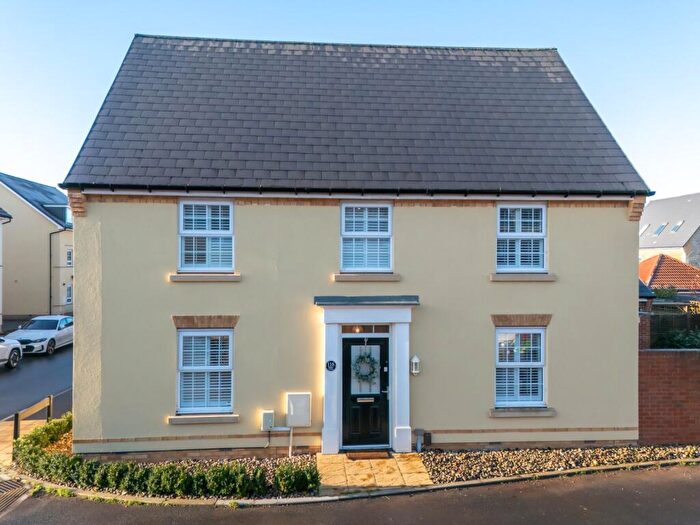
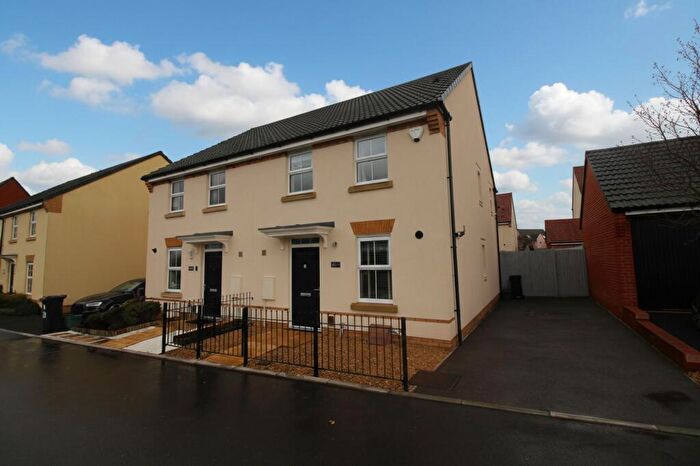
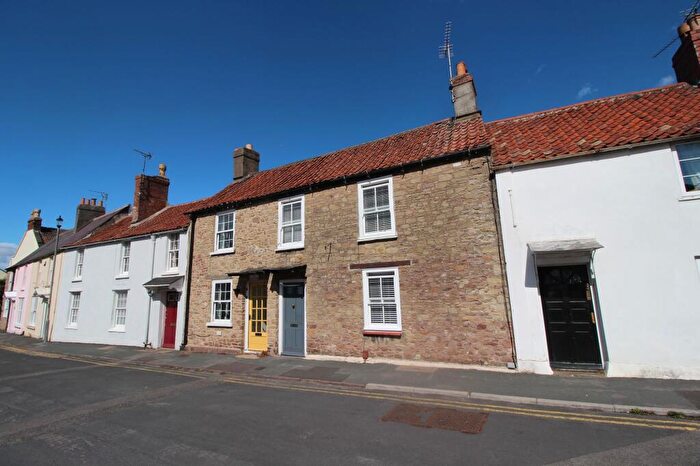
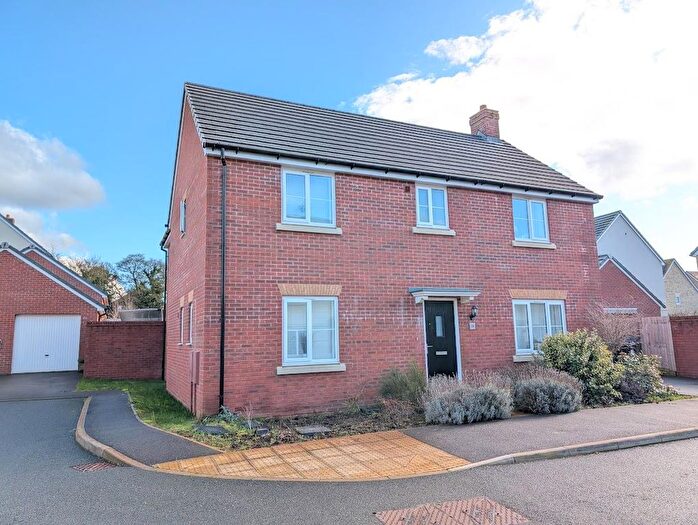
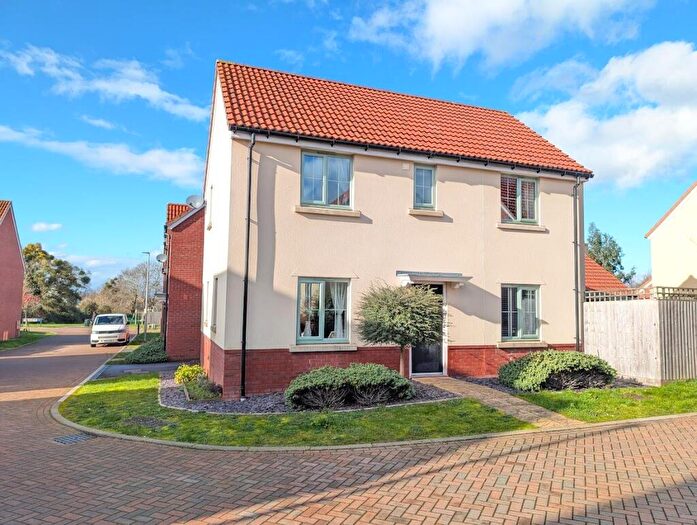
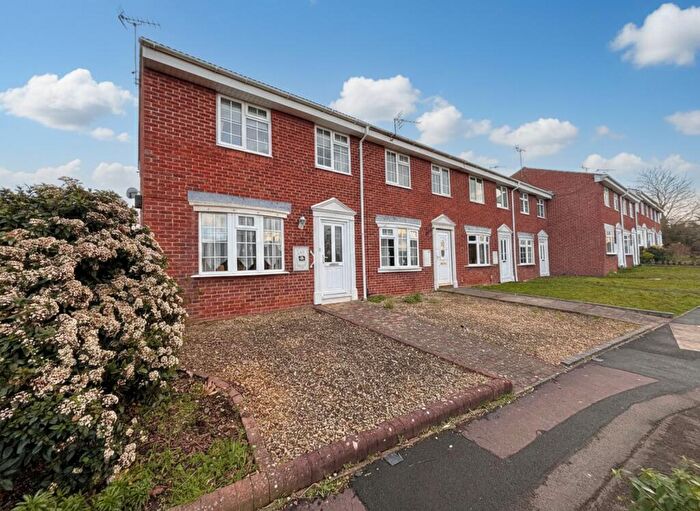
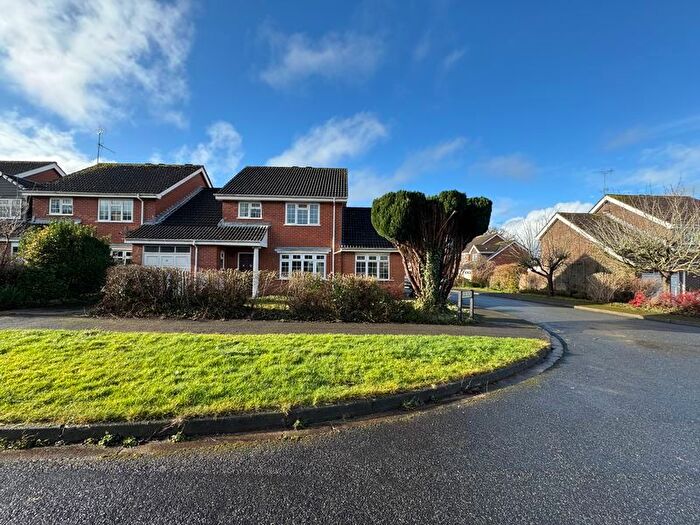
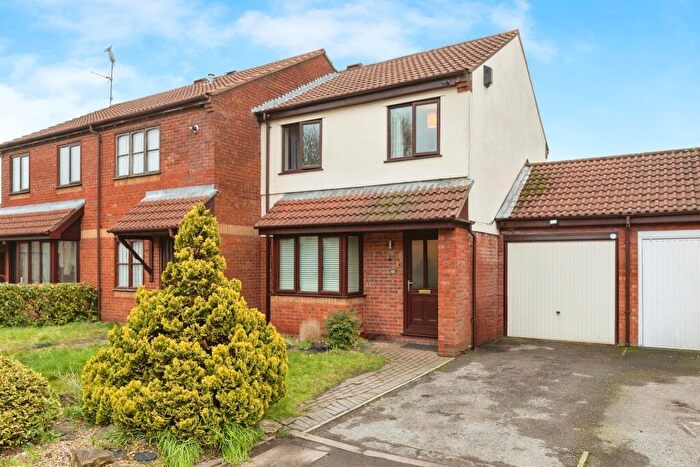
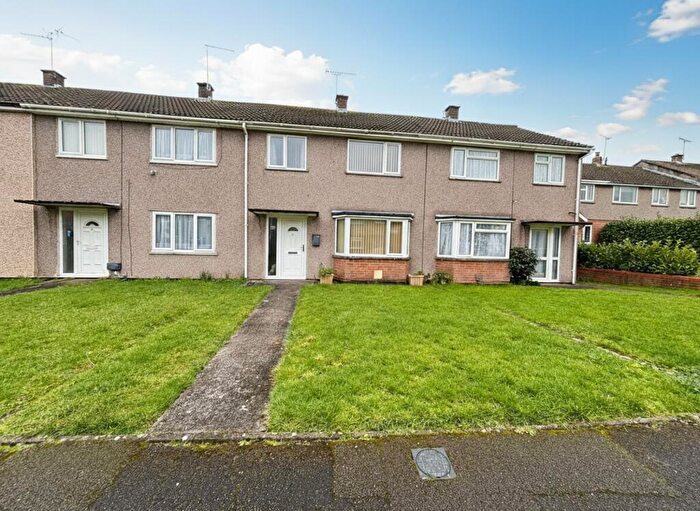
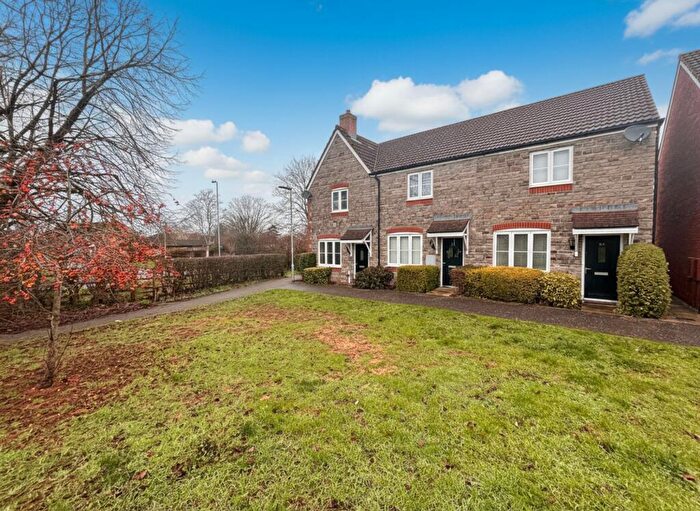
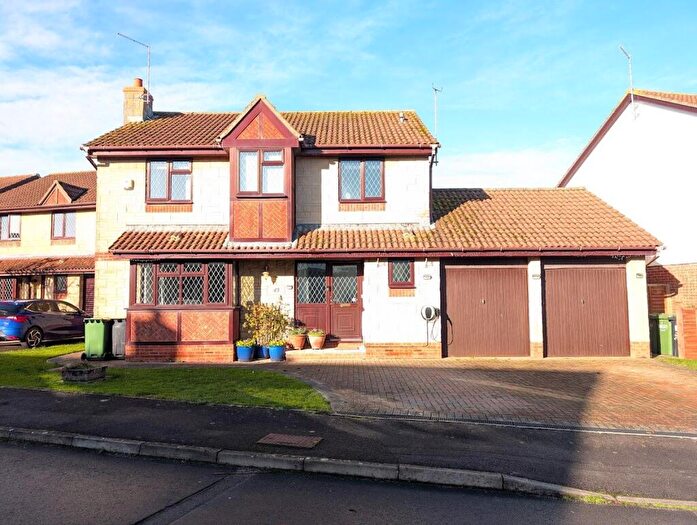
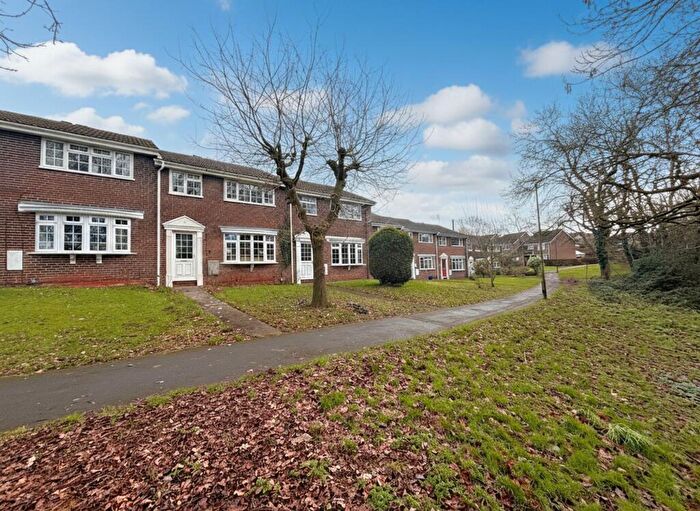
Houses for sale & to rent in Thornbury North, Bristol
House Prices in Thornbury North
Properties in Thornbury North have an average house price of £352,792.00 and had 291 Property Transactions within the last 3 years¹.
Thornbury North is an area in Bristol, South Gloucestershire with 3,136 households², where the most expensive property was sold for £1,362,000.00.
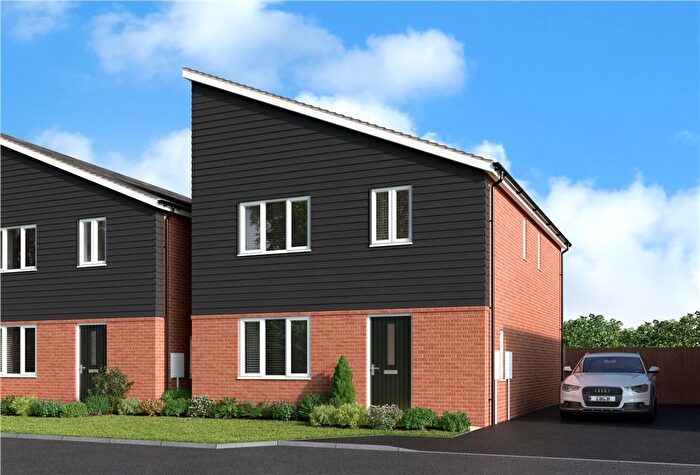
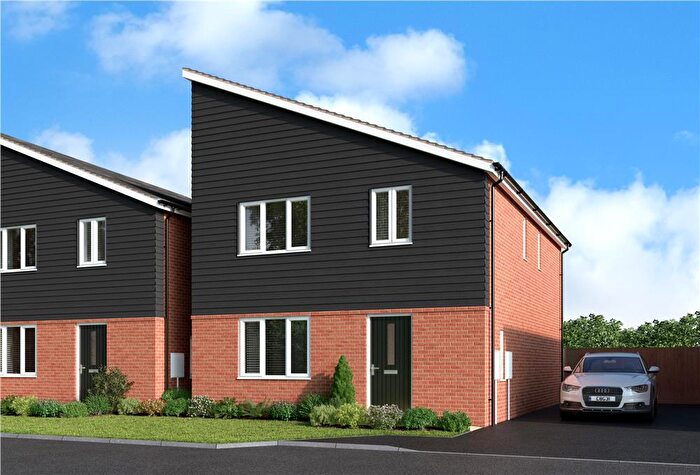
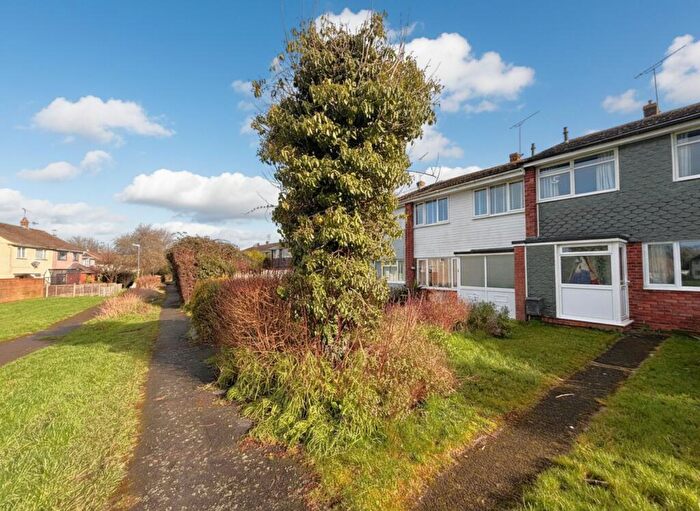
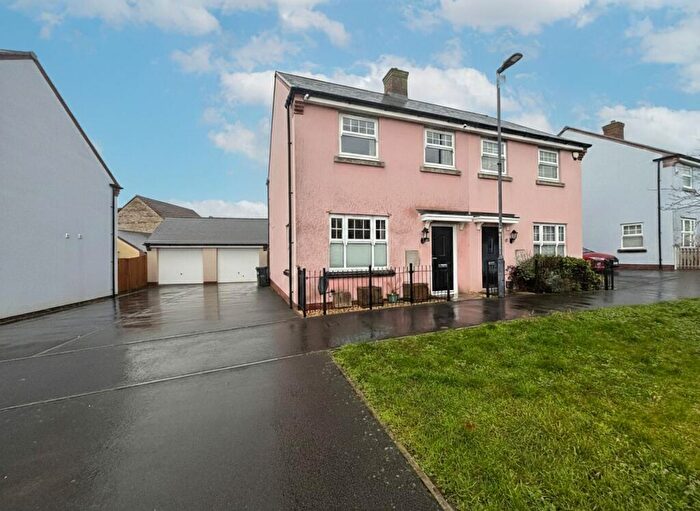
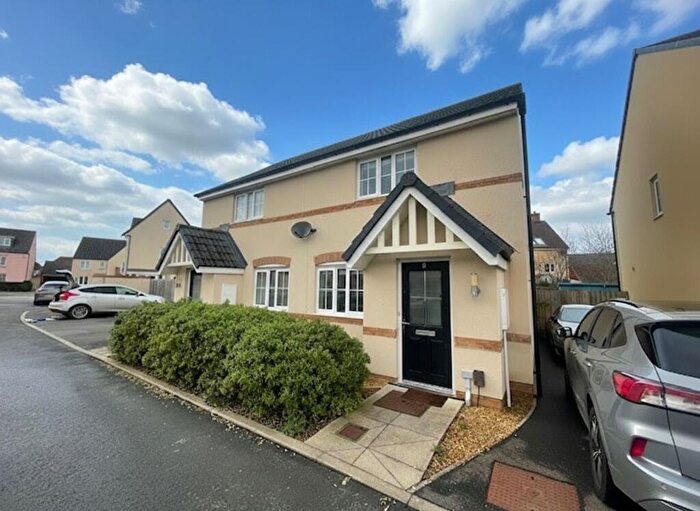
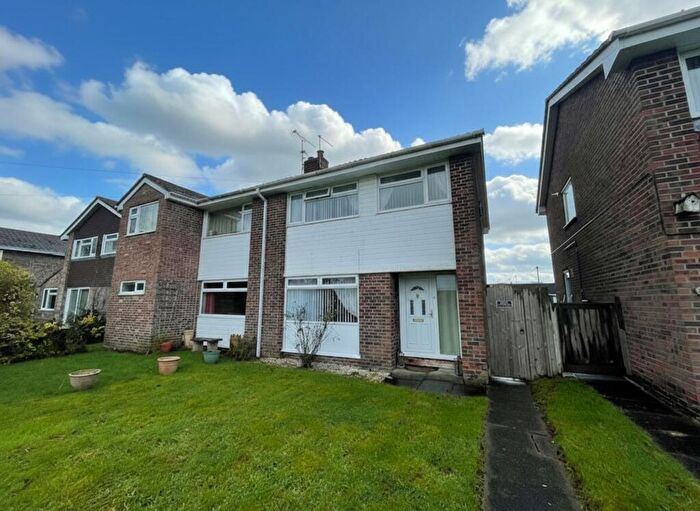
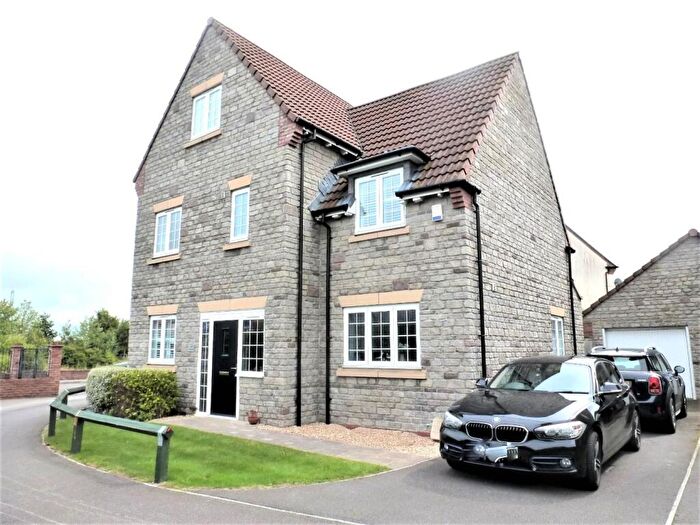
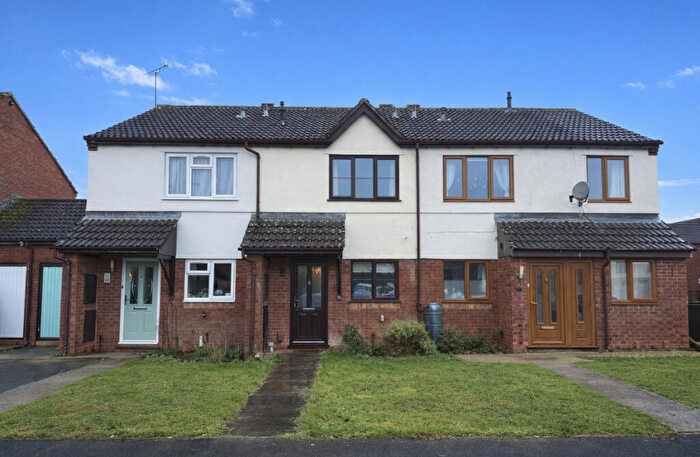
Properties for sale in Thornbury North
Roads and Postcodes in Thornbury North
Navigate through our locations to find the location of your next house in Thornbury North, Bristol for sale or to rent.
| Streets | Postcodes |
|---|---|
| Alexandra Way | BS35 1LA |
| Ashgrove | BS35 2LH BS35 2LJ |
| Beechacres | BS35 1BE |
| Blakes Road | BS35 2JB |
| Bluebell Close | BS35 1UN |
| Buckingham Parade | BS35 1DQ |
| Butt Lane | BS35 1RA |
| Campion Close | BS35 1UF |
| Castle Coombe | BS35 1DD |
| Castle Street | BS35 1HA BS35 1HB BS35 1HQ |
| Celandine Close | BS35 1UB |
| Chantry Road | BS35 1ER |
| Charles Close | BS35 1LL BS35 1LN BS35 1LP BS35 1LW |
| Chatsworth Gardens | BS35 1GZ |
| Chatsworth Park | BS35 1JF |
| Chestnut Drive | BS35 2JG |
| Church Road | BS35 1EJ BS35 1EL BS35 1HJ BS35 1HL |
| Clare Walk | BS35 1EN |
| Clay Lane | BS35 3UA BS35 3UD |
| Colin Close | BS35 2JD |
| Coombe Avenue | BS35 1ET |
| Cossham Close | BS35 1JP |
| Crispin Lane | BS35 2AY |
| Crossways Lane | BS35 3UE |
| Crossways Road | BS35 2YL |
| Davis Court | BS35 1DP |
| Dean Avenue | BS35 1JJ |
| Dyrham Close | BS35 1SU BS35 1SX |
| Eastbury Close | BS35 1DF |
| Eastbury Road | BS35 1DR |
| Eastland Avenue | BS35 1DU BS35 1DX BS35 1DY |
| Eastland Road | BS35 1DS BS35 1DW |
| Easton Hill Road | BS35 1AX BS35 2JU |
| Elmdale Crescent | BS35 2JH BS35 2JQ |
| Falcon Way | BS35 1TA |
| Finch Close | BS35 1TD |
| Foxglove Close | BS35 1UG |
| Fulmar Close | BS35 1TE |
| Gillingstool | BS35 2EG BS35 2EH BS35 2EQ |
| Gloucester Road | BS35 1DG BS35 1DJ BS35 1JG BS35 1JH BS35 1JQ BS35 1JZ |
| Gloucester Terrace | BS35 1DE |
| Hacket Lane | BS35 2HH BS35 3TZ |
| Hawthorn Crescent | BS35 1ED |
| Hazel Crescent | BS35 2LX BS35 2LY |
| High Street | BS35 2AH BS35 2AJ BS35 2AN BS35 2AQ BS35 2AW |
| Hillcrest | BS35 2JA |
| Homefield | BS35 2EW |
| Horseshoe Lane | BS35 2AZ |
| Howard Road | BS35 1JN |
| Hyde Avenue | BS35 1HZ BS35 1JA BS35 1JB |
| Kempton Close | BS35 1SJ BS35 1SL BS35 1SN |
| Kensington Close | BS35 1HU |
| Kestrel Close | BS35 1AZ |
| Kingfisher Close | BS35 1TQ |
| Kington Lane | BS35 1NA |
| Knapp Road | BS35 2HD BS35 2HE BS35 2HF BS35 2HJ BS35 2HQ |
| Larkspur Close | BS35 1UQ |
| Lavender Close | BS35 1UL |
| Lower Morton | BS35 1LD BS35 1LE |
| Mallow Close | BS35 1UE |
| Manor Walk | BS35 1SP BS35 1SW |
| Maple Avenue | BS35 2JW |
| Meadowside | BS35 2EN |
| Millfield | BS35 1JL |
| Morton Street | BS35 1LB |
| Nightingale Close | BS35 1TG |
| North East Road | BS35 1DZ |
| North Road | BS35 1EA BS35 1EB |
| Oakleaze Road | BS35 2LG BS35 2LL BS35 2LN BS35 2LP BS35 2LQ BS35 2LT BS35 2LW |
| Old Gloucester Road | BS35 3UF BS35 3UG |
| Oldbury Lane | BS35 1RD |
| Orchard Avenue | BS35 2LU BS35 2LZ |
| Orchard Grange | BS35 1EW |
| Osprey Park | BS35 1LX BS35 1LY BS35 1LZ |
| Park Road | BS35 1FW BS35 1HN BS35 1HR BS35 1HS BS35 1JS BS35 1JU BS35 1JW |
| Park View Avenue | BS35 1DT |
| Parkland Way | BS35 1SA |
| Pine Close | BS35 2JS |
| Pittville Close | BS35 1SB BS35 1SD BS35 1SE |
| Primrose Drive | BS35 1UA BS35 1UJ BS35 1UP |
| Prowse Close | BS35 1EG |
| Pullins Green | BS35 2AX |
| Quaker Lane | BS35 2AD |
| Queens Walk | BS35 1SR BS35 1SS BS35 1ST |
| Regents Close | BS35 1HX BS35 1HY |
| Rosslyn Way | BS35 1SF BS35 1SG |
| Saw Mill Lane | BS35 2NZ |
| Severn Drive | BS35 1EU BS35 1EX |
| Severn View Road | BS35 1AY BS35 1BA |
| Sibland Way | BS35 2ED BS35 2EJ |
| Sorrel Close | BS35 1UH |
| Speedwell Close | BS35 1UD |
| Springfield | BS35 2EL |
| Squires Leaze | BS35 1TB BS35 1TF BS35 1TH |
| St Davids Road | BS35 2JE BS35 2JF BS35 2JJ BS35 2JL |
| St James Close | BS35 1SH BS35 1SQ |
| St John Street | BS35 2AU |
| St Mary Street | BS35 2AB |
| Stafford Crescent | BS35 1DH |
| Station Close | BS35 2FL |
| Stokefield Close | BS35 1HE |
| Swallow Park | BS35 1LR BS35 1LS BS35 1LT BS35 1LU |
| The Close | BS35 2AL |
| The Paddocks | BS35 2HP |
| The Plain | BS35 2AG |
| Thicket Walk | BS35 2JN |
| Tilting Road | BS35 1EP BS35 1ES |
| Upper Morton | BS35 1LH |
| Victoria Close | BS35 1JD BS35 1JE |
| Walnut Close | BS35 2LS |
| Warwick Place | BS35 1EZ |
| Whitfield Road | BS35 1JR |
| Woodleigh | BS35 2JP BS35 2JR BS35 2JT |
Transport near Thornbury North
-
Pilning Station
-
Yate Station
-
Patchway Station
-
Chepstow Station
-
Bristol Parkway Station
-
Lydney Station
-
Severn Beach Station
-
Filton Abbey Wood Station
-
Cam and Dursley Station
- FAQ
- Price Paid By Year
- Property Type Price
Frequently asked questions about Thornbury North
What is the average price for a property for sale in Thornbury North?
The average price for a property for sale in Thornbury North is £352,792. This amount is 0.22% higher than the average price in Bristol. There are 1,026 property listings for sale in Thornbury North.
What streets have the most expensive properties for sale in Thornbury North?
The streets with the most expensive properties for sale in Thornbury North are Gloucester Road at an average of £811,750, Stokefield Close at an average of £770,000 and Morton Street at an average of £750,000.
What streets have the most affordable properties for sale in Thornbury North?
The streets with the most affordable properties for sale in Thornbury North are Osprey Park at an average of £157,662, Gillingstool at an average of £180,000 and Quaker Lane at an average of £205,714.
Which train stations are available in or near Thornbury North?
Some of the train stations available in or near Thornbury North are Pilning, Yate and Patchway.
Property Price Paid in Thornbury North by Year
The average sold property price by year was:
| Year | Average Sold Price | Price Change |
Sold Properties
|
|---|---|---|---|
| 2025 | £350,379 | -1% |
89 Properties |
| 2024 | £353,321 | -0,3% |
102 Properties |
| 2023 | £354,398 | -12% |
100 Properties |
| 2022 | £396,771 | 18% |
118 Properties |
| 2021 | £323,945 | 1% |
132 Properties |
| 2020 | £319,267 | 3% |
94 Properties |
| 2019 | £309,416 | 1% |
115 Properties |
| 2018 | £307,355 | 7% |
130 Properties |
| 2017 | £287,248 | -2% |
89 Properties |
| 2016 | £293,624 | 11% |
113 Properties |
| 2015 | £259,923 | -3% |
126 Properties |
| 2014 | £268,279 | 7% |
138 Properties |
| 2013 | £248,862 | 7% |
96 Properties |
| 2012 | £231,175 | -4% |
83 Properties |
| 2011 | £239,345 | 4% |
104 Properties |
| 2010 | £230,067 | 5% |
79 Properties |
| 2009 | £218,925 | -0,5% |
98 Properties |
| 2008 | £219,981 | -17% |
75 Properties |
| 2007 | £257,239 | 21% |
139 Properties |
| 2006 | £204,323 | -5% |
163 Properties |
| 2005 | £214,783 | 2% |
118 Properties |
| 2004 | £209,986 | 16% |
123 Properties |
| 2003 | £176,530 | 8% |
125 Properties |
| 2002 | £162,981 | 20% |
143 Properties |
| 2001 | £129,629 | 18% |
197 Properties |
| 2000 | £106,245 | 6% |
166 Properties |
| 1999 | £99,834 | 13% |
165 Properties |
| 1998 | £86,892 | 13% |
150 Properties |
| 1997 | £75,719 | 4% |
151 Properties |
| 1996 | £72,669 | -3% |
187 Properties |
| 1995 | £74,561 | - |
126 Properties |
Property Price per Property Type in Thornbury North
Here you can find historic sold price data in order to help with your property search.
The average Property Paid Price for specific property types in the last three years are:
| Property Type | Average Sold Price | Sold Properties |
|---|---|---|
| Flat | £191,300.00 | 28 Flats |
| Semi Detached House | £336,663.00 | 112 Semi Detached Houses |
| Detached House | £495,868.00 | 78 Detached Houses |
| Terraced House | £286,603.00 | 73 Terraced Houses |

