
Houses for sale & to rent in BS35 2AW, High Street, Thornbury North, Bristol
House Prices in BS35 2AW, High Street, Thornbury North
Properties in BS35 2AW have an average house price of £110,000.00 and had 1 Property Transaction within the last 3 years.¹ BS35 2AW is a postcode in High Street located in Thornbury North, an area in Bristol, South Gloucestershire, with 6 households², where the most expensive property was sold for £110,000.00.
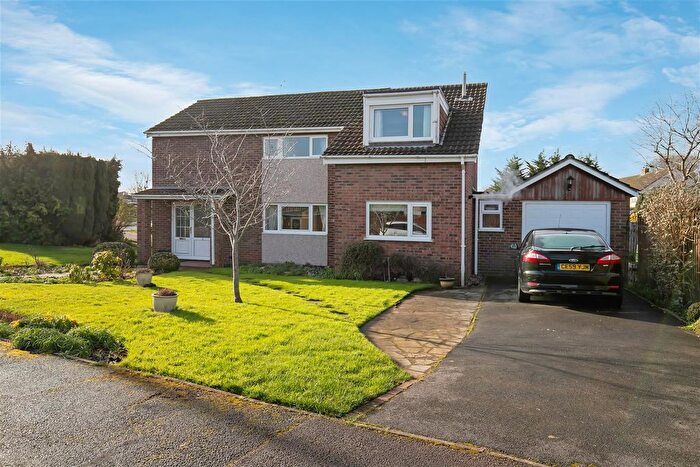
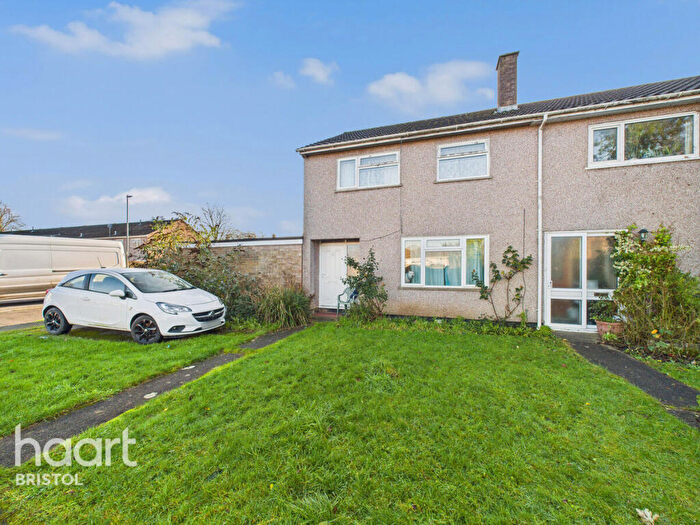
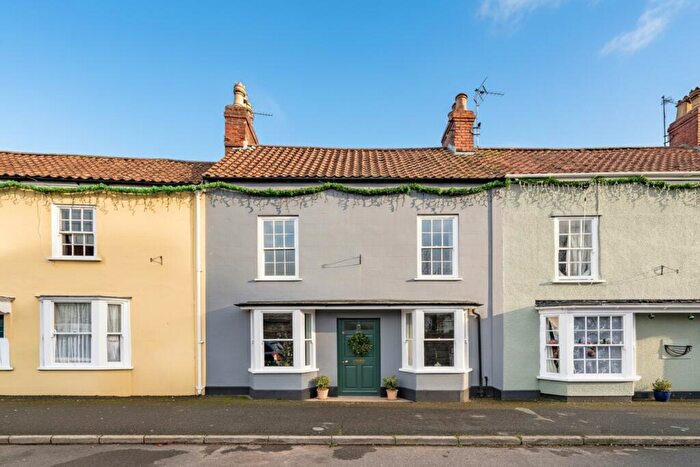
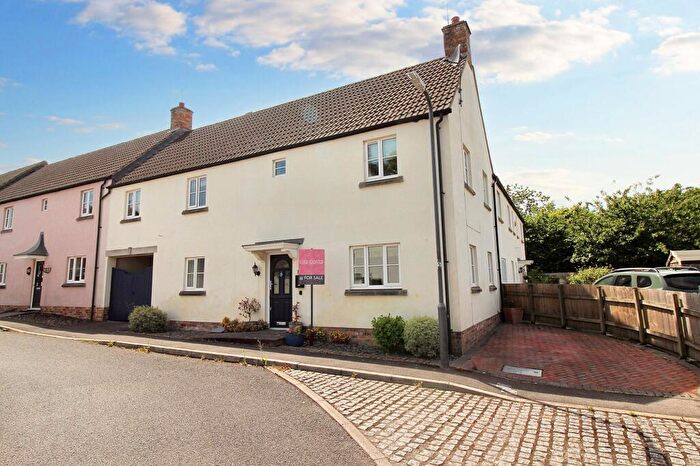
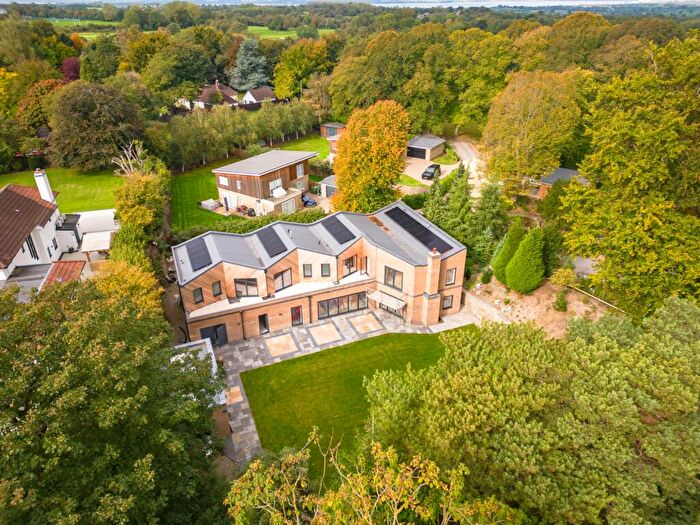
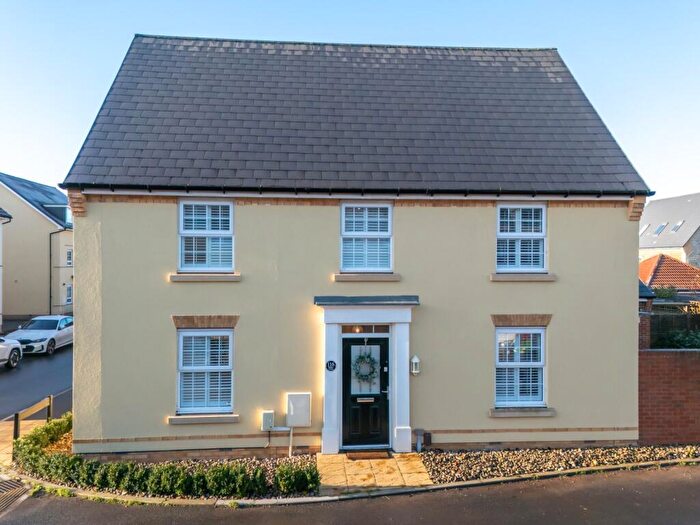
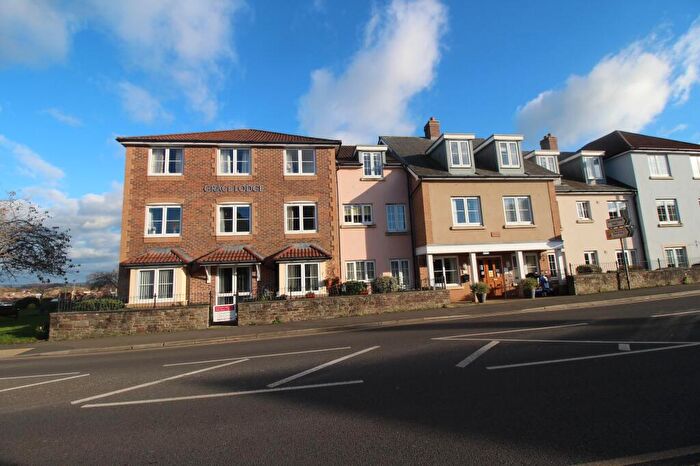
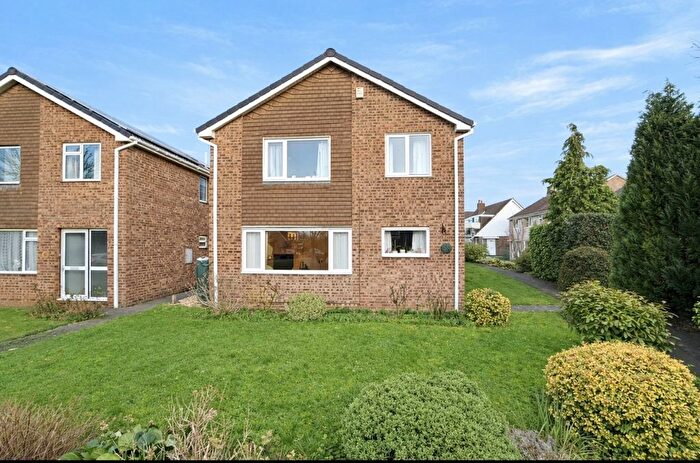
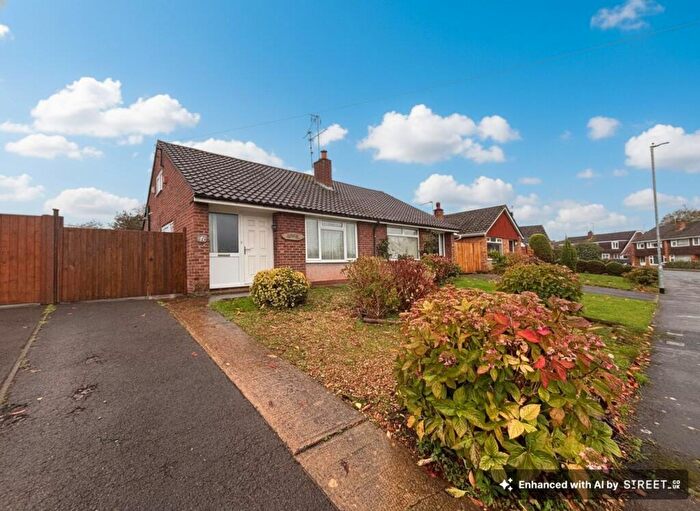
Properties for sale near BS35 2AW, High Street

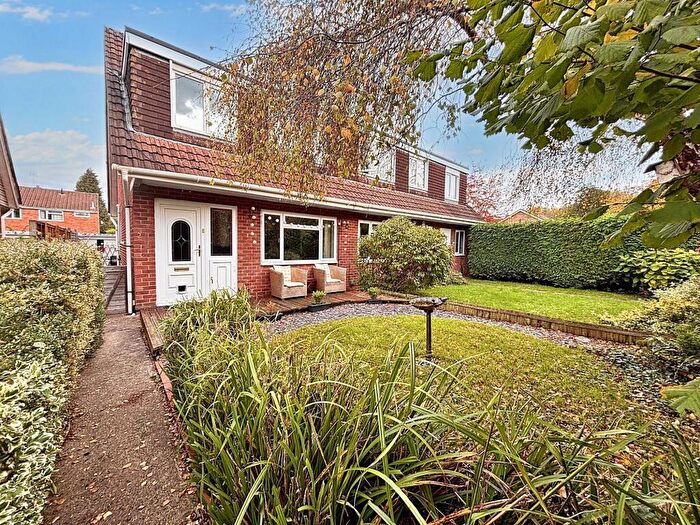
![]()
If you are looking to sell your house, let it out, or receive a property valuation, an expert can help you.
Click the button below to get started.


Price Paid in High Street, BS35 2AW, Thornbury North
SAISE COTTAGE High Street, BS35 2AW, Thornbury North Bristol
Property SAISE COTTAGE has been sold 1 time. The last time it was sold was in 30/09/2024 and the sold price was £110,000.00.
This is a Terraced House which was sold as a freehold in 30/09/2024
| Date | Price | Property Type | Tenure | Classification |
|---|---|---|---|---|
| 30/09/2024 | £110,000.00 | Terraced House | freehold | Established Building |
71 High Street, BS35 2AW, Thornbury North Bristol
Property 71 has been sold 3 times. The last time it was sold was in 12/03/2021 and the sold price was £500,000.00.
This is a Terraced House which was sold as a freehold in 12/03/2021
| Date | Price | Property Type | Tenure | Classification |
|---|---|---|---|---|
| 12/03/2021 | £500,000.00 | Terraced House | freehold | Established Building |
| 23/05/2003 | £375,000.00 | Terraced House | freehold | Established Building |
| 28/11/1996 | £147,000.00 | Terraced House | freehold | Established Building |
73 High Street, BS35 2AW, Thornbury North Bristol
Property 73 has been sold 2 times. The last time it was sold was in 17/08/2018 and the sold price was £585,000.00.
This terraced house, sold as a freehold on 17/08/2018, is a 173 sqm mid-terrace house with an EPC rating of C.
| Date | Price | Property Type | Tenure | Classification |
|---|---|---|---|---|
| 17/08/2018 | £585,000.00 | Terraced House | freehold | Established Building |
| 24/09/2007 | £315,000.00 | Terraced House | freehold | Established Building |
79 High Street, BS35 2AW, Thornbury North Bristol
Property 79 has been sold 1 time. The last time it was sold was in 15/12/2016 and the sold price was £515,000.00.
This is a Terraced House which was sold as a freehold in 15/12/2016
| Date | Price | Property Type | Tenure | Classification |
|---|---|---|---|---|
| 15/12/2016 | £515,000.00 | Terraced House | freehold | Established Building |
81 High Street, BS35 2AW, Thornbury North Bristol
Property 81 has been sold 4 times. The last time it was sold was in 14/04/2014 and the sold price was £433,500.00.
This semi detached house, sold as a freehold on 14/04/2014, is a 170 sqm end-terrace house with an EPC rating of D.
| Date | Price | Property Type | Tenure | Classification |
|---|---|---|---|---|
| 14/04/2014 | £433,500.00 | Semi Detached House | freehold | Established Building |
| 16/10/2009 | £411,000.00 | Semi Detached House | freehold | Established Building |
| 30/11/1999 | £170,000.00 | Semi Detached House | freehold | Established Building |
| 13/07/1995 | £106,870.00 | Semi Detached House | freehold | Established Building |
77 High Street, BS35 2AW, Thornbury North Bristol
Property 77 has been sold 1 time. The last time it was sold was in 07/12/2009 and the sold price was £185,000.00.
This terraced house, sold as a freehold on 07/12/2009, is a 204 sqm mid-terrace house with an EPC rating of D.
| Date | Price | Property Type | Tenure | Classification |
|---|---|---|---|---|
| 07/12/2009 | £185,000.00 | Terraced House | freehold | Established Building |
69 High Street, BS35 2AW, Thornbury North Bristol
Property 69 has been sold 1 time. The last time it was sold was in 05/05/2006 and the sold price was £234,000.00.
This is a Detached House which was sold as a freehold in 05/05/2006
| Date | Price | Property Type | Tenure | Classification |
|---|---|---|---|---|
| 05/05/2006 | £234,000.00 | Detached House | freehold | Established Building |
Postcodes in High Street, Thornbury North
Navigate through other locations in High Street, Thornbury North, Bristol to see more property listings for sale or to rent.
Transport near BS35 2AW, High Street
-
 Pilning Station
 -
Patchway Station
-
Yate Station
-
Bristol Parkway Station
-
Chepstow Station
-
Severn Beach Station
-
Filton Abbey Wood Station
-
Lydney Station
-
Stapleton Road Station
-
St.Andrew's Road Station
House price paid reports for BS35 2AW, High Street
Click on the buttons below to see price paid reports by year or property price:
- Price Paid By Year
- Property Type Price
Property Price Paid in BS35 2AW, High Street by Year
The average sold property price by year was:
| Year | Average Sold Price | Price Change |
Sold Properties
|
|---|---|---|---|
| 2024 | £110,000 | -355% |
1 Property |
| 2021 | £500,000 | -17% |
1 Property |
| 2018 | £585,000 | 12% |
1 Property |
| 2016 | £515,000 | 16% |
1 Property |
| 2014 | £433,500 | 31% |
1 Property |
| 2009 | £298,000 | -6% |
2 Properties |
| 2007 | £315,000 | 26% |
1 Property |
| 2006 | £234,000 | -60% |
1 Property |
| 2003 | £375,000 | 55% |
1 Property |
| 1999 | £170,000 | 14% |
1 Property |
| 1996 | £147,000 | 27% |
1 Property |
| 1995 | £106,870 | - |
1 Property |
Property Price per Property Type in BS35 2AW, High Street
Here you can find historic sold price data in order to help with your property search.
The average Property Paid Price for specific property types in the last three years are:
| Property Type | Average Sold Price | Sold Properties |
|---|---|---|
| Terraced House | £110,000.00 | 1 Terraced House |