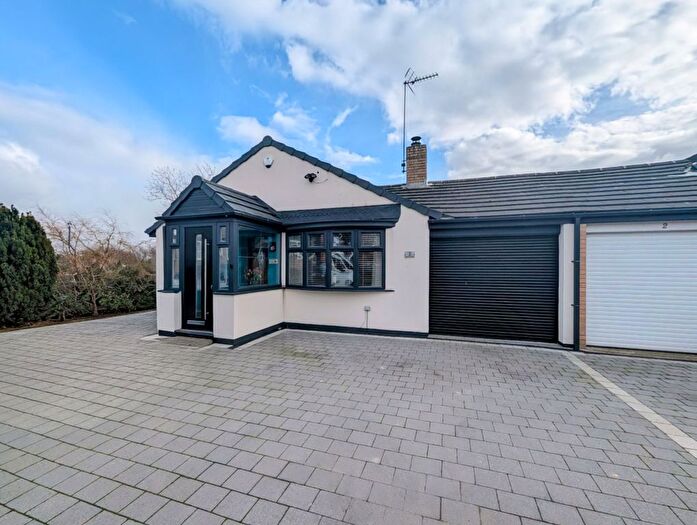
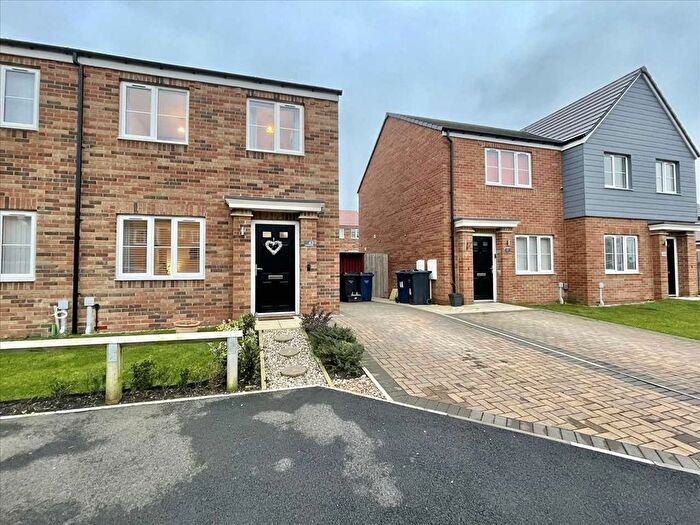
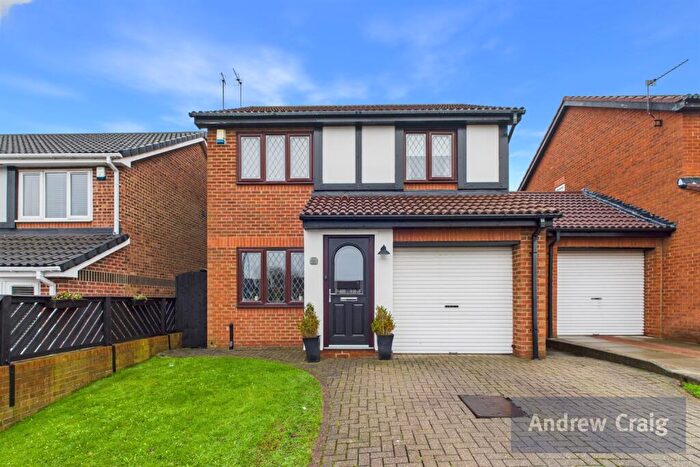
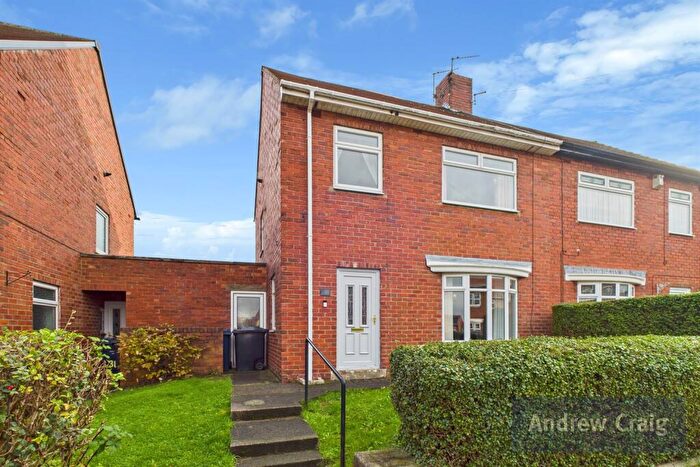
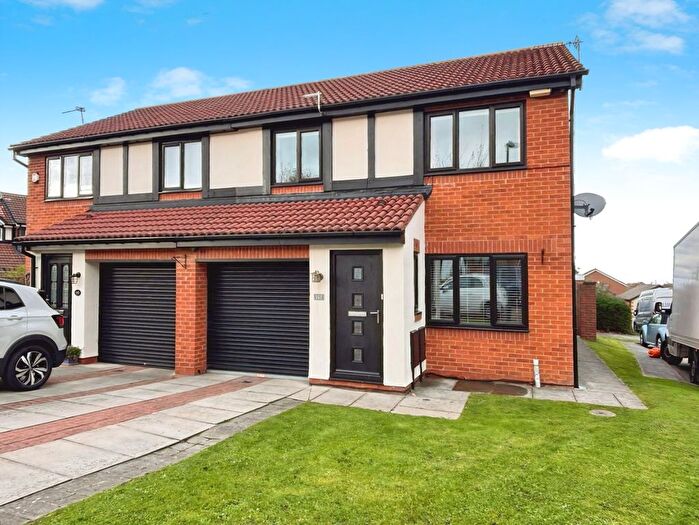
Houses for sale & to rent in Whitburn And Marsden, South Shields
House Prices in Whitburn And Marsden
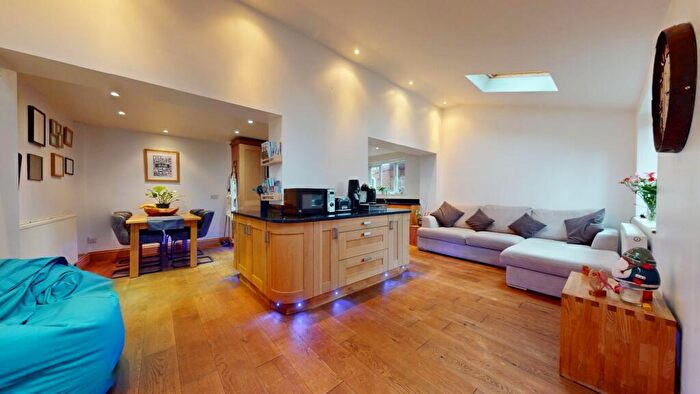
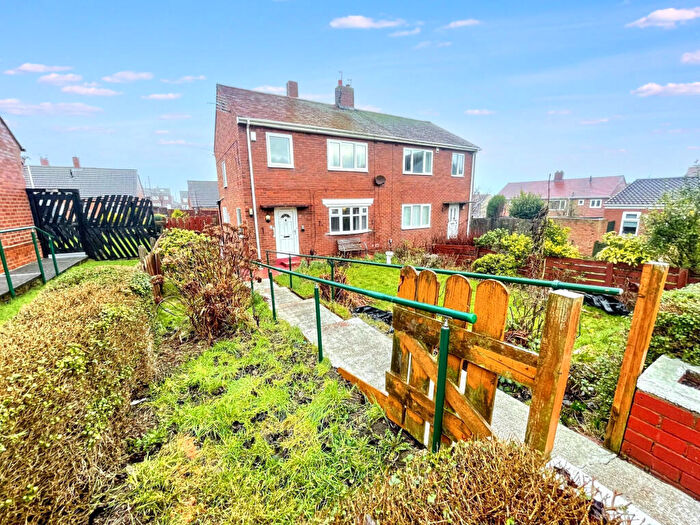
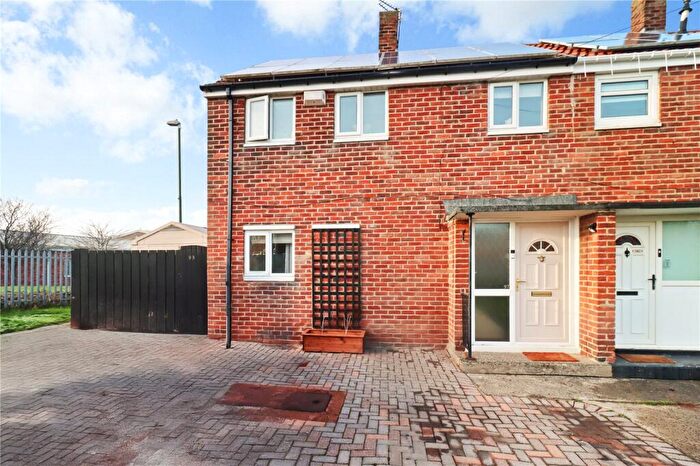
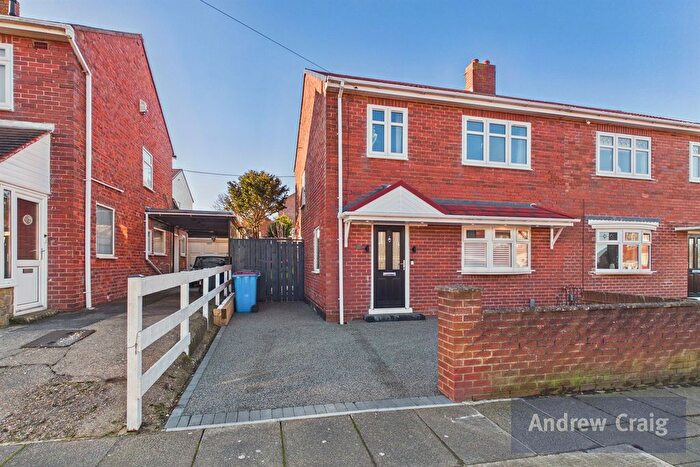
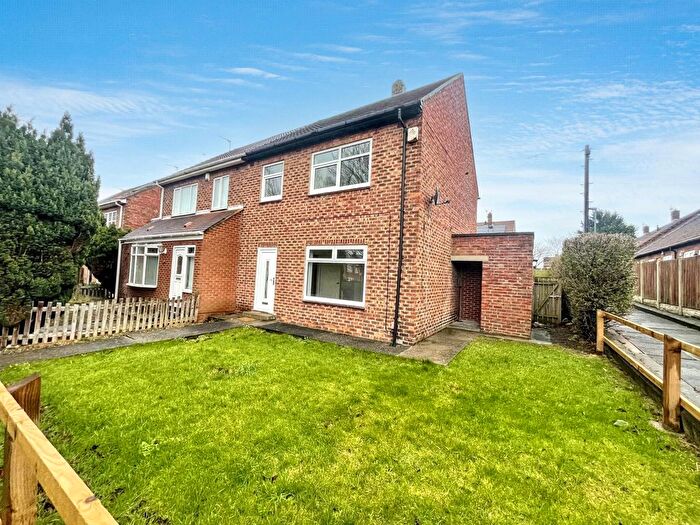
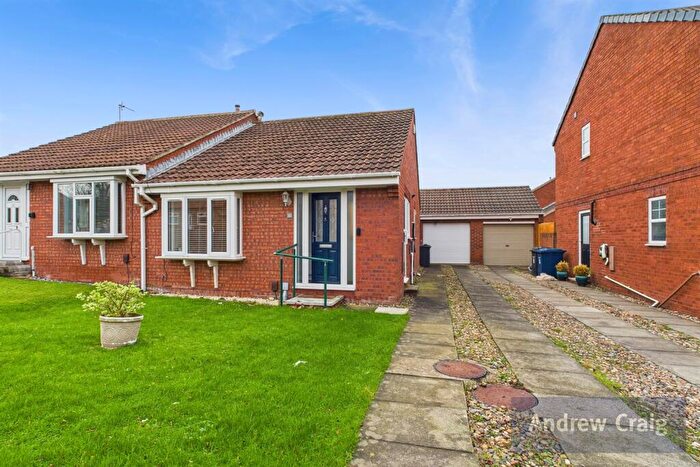
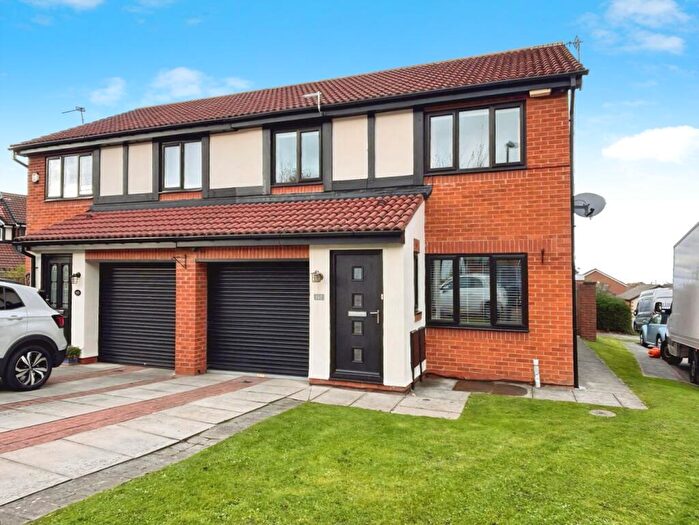
Properties in Whitburn And Marsden have an average house price of £216,654.00 and had 62 Property Transactions within the last 3 years¹.
Whitburn And Marsden is an area in South Shields, South Tyneside with 906 households², where the most expensive property was sold for £354,950.00.
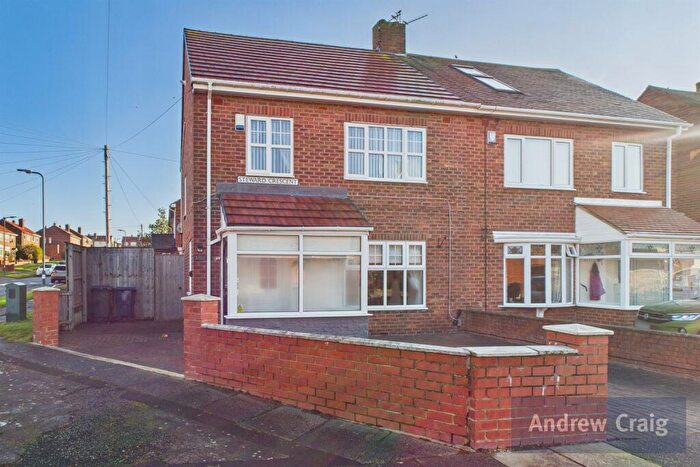
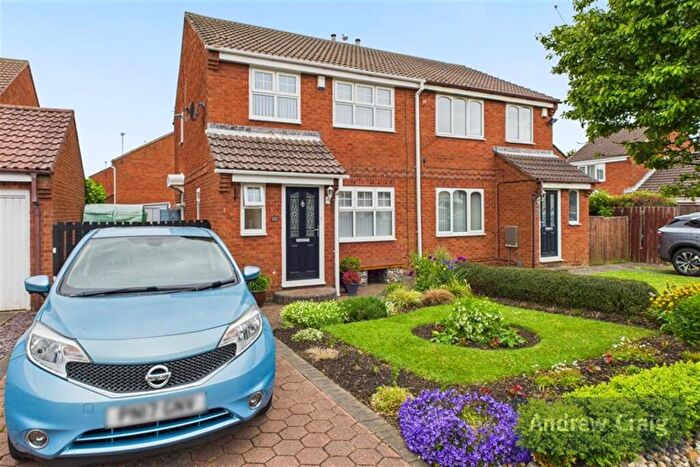
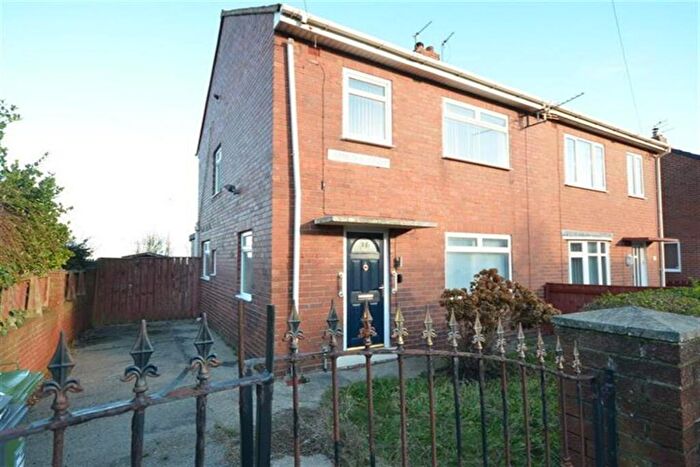
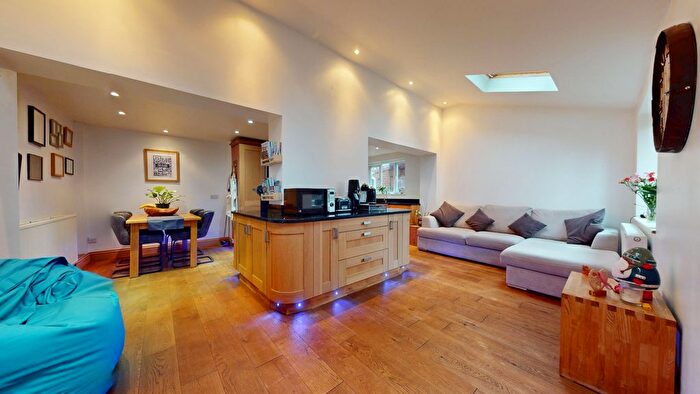
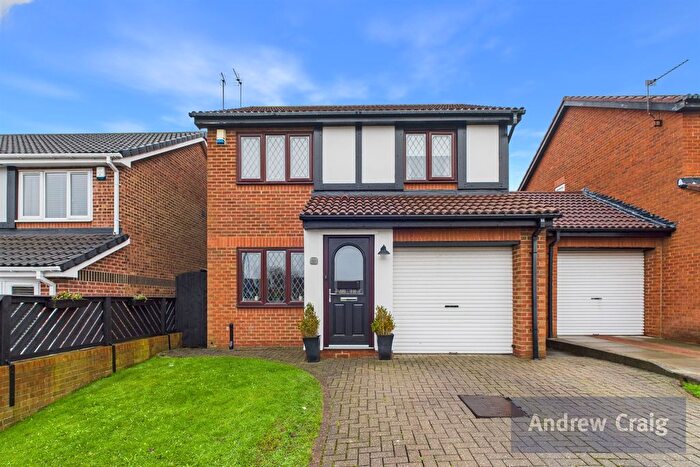
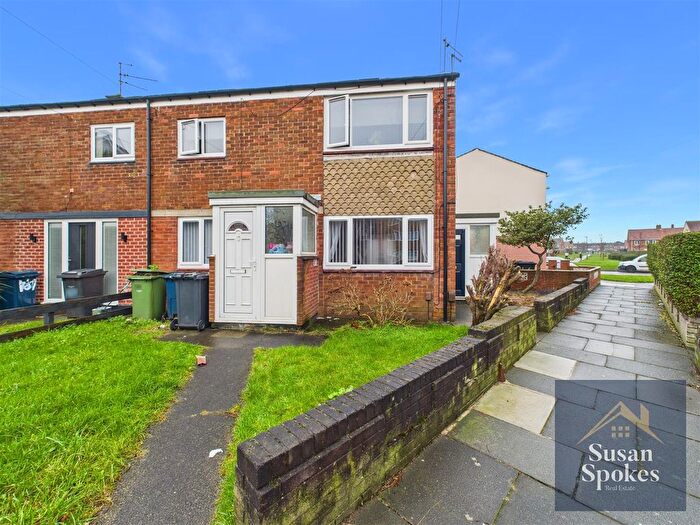
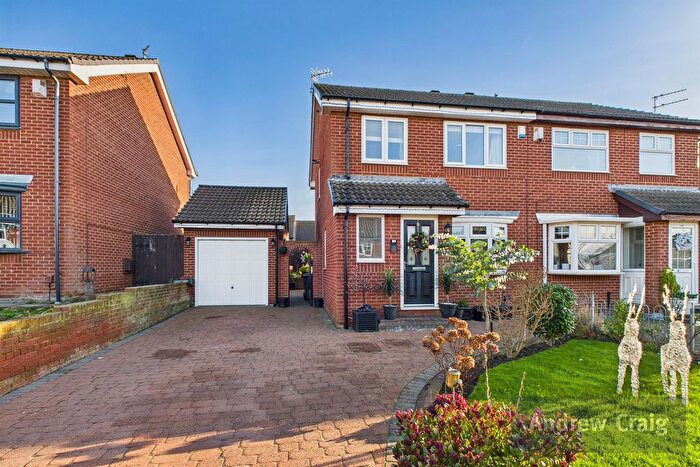
Properties for sale in Whitburn And Marsden
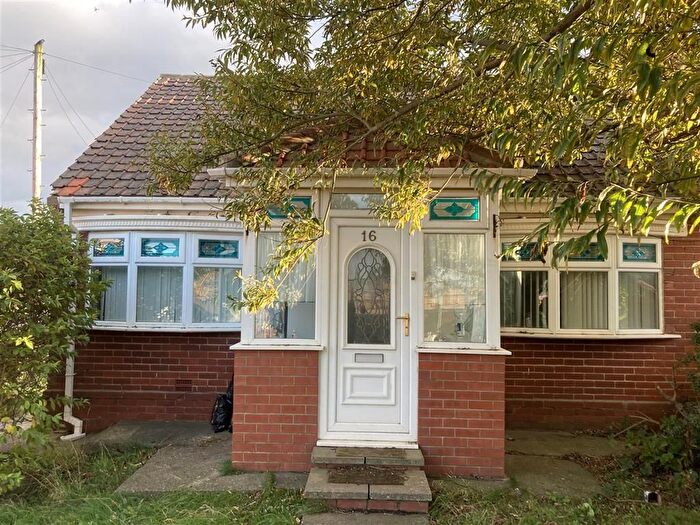
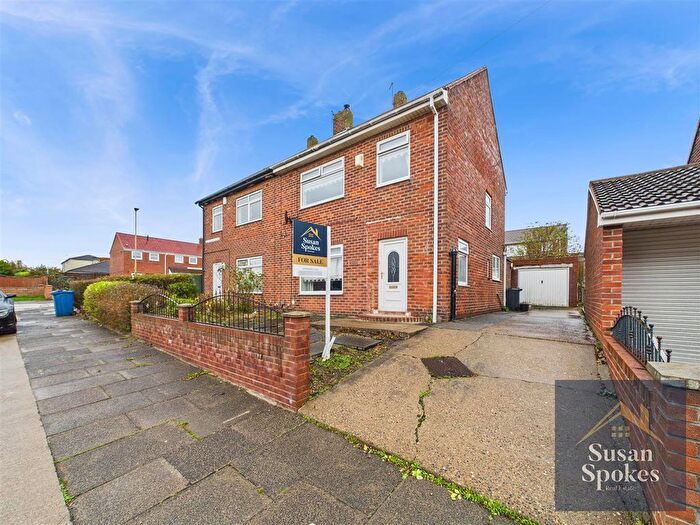
Previously listed properties in Whitburn And Marsden
Roads and Postcodes in Whitburn And Marsden
Navigate through our locations to find the location of your next house in Whitburn And Marsden, South Shields for sale or to rent.
| Streets | Postcodes |
|---|---|
| Beacon Glade | NE34 7PS NE34 7QU |
| Beaconside | NE34 7PT NE34 7PU NE34 7PX NE34 7PY |
| Cliffside | NE34 7EZ |
| Coast Road | NE34 7BS |
| Fallow Road | NE34 7AG |
| Farding Lake Court | NE34 7BT NE34 7BU |
| Farding Square | NE34 7AZ NE34 7BA NE34 7BB |
| Green Hill Walk | NE34 7EY |
| Grotto Gardens | NE34 7AJ |
| Grotto Road | NE34 7AH NE34 7AL NE34 7AQ |
| Lake Avenue | NE34 7AU NE34 7AX NE34 7AY |
| Lake Shore Road | NE34 7AS |
| Lakeside | NE34 7HA |
| Lizard Lane | NE34 7AA NE34 7AD NE34 7AE NE34 7AN NE34 7AP NE34 7AW NE34 7AB NE34 7AF |
| Prince Edward Road | NE34 7BG NE34 7BQ |
| Quarry Lane | NE34 7AR |
| Redwell Lane | NE34 7JS |
| Valley Lane | NE34 7AT |
| White Horse View | NE34 7EX |
Transport near Whitburn And Marsden
- FAQ
- Price Paid By Year
- Property Type Price
Frequently asked questions about Whitburn And Marsden
What is the average price for a property for sale in Whitburn And Marsden?
The average price for a property for sale in Whitburn And Marsden is £216,654. This amount is 42% higher than the average price in South Shields. There are 338 property listings for sale in Whitburn And Marsden.
What streets have the most expensive properties for sale in Whitburn And Marsden?
The streets with the most expensive properties for sale in Whitburn And Marsden are Fallow Road at an average of £277,500, Beacon Glade at an average of £273,383 and Beaconside at an average of £244,441.
What streets have the most affordable properties for sale in Whitburn And Marsden?
The streets with the most affordable properties for sale in Whitburn And Marsden are Quarry Lane at an average of £158,250, Grotto Gardens at an average of £160,462 and Prince Edward Road at an average of £161,500.
Which train stations are available in or near Whitburn And Marsden?
Some of the train stations available in or near Whitburn And Marsden are Sunderland, Heworth and Manors.
Property Price Paid in Whitburn And Marsden by Year
The average sold property price by year was:
| Year | Average Sold Price | Price Change |
Sold Properties
|
|---|---|---|---|
| 2025 | £223,628 | 1% |
23 Properties |
| 2024 | £220,295 | 9% |
24 Properties |
| 2023 | £200,133 | -0,1% |
15 Properties |
| 2022 | £200,372 | -8% |
28 Properties |
| 2021 | £217,036 | 8% |
19 Properties |
| 2020 | £199,861 | 22% |
18 Properties |
| 2019 | £154,922 | -12% |
20 Properties |
| 2018 | £174,122 | 5% |
20 Properties |
| 2017 | £165,947 | -11% |
22 Properties |
| 2016 | £183,474 | 10% |
25 Properties |
| 2015 | £164,945 | 10% |
24 Properties |
| 2014 | £148,068 | 10% |
28 Properties |
| 2013 | £132,905 | -3% |
22 Properties |
| 2012 | £137,047 | 9% |
21 Properties |
| 2011 | £125,328 | -1% |
20 Properties |
| 2010 | £126,145 | -28% |
12 Properties |
| 2009 | £161,629 | 1% |
27 Properties |
| 2008 | £159,614 | -7% |
20 Properties |
| 2007 | £170,460 | 5% |
33 Properties |
| 2006 | £161,644 | -20% |
35 Properties |
| 2005 | £193,789 | 23% |
29 Properties |
| 2004 | £149,317 | 20% |
34 Properties |
| 2003 | £119,293 | 25% |
49 Properties |
| 2002 | £89,097 | 10% |
52 Properties |
| 2001 | £79,957 | 12% |
51 Properties |
| 2000 | £70,346 | -1% |
31 Properties |
| 1999 | £71,373 | 3% |
41 Properties |
| 1998 | £69,294 | -1% |
46 Properties |
| 1997 | £69,905 | 1% |
74 Properties |
| 1996 | £69,192 | 5% |
78 Properties |
| 1995 | £65,641 | - |
55 Properties |
Property Price per Property Type in Whitburn And Marsden
Here you can find historic sold price data in order to help with your property search.
The average Property Paid Price for specific property types in the last three years are:
| Property Type | Average Sold Price | Sold Properties |
|---|---|---|
| Semi Detached House | £202,293.00 | 39 Semi Detached Houses |
| Terraced House | £181,270.00 | 10 Terraced Houses |
| Detached House | £286,953.00 | 13 Detached Houses |

