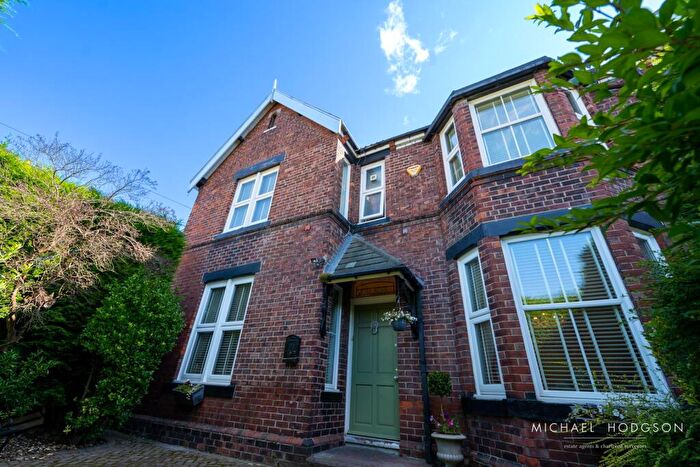
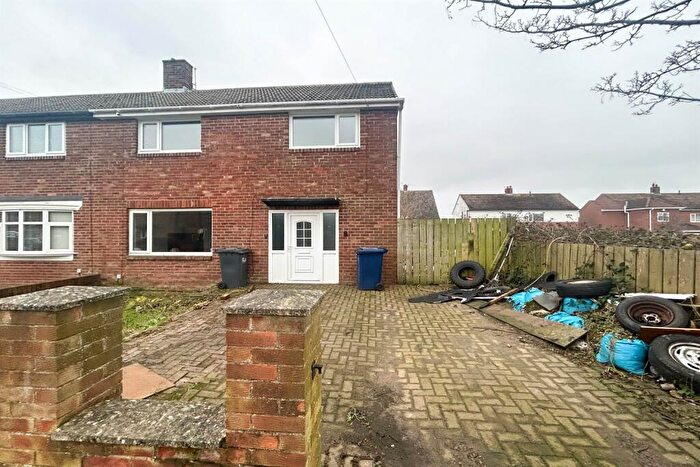
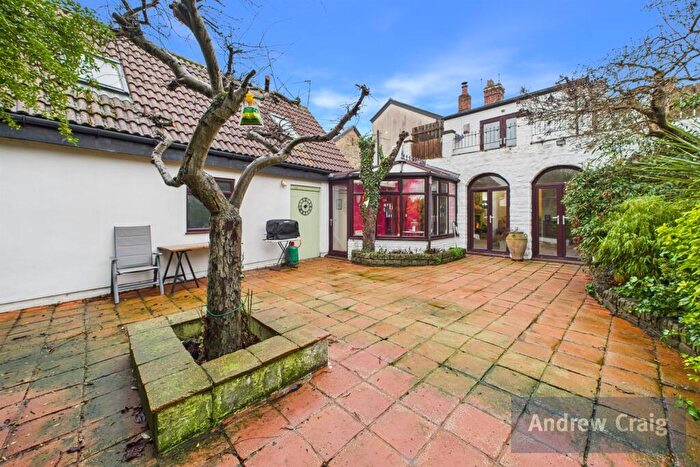
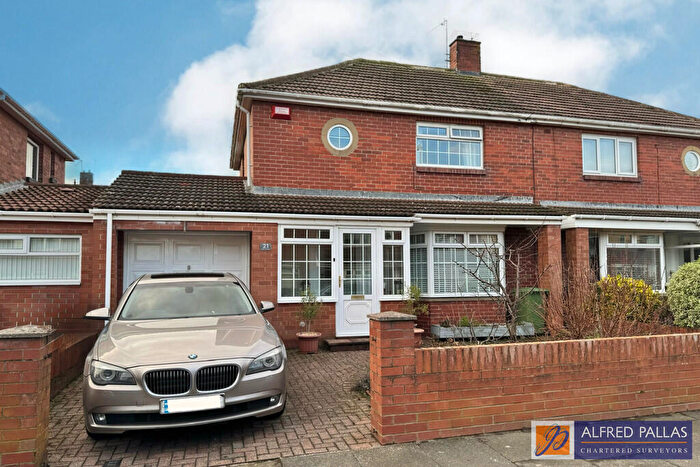
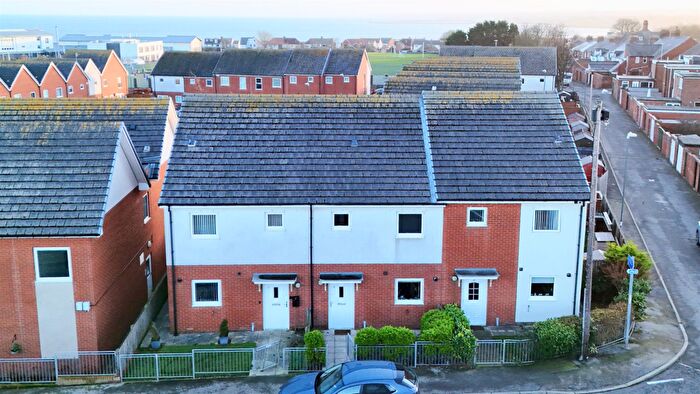
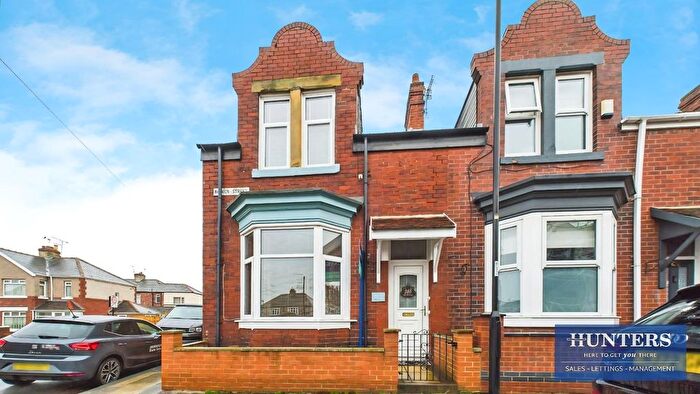
Houses for sale & to rent in Whitburn And Marsden, Sunderland
House Prices in Whitburn And Marsden
Properties in Whitburn And Marsden have an average house price of £245,026.00 and had 209 Property Transactions within the last 3 years¹.
Whitburn And Marsden is an area in Sunderland, South Tyneside with 2,367 households², where the most expensive property was sold for £1,350,000.00.
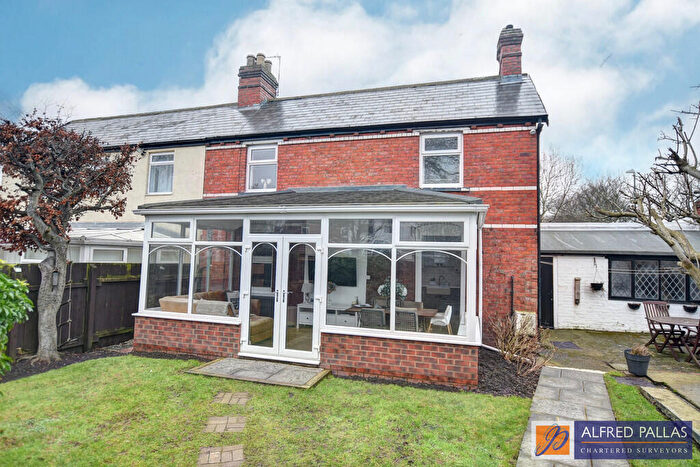
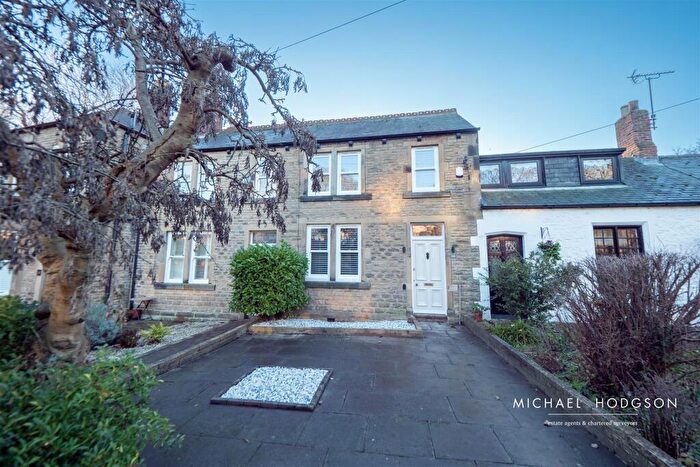
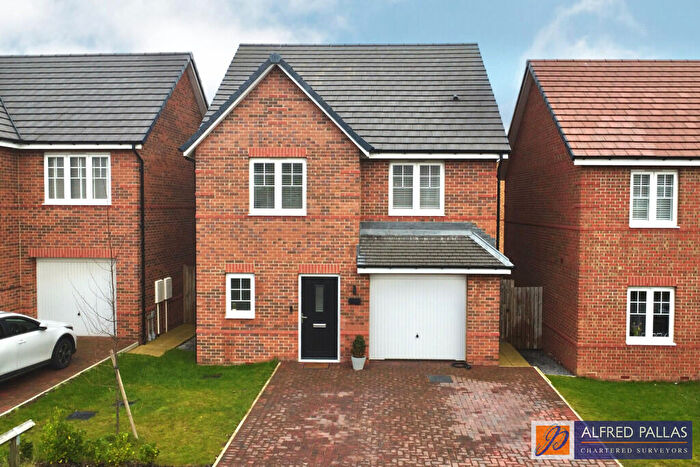
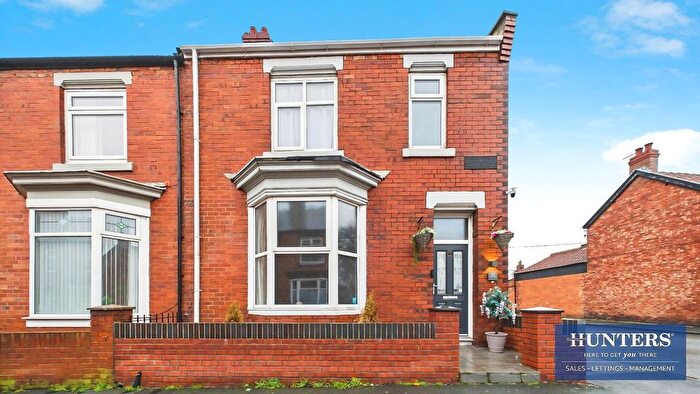
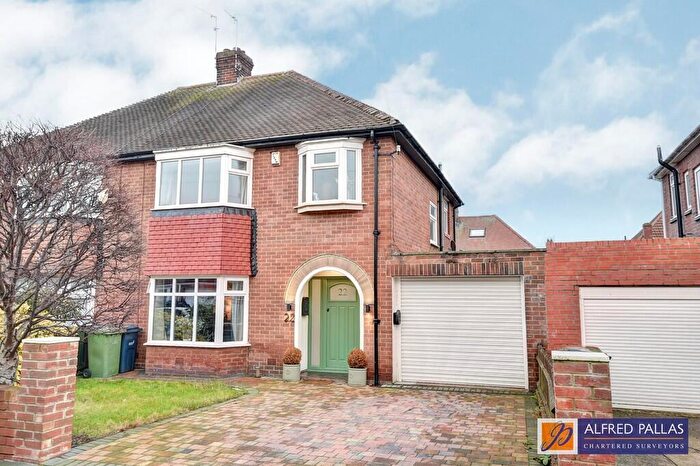
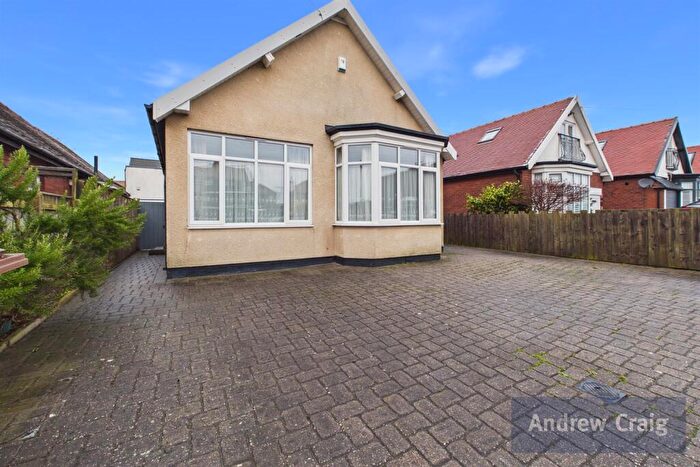
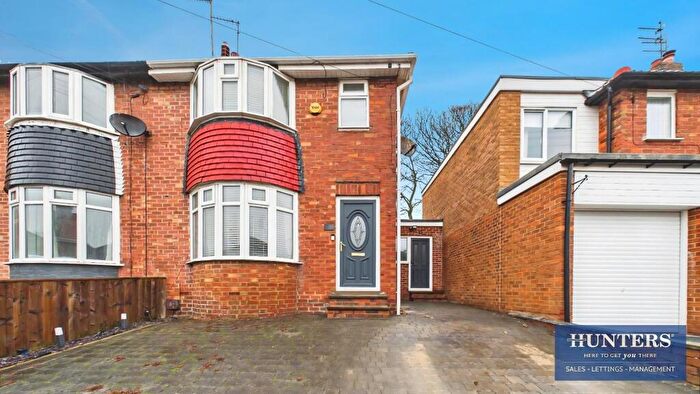
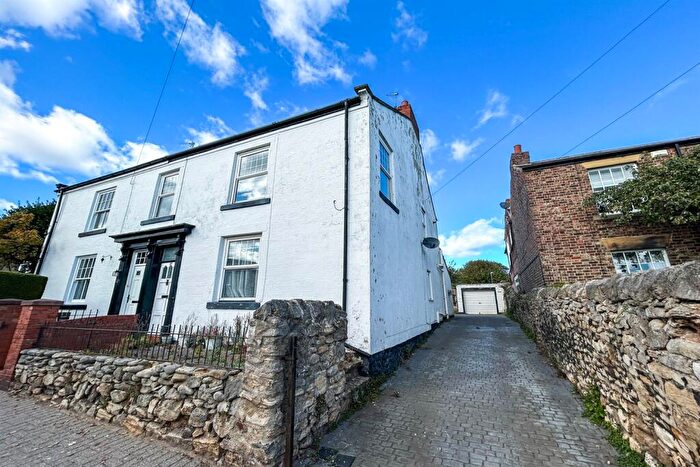
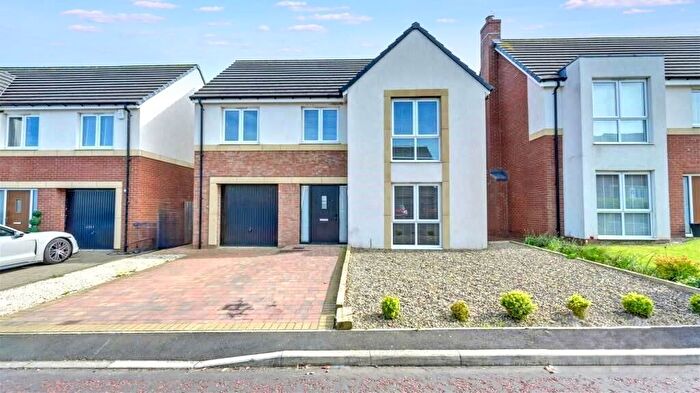
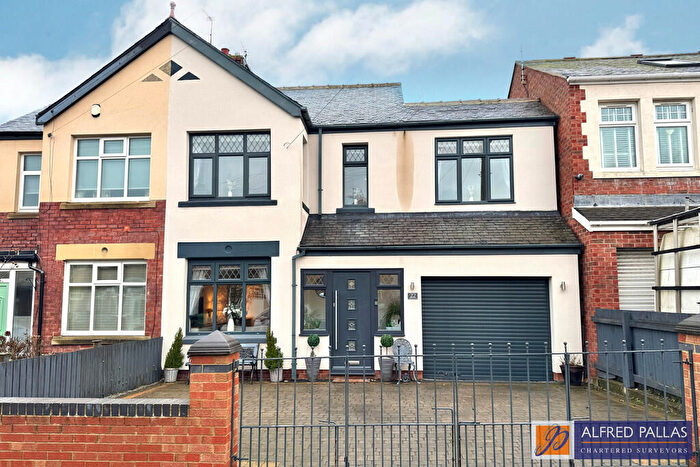
Properties for sale in Whitburn And Marsden
Roads and Postcodes in Whitburn And Marsden
Navigate through our locations to find the location of your next house in Whitburn And Marsden, Sunderland for sale or to rent.
| Streets | Postcodes |
|---|---|
| Adolphus Street | SR6 7DJ SR6 7DL |
| Arthur Street | SR6 7NE |
| Arthur Terrace | SR6 7LX |
| Ash Grove | SR6 7DU |
| Augusta Terrace | SR6 7ET |
| Beech Avenue | SR6 7FE |
| Beech Court | SR6 7JH |
| Birch Avenue | SR6 7AR |
| Bowman Street | SR6 7AA |
| Bryers Street | SR6 7EE |
| Buckingham Close | SR6 7AX |
| Cedar Grove | SR6 7BB SR6 7BD |
| Central Avenue | SR6 7LB |
| Church Lane | SR6 7JL SR6 7JN |
| Cleadon Lane | SR6 7JY SR6 7NS SR6 7UY |
| Coast Road | SR6 7NH SR6 7NJ |
| Cornthwaite Drive | SR6 7AQ |
| Croftside Avenue | SR6 7AU SR6 7BT |
| East Fields | SR6 7DA |
| East Street | SR6 7BX SR6 7BY SR6 7BZ |
| Elders Walk | SR6 7EY |
| Elm Drive | SR6 7DT |
| Fairfield Drive | SR6 7HE |
| Farrow Drive | SR6 7BQ |
| Fern Avenue | SR6 7HT |
| Field Side | SR6 7LA |
| Frederick Terrace | SR6 7EP |
| Front Street | SR6 7JB SR6 7JD SR6 7JE SR6 7JF |
| Fulmar Walk | SR6 7BW |
| Geoffrey Street | SR6 7AT SR6 7AY |
| Hall View | SR6 7DQ |
| Hedworth Terrace | SR6 7EN |
| Highcroft Drive | SR6 7AN |
| Highcroft Park | SR6 7BL |
| Hill Top View | SR6 7HF |
| Hillside Drive | SR6 7LF |
| Larch Avenue | SR6 7DS |
| Lighthouse View | SR6 7NQ |
| Lilac Avenue | SR6 7HL |
| Lily Crescent | SR6 7HN |
| Lindsay Court | SR6 7LN |
| Lizard Lane | SR6 7AH SR6 7AL SR6 7NN SR6 7NW |
| Lizard View | SR6 7HG |
| Maple Grove | SR6 7AP |
| Marina Terrace | SR6 7DH |
| Markham Avenue | SR6 7DE |
| Marsden Avenue | SR6 7HW |
| Marsden Grove | SR6 7AJ |
| Marsden View | SR6 7LY |
| May Grove | SR6 7HP |
| Mill Lane | SR6 7HA SR6 7LS SR6 7LT SR6 7NF SR6 7EL SR6 7ER SR6 7EU SR6 7HJ SR6 7LZ |
| Millfield Terrace | SR6 7HB SR6 7HH |
| Moor Court | SR6 7JU |
| Moor Lane | SR6 7JT SR6 7JP |
| Moor View | SR6 7LD |
| Myrtle Avenue | SR6 7FB SR6 7FF |
| Newark Drive | SR6 7DF |
| Nicholas Avenue | SR6 7DB SR6 7DG |
| North Guards | SR6 7AD SR6 7AE SR6 7AF SR6 7BU SR6 7EJ |
| Oak Crescent | SR6 7DR SR6 7DX SR6 7DY |
| Orchard Gardens | SR6 7JW |
| Parry Drive | SR6 7BE SR6 7BG |
| Percy Terrace | SR6 7EW |
| Poplar Drive | SR6 7AS |
| Rackly Way | SR6 7FD SR6 7EF |
| Range View | SR6 7FA |
| Range Villas | SR6 7ES |
| Redhill | SR6 7JX |
| Robinson Gardens | SR6 7AB |
| Rose Crescent | SR6 7HR SR6 7HS |
| Rupert Street | SR6 7AZ SR6 7BA |
| Sandy Chare | SR6 7JZ |
| Sea View Park | SR6 7JS |
| Shearwater | SR6 7SF SR6 7SG |
| Souter View | SR6 7HU SR6 7HX SR6 7HY SR6 7HZ |
| South View | SR6 7LU |
| Stafford Lane | SR6 7BN |
| Sunderland Road | SR6 7UN |
| Sycamore Road | SR6 7AW |
| The Lawns | SR6 7JJ |
| The Leas | SR6 7EZ |
| Thill Stone Mews | SR6 7BF |
| Wellands Close | SR6 7LJ |
| Wellands Court | SR6 7LG |
| Wellands Drive | SR6 7LH SR6 7LQ |
| Wellands Lane | SR6 7AG SR6 7BH SR6 7BJ SR6 7NP SR6 7NR |
| West Avenue | SR6 7LE |
| Westcroft | SR6 7BP |
| Wheatall Drive | SR6 7HD SR6 7HQ |
| Whitburn Bents Road | SR6 7NT |
| Whiterocks Grove | SR6 7LL |
| Woodlands Grove | SR6 7BS |
| SR6 7JQ |
Transport near Whitburn And Marsden
- FAQ
- Price Paid By Year
- Property Type Price
Frequently asked questions about Whitburn And Marsden
What is the average price for a property for sale in Whitburn And Marsden?
The average price for a property for sale in Whitburn And Marsden is £245,026. This amount is 21% lower than the average price in Sunderland. There are 677 property listings for sale in Whitburn And Marsden.
What streets have the most expensive properties for sale in Whitburn And Marsden?
The streets with the most expensive properties for sale in Whitburn And Marsden are Markham Avenue at an average of £1,350,000, Moor Court at an average of £702,500 and Moor Lane at an average of £650,000.
What streets have the most affordable properties for sale in Whitburn And Marsden?
The streets with the most affordable properties for sale in Whitburn And Marsden are Elders Walk at an average of £74,000, Lily Crescent at an average of £80,000 and Marsden Avenue at an average of £85,000.
Which train stations are available in or near Whitburn And Marsden?
Some of the train stations available in or near Whitburn And Marsden are Sunderland, Heworth and Seaham.
Property Price Paid in Whitburn And Marsden by Year
The average sold property price by year was:
| Year | Average Sold Price | Price Change |
Sold Properties
|
|---|---|---|---|
| 2025 | £243,960 | 2% |
60 Properties |
| 2024 | £240,023 | -6% |
89 Properties |
| 2023 | £253,514 | -7% |
60 Properties |
| 2022 | £271,373 | 12% |
78 Properties |
| 2021 | £238,677 | -0,4% |
100 Properties |
| 2020 | £239,707 | 16% |
59 Properties |
| 2019 | £200,764 | -7% |
79 Properties |
| 2018 | £215,059 | -1% |
72 Properties |
| 2017 | £216,175 | 7% |
72 Properties |
| 2016 | £200,781 | 13% |
93 Properties |
| 2015 | £174,216 | -2% |
86 Properties |
| 2014 | £177,847 | -1% |
63 Properties |
| 2013 | £179,709 | 18% |
55 Properties |
| 2012 | £147,172 | -5% |
54 Properties |
| 2011 | £153,871 | -37% |
47 Properties |
| 2010 | £210,870 | 11% |
53 Properties |
| 2009 | £186,931 | 17% |
38 Properties |
| 2008 | £155,072 | -18% |
36 Properties |
| 2007 | £182,351 | 12% |
102 Properties |
| 2006 | £161,205 | -17% |
89 Properties |
| 2005 | £188,331 | 20% |
66 Properties |
| 2004 | £149,908 | 25% |
85 Properties |
| 2003 | £112,923 | 13% |
71 Properties |
| 2002 | £98,237 | 17% |
82 Properties |
| 2001 | £81,393 | 15% |
94 Properties |
| 2000 | £68,889 | -12% |
96 Properties |
| 1999 | £77,349 | 7% |
92 Properties |
| 1998 | £71,735 | 17% |
66 Properties |
| 1997 | £59,248 | 10% |
65 Properties |
| 1996 | £53,503 | -13% |
57 Properties |
| 1995 | £60,376 | - |
44 Properties |
Property Price per Property Type in Whitburn And Marsden
Here you can find historic sold price data in order to help with your property search.
The average Property Paid Price for specific property types in the last three years are:
| Property Type | Average Sold Price | Sold Properties |
|---|---|---|
| Semi Detached House | £190,581.00 | 92 Semi Detached Houses |
| Detached House | £500,308.00 | 36 Detached Houses |
| Terraced House | £176,395.00 | 60 Terraced Houses |
| Flat | £242,014.00 | 21 Flats |

