
Houses for sale in South Tyneside, England
House Prices in South Tyneside
Properties in South Tyneside have
an average house price of
£172k
and had 5,889 Property Transactions
within the last 3 years.¹
South Tyneside is a location in
England with
68,470 households², where the most expensive property was sold for £1.95M.
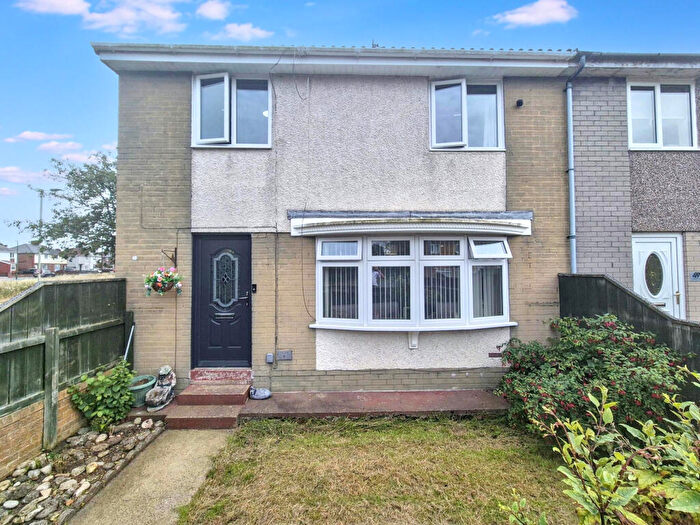
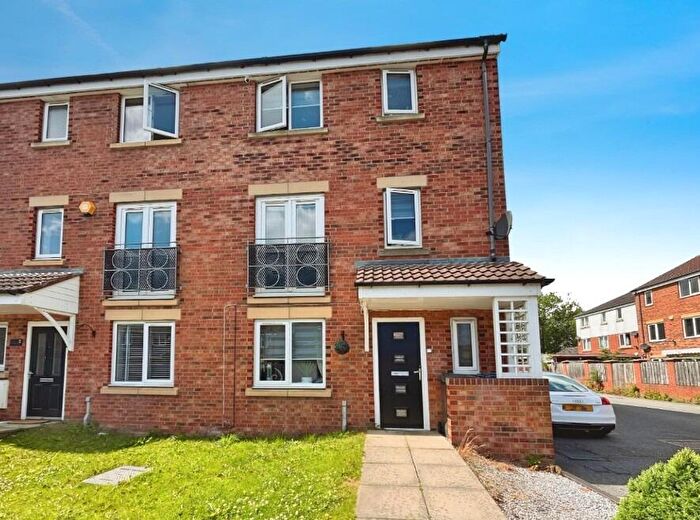
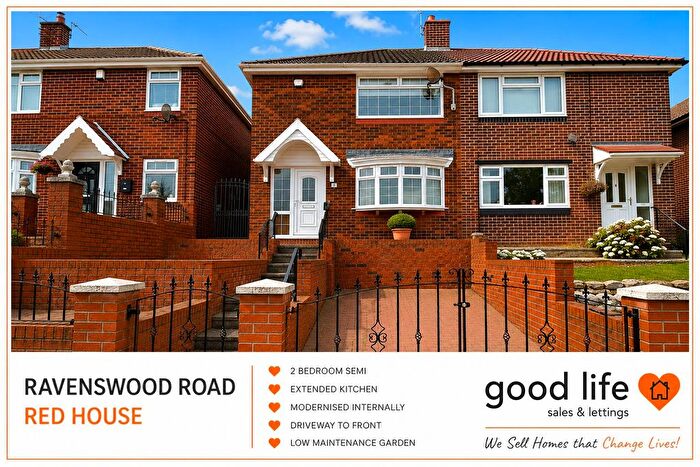
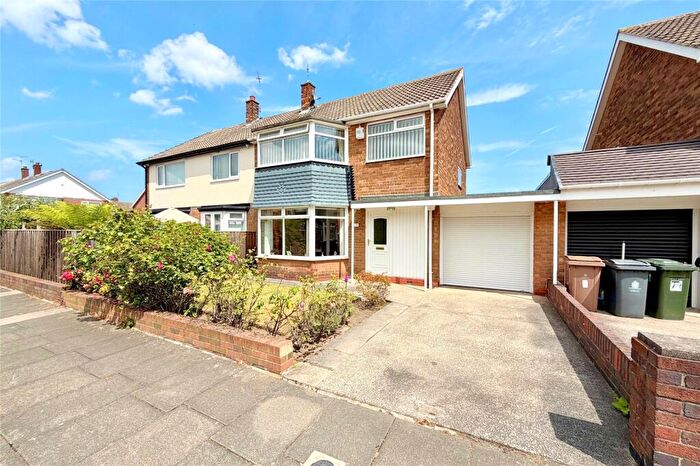
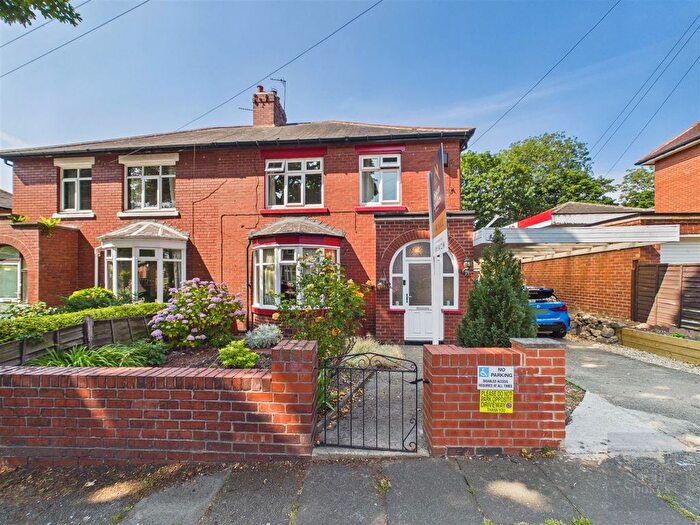
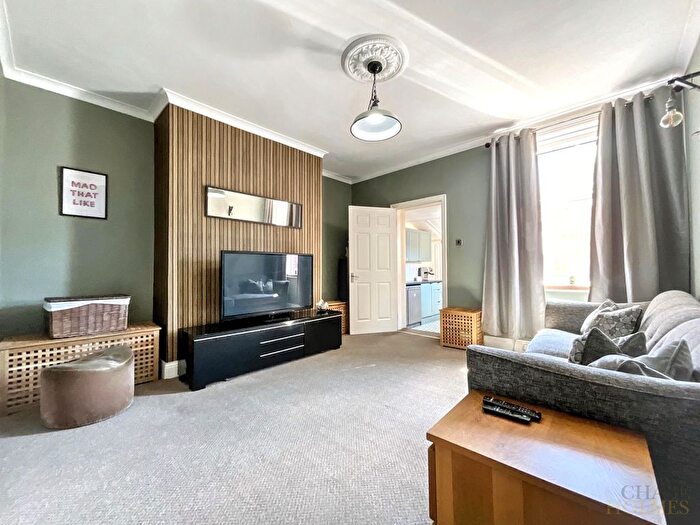
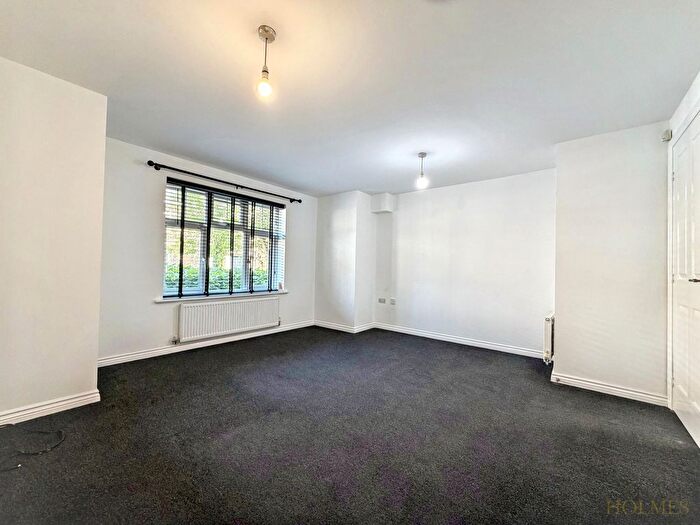
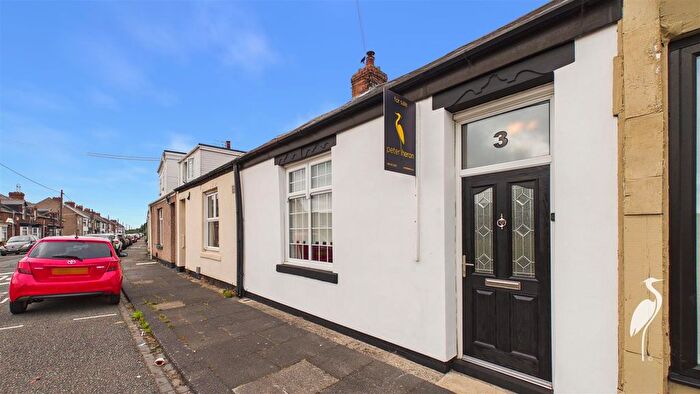
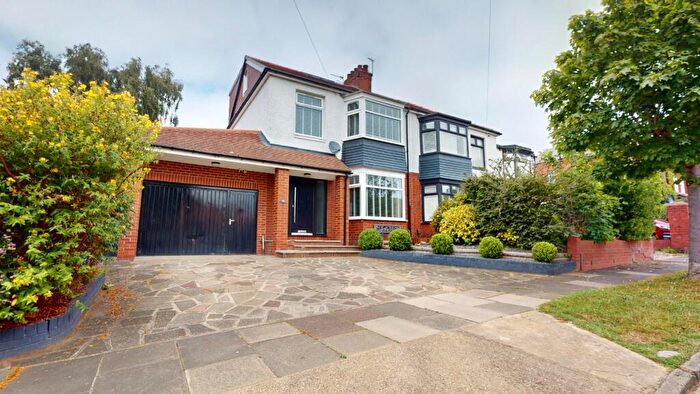
Properties for sale in South Tyneside
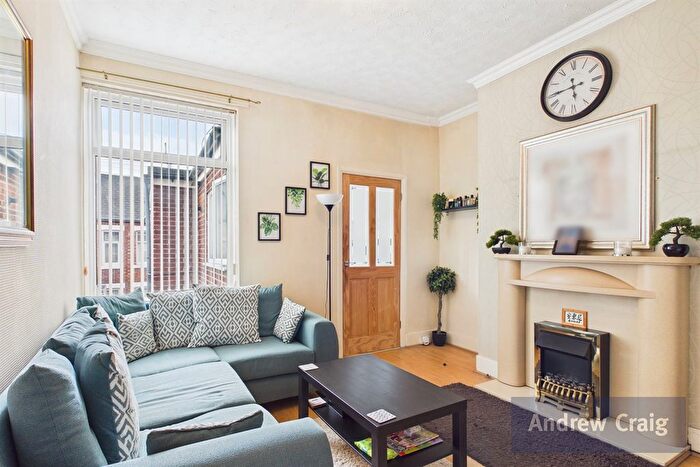

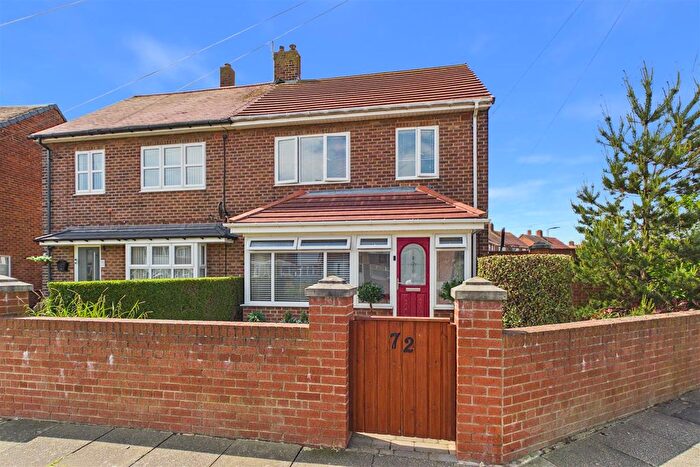
![]()
If you are looking to sell your house, let it out, or receive a property valuation, an expert can help you.
Click the button below to get started.


Towns in South Tyneside
Navigate through our locations to find the location of your next house in South Tyneside, England for sale or to rent.
Property price trends in South Tyneside
According to the latest Land Registry data, the average home in South Tyneside sold for £171,879 in 2026. That figure comes from a substantial record of 62,735 sales logged over the past 31 years.
Prices have held fairly steady over the last three years. Compared with 2023, when the typical sale came in around £169,708, values are broadly unchanged.
Looking back five years, average prices are up about 5% since 2021, a gain of around £8,234 in cash terms.
Zoom out to the past decade for the fuller picture. Back in 2016, homes here averaged £142,986, so the typical sold price has climbed about 20.2% since then, roughly 1.9% a year. Stretch the view to fifteen years and that annual pace edges up closer to 2.1%.
Frequently asked questions about South Tyneside
What is the average price for a property for sale in South Tyneside?
The average price for a property for sale in South Tyneside is £172,401. This amount is 52% lower than the average price in England. There are more than 10,000 property listings for sale in South Tyneside.
What locations have the most expensive properties for sale in South Tyneside?
The locations with the most expensive properties for sale in South Tyneside are Sunderland at an average of £308,373, East Boldon at an average of £233,353 and Hebburn at an average of £169,554.
What locations have the most affordable properties for sale in South Tyneside?
The locations with the most affordable properties for sale in South Tyneside are Jarrow at an average of £146,734, South Shields at an average of £151,690 and Boldon Colliery at an average of £166,205.
Which train stations are available in or near South Tyneside?
Some of the train stations available in or near South Tyneside are Heworth, Sunderland and Manors.
Property Price Paid in South Tyneside by Year
The average sold property price by year was:
| Year | Average Sold Price | Price Change |
Sold Properties
|
|---|---|---|---|
| 2026 | £171,879 | -3% |
332 Properties |
| 2025 | £176,511 | 3% |
1,860 Properties |
| 2024 | £170,981 | 1% |
1,950 Properties |
| 2023 | £169,708 | 2% |
1,747 Properties |
| 2022 | £165,996 | 1% |
2,147 Properties |
| 2021 | £163,645 | 5% |
2,445 Properties |
| 2020 | £155,546 | 3% |
1,713 Properties |
| 2019 | £151,635 | -1% |
2,048 Properties |
| 2018 | £152,639 | 6% |
1,958 Properties |
| 2017 | £143,017 | - |
2,020 Properties |
Property Price per Property Type in South Tyneside
Here you can find historic sold price data in order to help with your property search.
The average Property Paid Price for specific property types in the last three years are:
| Property Type | Average Sold Price | Sold Properties |
|---|---|---|
| Semi Detached House | £194,868.00 | 2,064 Semi Detached Houses |
| Terraced House | £143,274.00 | 2,121 Terraced Houses |
| Detached House | £362,480.00 | 570 Detached Houses |
| Flat | £90,442.00 | 1,134 Flats |
Transport in South Tyneside
Please see below transportation links in this area:
