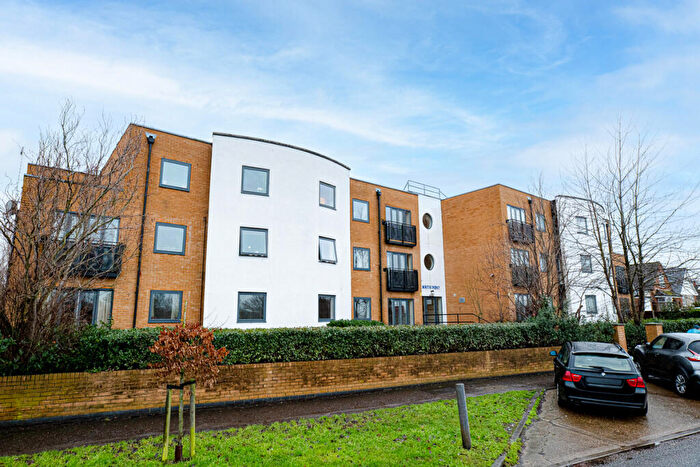
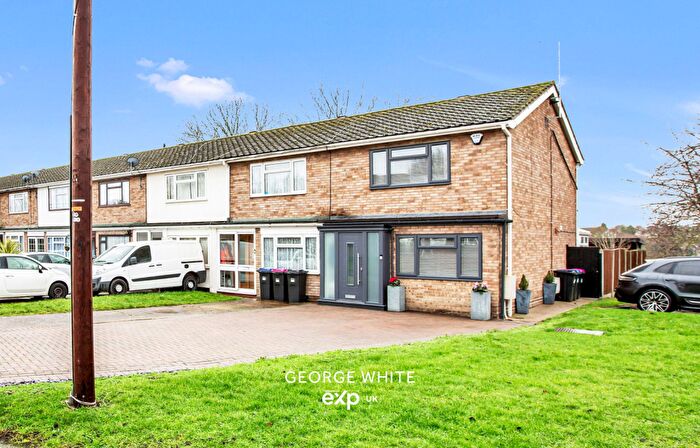
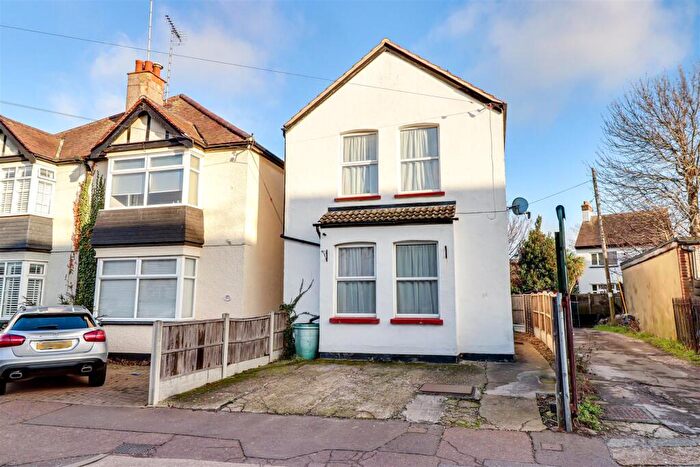
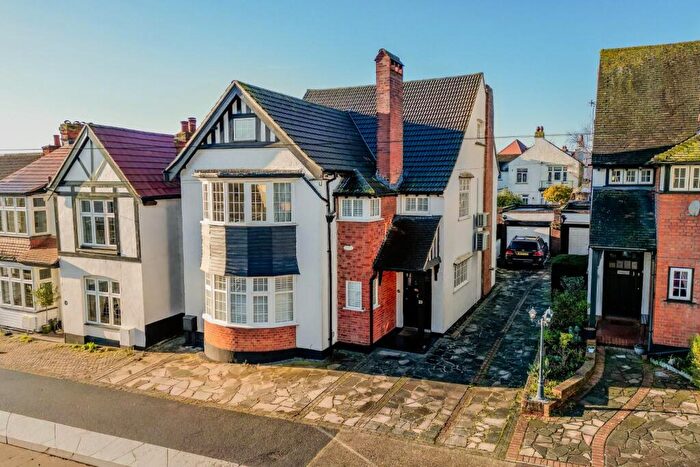
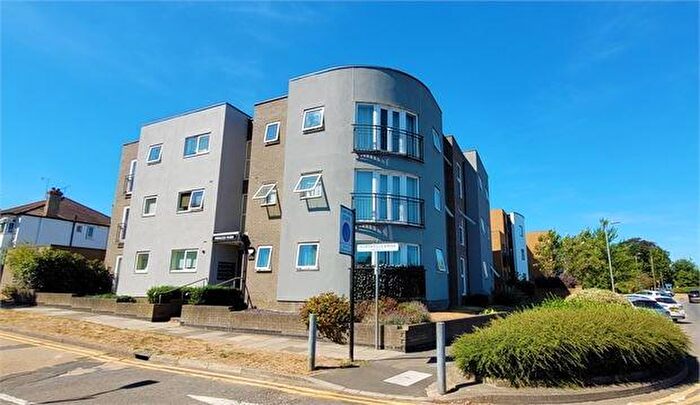
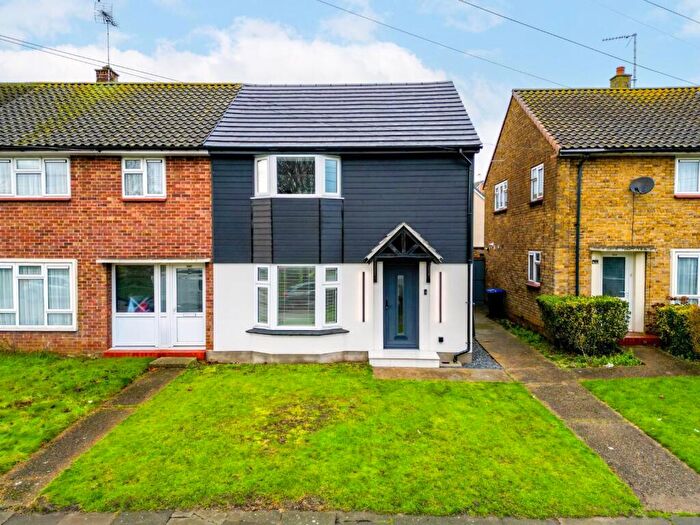
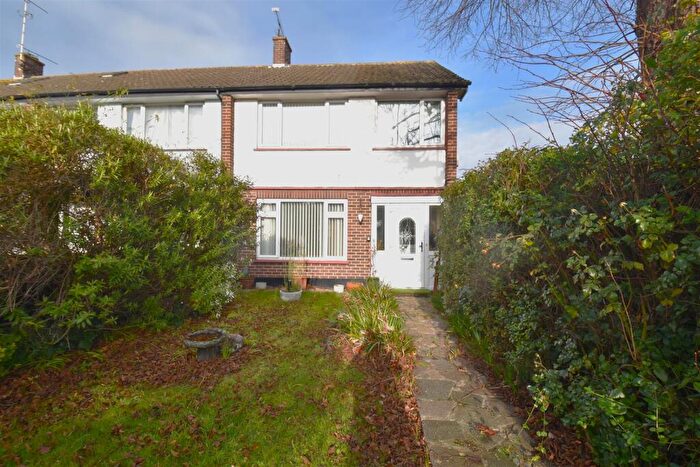
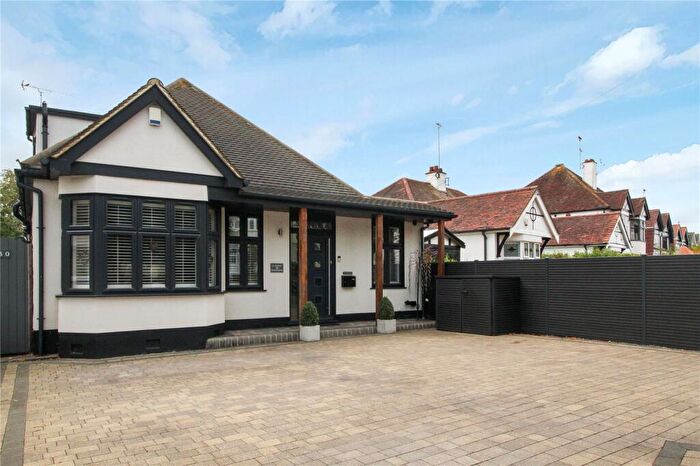
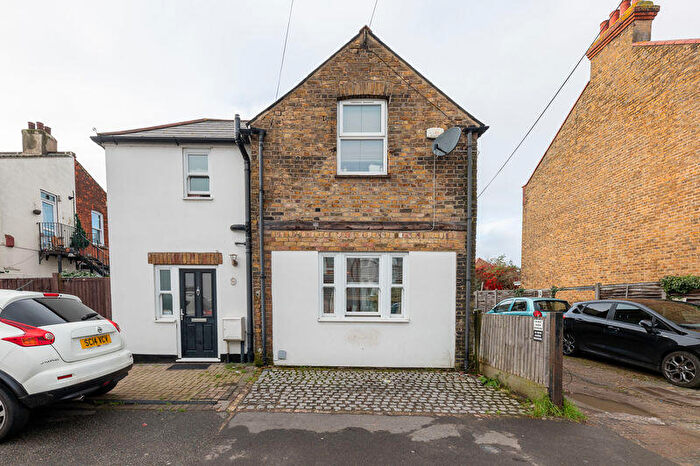
Houses for sale & to rent in Blenheim Park, Westcliff-on-sea
House Prices in Blenheim Park
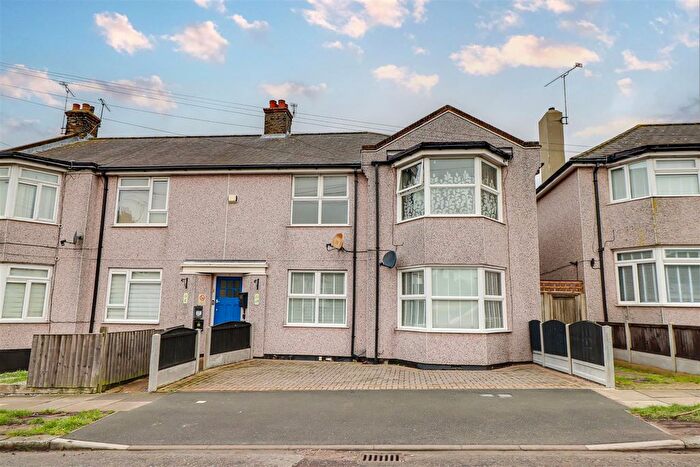
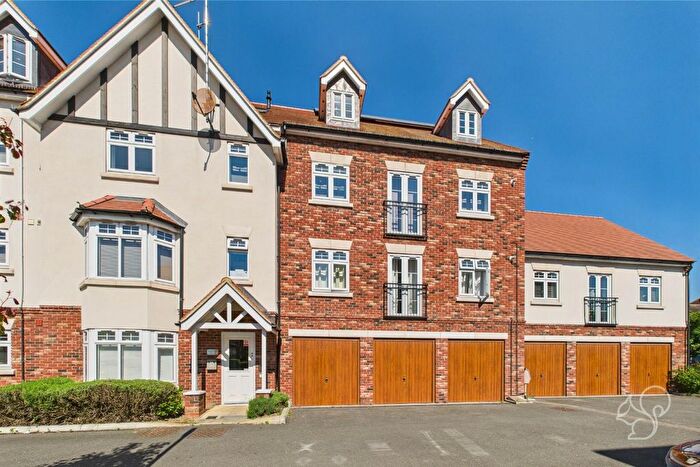
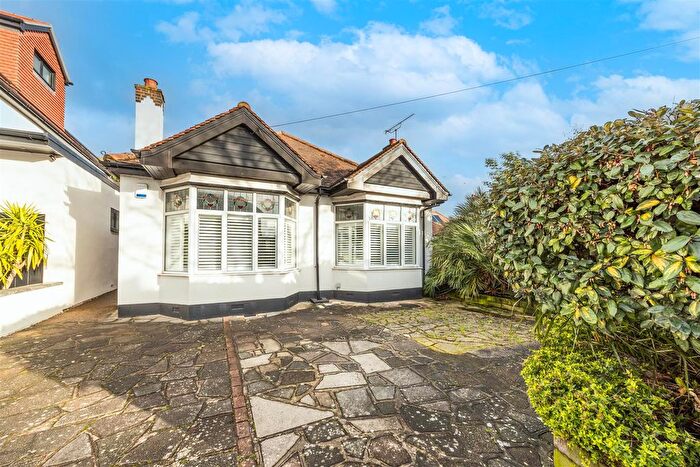
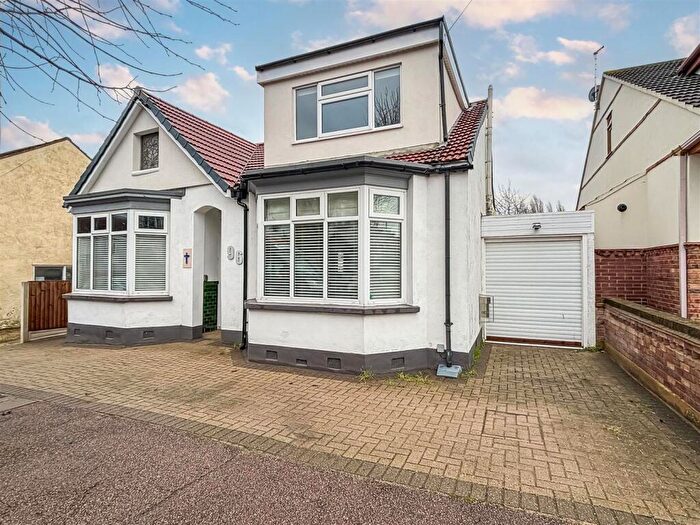
Properties in Blenheim Park have an average house price of £382,406.00 and had 124 Property Transactions within the last 3 years¹.
Blenheim Park is an area in Westcliff-on-sea, Southend-on-Sea with 1,428 households², where the most expensive property was sold for £822,500.00.
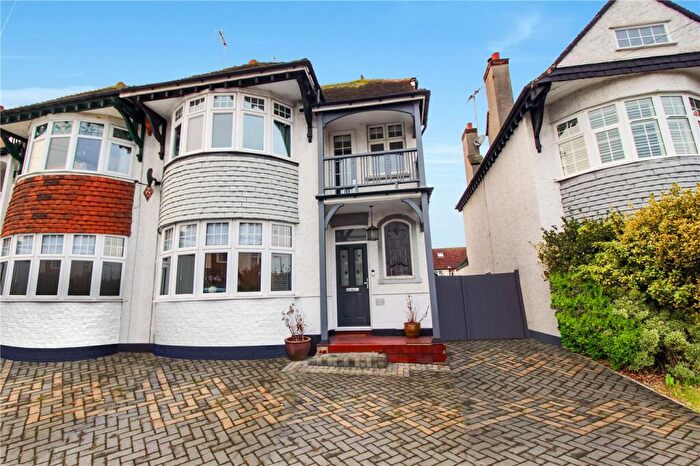
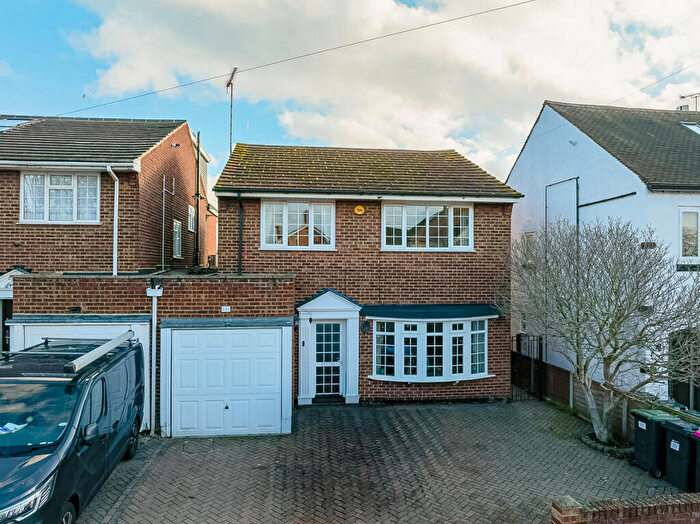
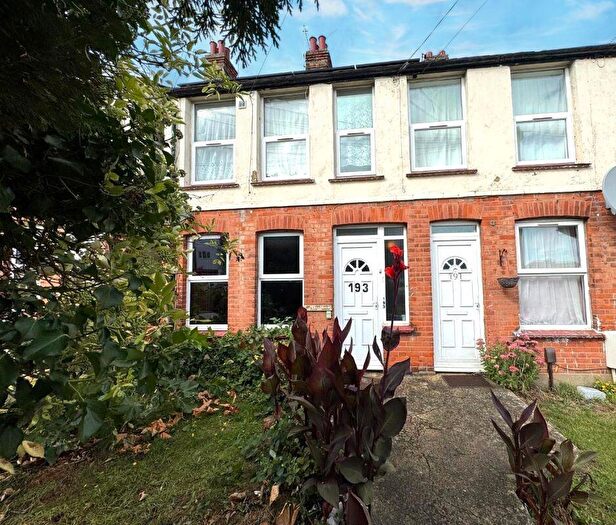
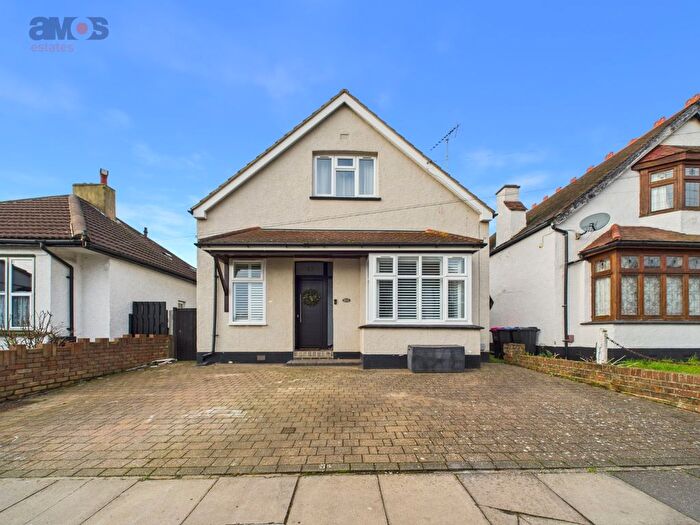
Properties for sale in Blenheim Park
Roads and Postcodes in Blenheim Park
Navigate through our locations to find the location of your next house in Blenheim Park, Westcliff-on-sea for sale or to rent.
| Streets | Postcodes |
|---|---|
| Bridgwater Drive | SS0 0DS SS0 0DX SS0 0EZ SS0 0HA SS0 0HB |
| Bruton Avenue | SS0 0HW |
| Cavendish Gardens | SS0 9XP SS0 9XR SS0 9XS SS0 9XT |
| Charles Close | SS0 0EU |
| Cheddar Avenue | SS0 0HJ |
| Clatterfield Gardens | SS0 0AU SS0 0AX |
| Dunster Avenue | SS0 0HQ |
| Eastwood Boulevard | SS0 0BY SS0 9XL |
| Eastwood Lane South | SS0 9XH SS0 9XJ |
| Elms Court | SS0 0BF |
| Holyrood Drive | SS0 9XY |
| Kenilworth Gardens | SS0 0BA SS0 0BB SS0 0BT SS0 0BP SS0 0BS SS0 0BW |
| Kingsway | SS0 9XF |
| Kingsway Mews | SS0 9XW |
| London Road | SS0 9SY SS0 9SZ SS0 9FA SS0 9TE |
| Martock Avenue | SS0 0HH |
| Martyns Grove | SS0 9XX |
| Mendip Crescent | SS0 0HE SS0 0HG SS0 0HL SS0 0HN |
| Mendip Road | SS0 0HD |
| Prince Avenue | SS0 0ES SS0 0EX SS0 0EY |
| Prittlewell Chase | SS0 0PN SS0 0PR |
| Sandown Avenue | SS0 9YA SS0 9YB |
| Shanklin Drive | SS0 9XU |
| Silversea Drive | SS0 9XD SS0 9XE |
| Southborough Drive | SS0 9XG SS0 9XQ |
| Southbourne Grove | SS0 0AA SS0 0AN SS0 0AW |
| St James Close | SS0 0BX |
| St James Gardens | SS0 0BU |
| The Mendips | SS0 0HF |
| Wellington Avenue | SS0 9XA SS0 9XB |
| Wellstead Gardens | SS0 0AY |
| Westbourne Grove | SS0 0PS |
Transport near Blenheim Park
-
Chalkwell Station
-
Westcliff Station
-
Prittlewell Station
-
Leigh-On-Sea Station
-
Southend Airport Station
-
Southend Victoria Station
-
Southend Central Station
-
Rochford Station
-
Southend East Station
- FAQ
- Price Paid By Year
- Property Type Price
Frequently asked questions about Blenheim Park
What is the average price for a property for sale in Blenheim Park?
The average price for a property for sale in Blenheim Park is £382,406. This amount is 19% higher than the average price in Westcliff-on-sea. There are 2,514 property listings for sale in Blenheim Park.
What streets have the most expensive properties for sale in Blenheim Park?
The streets with the most expensive properties for sale in Blenheim Park are Wellstead Gardens at an average of £751,666, St James Gardens at an average of £700,000 and Eastwood Boulevard at an average of £652,875.
What streets have the most affordable properties for sale in Blenheim Park?
The streets with the most affordable properties for sale in Blenheim Park are The Mendips at an average of £140,000, Cheddar Avenue at an average of £221,250 and London Road at an average of £253,321.
Which train stations are available in or near Blenheim Park?
Some of the train stations available in or near Blenheim Park are Chalkwell, Westcliff and Prittlewell.
Property Price Paid in Blenheim Park by Year
The average sold property price by year was:
| Year | Average Sold Price | Price Change |
Sold Properties
|
|---|---|---|---|
| 2025 | £414,416 | 12% |
36 Properties |
| 2024 | £362,743 | -3% |
39 Properties |
| 2023 | £374,539 | -16% |
49 Properties |
| 2022 | £435,965 | 13% |
50 Properties |
| 2021 | £377,518 | 10% |
76 Properties |
| 2020 | £340,972 | 5% |
55 Properties |
| 2019 | £324,448 | 2% |
63 Properties |
| 2018 | £317,308 | -4% |
72 Properties |
| 2017 | £328,673 | -8% |
75 Properties |
| 2016 | £355,058 | 21% |
56 Properties |
| 2015 | £279,782 | 11% |
80 Properties |
| 2014 | £249,174 | 11% |
67 Properties |
| 2013 | £221,978 | 2% |
59 Properties |
| 2012 | £216,812 | 2% |
46 Properties |
| 2011 | £213,210 | -5% |
58 Properties |
| 2010 | £224,515 | 20% |
33 Properties |
| 2009 | £180,338 | -25% |
31 Properties |
| 2008 | £225,374 | 2% |
40 Properties |
| 2007 | £221,754 | 19% |
82 Properties |
| 2006 | £179,466 | -0,3% |
70 Properties |
| 2005 | £179,952 | 14% |
79 Properties |
| 2004 | £154,621 | 7% |
65 Properties |
| 2003 | £144,520 | 18% |
85 Properties |
| 2002 | £118,483 | 13% |
73 Properties |
| 2001 | £102,995 | 25% |
92 Properties |
| 2000 | £77,629 | 14% |
65 Properties |
| 1999 | £67,051 | 1% |
86 Properties |
| 1998 | £66,546 | 8% |
55 Properties |
| 1997 | £61,042 | 11% |
102 Properties |
| 1996 | £54,366 | 0,1% |
57 Properties |
| 1995 | £54,301 | - |
57 Properties |
Property Price per Property Type in Blenheim Park
Here you can find historic sold price data in order to help with your property search.
The average Property Paid Price for specific property types in the last three years are:
| Property Type | Average Sold Price | Sold Properties |
|---|---|---|
| Semi Detached House | £433,859.00 | 44 Semi Detached Houses |
| Detached House | £569,937.00 | 16 Detached Houses |
| Terraced House | £366,352.00 | 33 Terraced Houses |
| Flat | £229,677.00 | 31 Flats |

