
Houses for sale & to rent in St Laurence, Southend-on-sea
House Prices in St Laurence
Properties in St Laurence have an average house price of £324,615.00 and had 372 Property Transactions within the last 3 years¹.
St Laurence is an area in Southend-on-sea, Southend-on-Sea with 2,929 households², where the most expensive property was sold for £570,000.00.
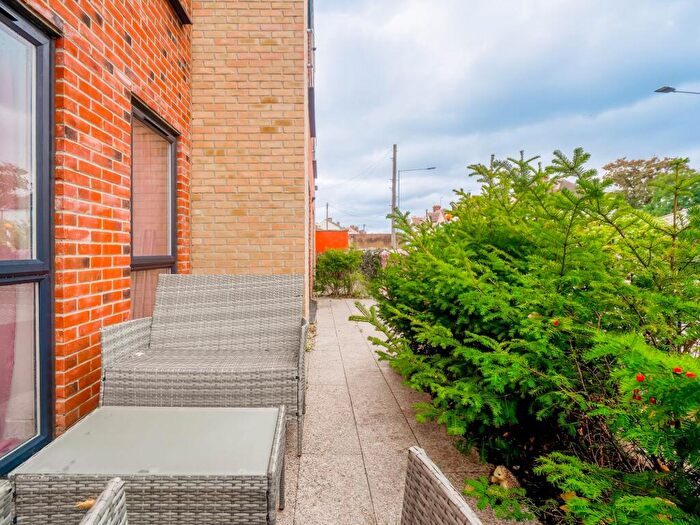
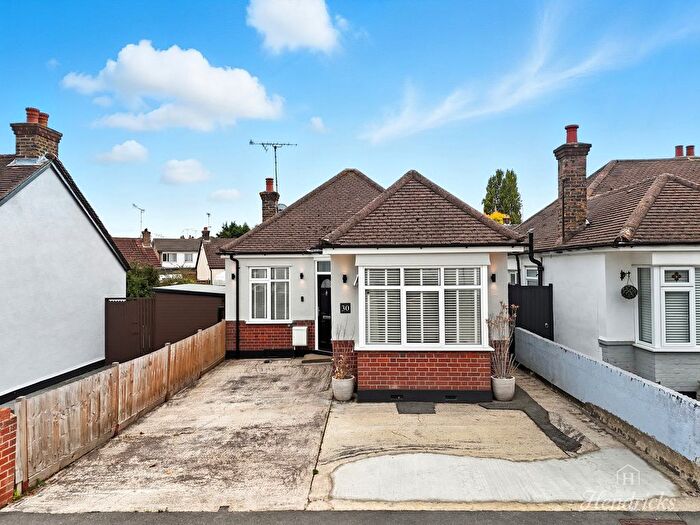
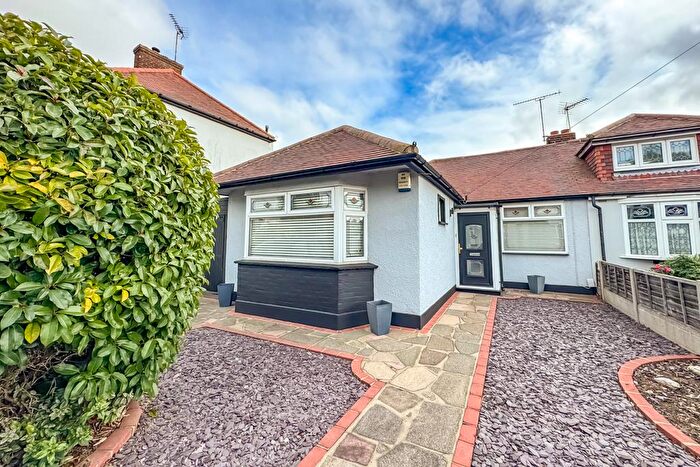
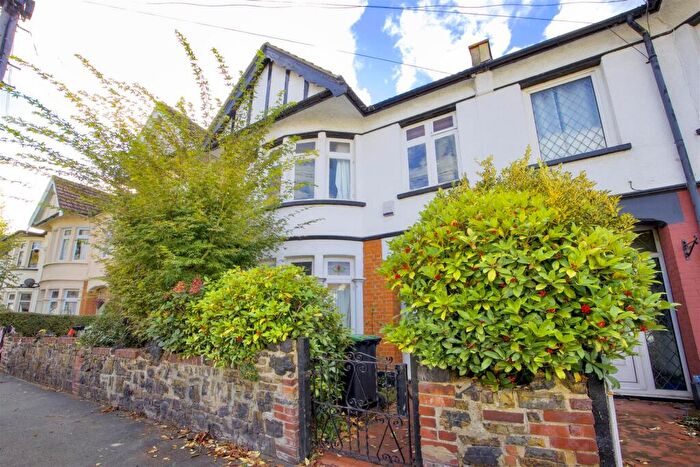
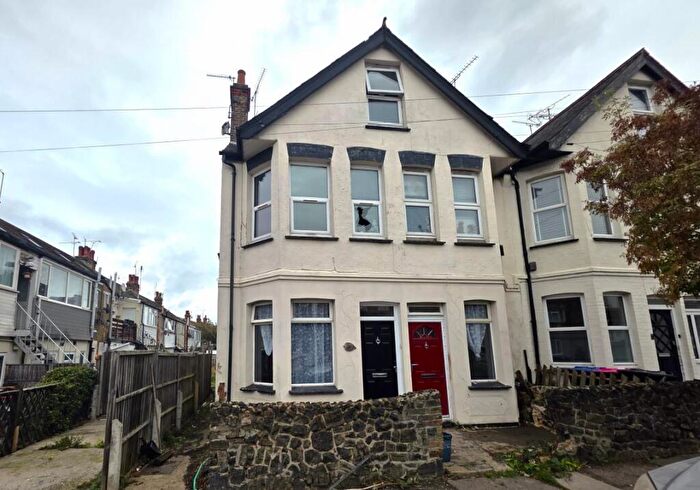
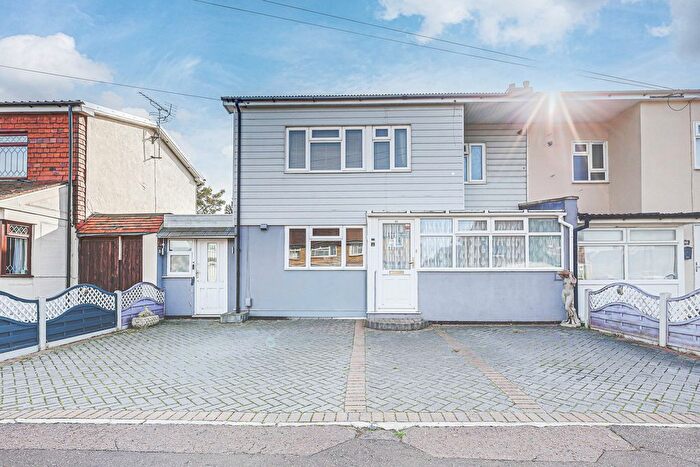
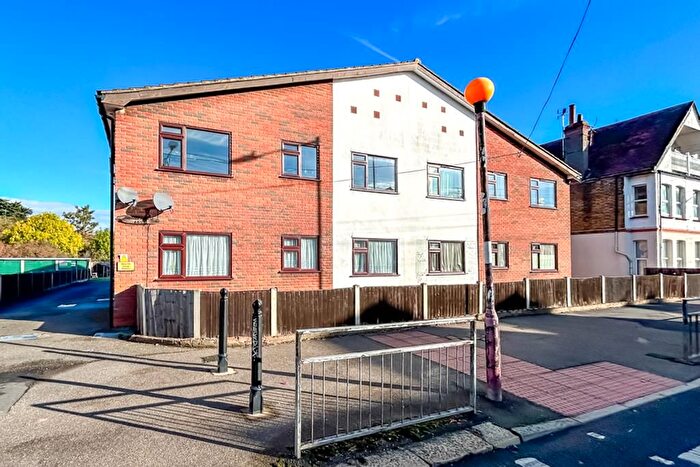
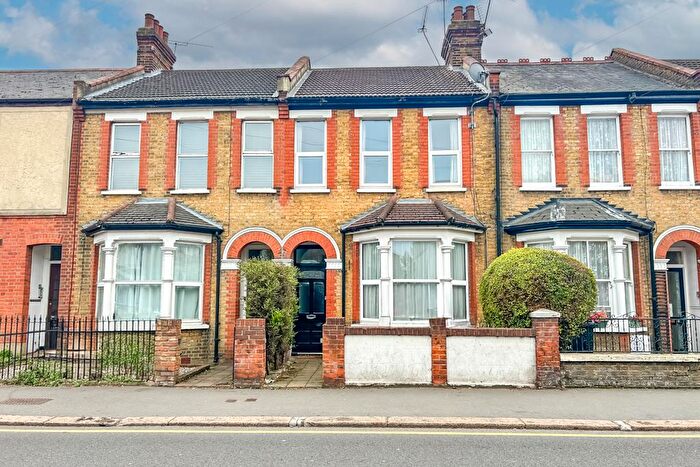
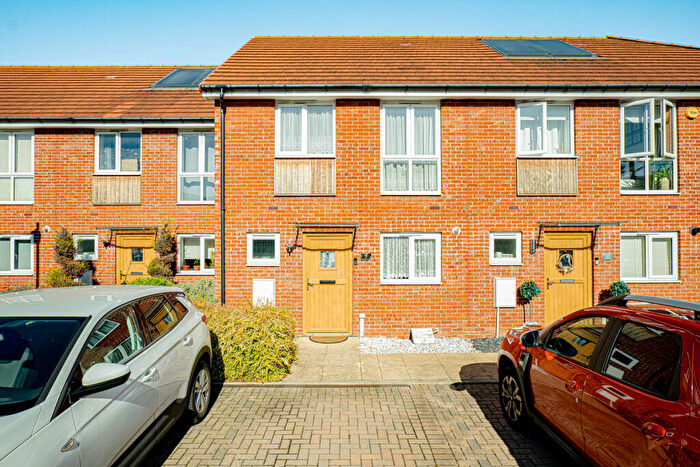
Properties for sale in St Laurence
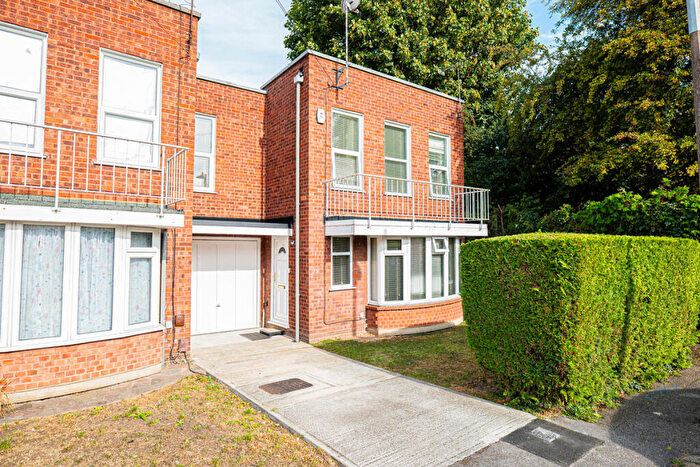
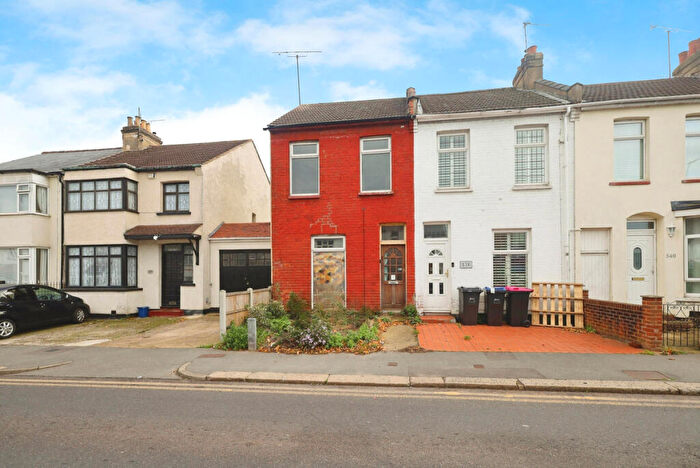
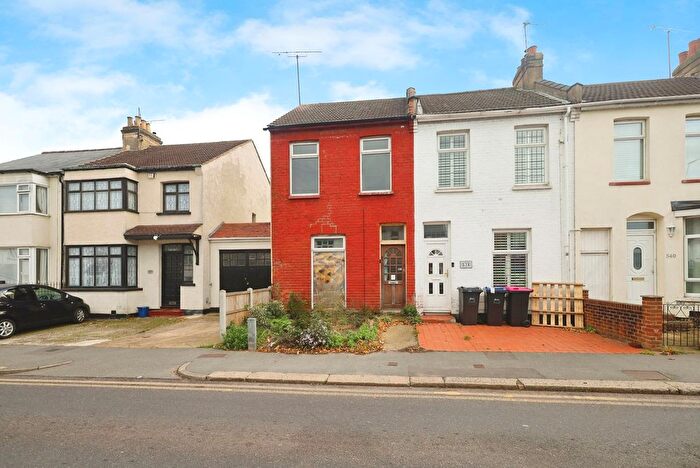
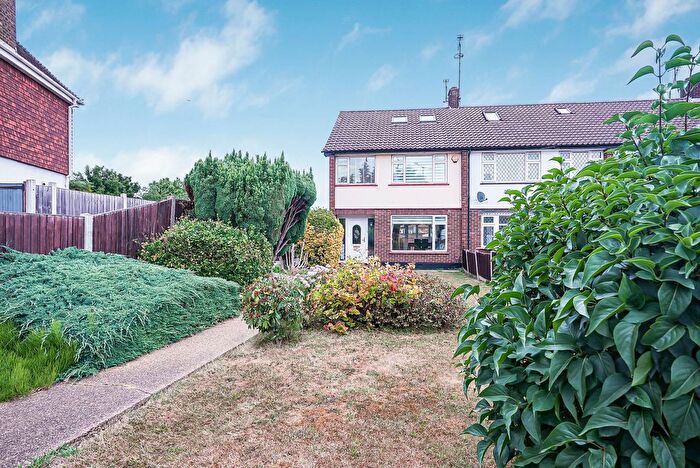

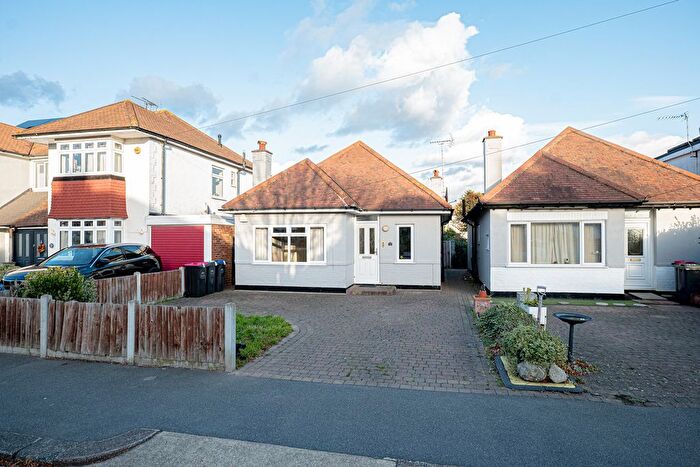
![]()
If you are looking to sell your house, let it out, or receive a property valuation, an expert can help you.
Click the button below to get started.


Roads and Postcodes in St Laurence
Navigate through our locations to find the location of your next house in St Laurence, Southend-on-sea for sale or to rent.
Transport near St Laurence
-
 Southend Airport Station
 -
Prittlewell Station
-
Rochford Station
-
Southend Victoria Station
-
Westcliff Station
-
Southend Central Station
-
Chalkwell Station
-
Southend East Station
-
Leigh-On-Sea Station
- FAQ
- Price Paid By Year
- Property Type Price
Frequently asked questions about St Laurence
What is the average price for a property for sale in St Laurence?
The average price for a property for sale in St Laurence is £324,615. This amount is 4% lower than the average price in Southend-on-sea. There are 1,588 property listings for sale in St Laurence.
What streets have the most expensive properties for sale in St Laurence?
The streets with the most expensive properties for sale in St Laurence are Mayflower Close at an average of £542,500, Larke Rise at an average of £448,000 and Priory Crescent at an average of £440,000.
What streets have the most affordable properties for sale in St Laurence?
The streets with the most affordable properties for sale in St Laurence are Cole Court at an average of £129,321, Prince Avenue at an average of £196,125 and The Bentleys at an average of £258,537.
Which train stations are available in or near St Laurence?
Some of the train stations available in or near St Laurence are Southend Airport, Prittlewell and Rochford.
Property Price Paid in St Laurence by Year
The average sold property price by year was:
| Year | Average Sold Price | Price Change |
Sold Properties
|
|---|---|---|---|
| 2025 | £337,241 | 9% |
56 Properties |
| 2024 | £307,755 | -8% |
119 Properties |
| 2023 | £333,683 | 1% |
83 Properties |
| 2022 | £329,409 | 9% |
114 Properties |
| 2021 | £299,232 | 13% |
146 Properties |
| 2020 | £260,083 | 2% |
121 Properties |
| 2019 | £254,591 | -18% |
138 Properties |
| 2018 | £301,544 | 3% |
161 Properties |
| 2017 | £291,118 | 15% |
172 Properties |
| 2016 | £246,019 | 12% |
123 Properties |
| 2015 | £217,314 | 7% |
91 Properties |
| 2014 | £202,287 | 3% |
137 Properties |
| 2013 | £196,240 | 11% |
95 Properties |
| 2012 | £174,552 | 1% |
91 Properties |
| 2011 | £172,620 | 4% |
83 Properties |
| 2010 | £166,288 | 3% |
88 Properties |
| 2009 | £160,623 | -14% |
103 Properties |
| 2008 | £183,224 | -2% |
88 Properties |
| 2007 | £187,734 | 9% |
164 Properties |
| 2006 | £171,075 | 7% |
188 Properties |
| 2005 | £158,447 | 2% |
128 Properties |
| 2004 | £156,023 | 15% |
142 Properties |
| 2003 | £133,284 | 13% |
153 Properties |
| 2002 | £115,817 | 21% |
172 Properties |
| 2001 | £91,269 | 9% |
172 Properties |
| 2000 | £83,391 | 5% |
172 Properties |
| 1999 | £78,925 | 18% |
177 Properties |
| 1998 | £64,845 | 11% |
155 Properties |
| 1997 | £57,719 | 13% |
166 Properties |
| 1996 | £50,178 | 1% |
153 Properties |
| 1995 | £49,688 | - |
102 Properties |
Property Price per Property Type in St Laurence
Here you can find historic sold price data in order to help with your property search.
The average Property Paid Price for specific property types in the last three years are:
| Property Type | Average Sold Price | Sold Properties |
|---|---|---|
| Flat | £169,788.00 | 39 Flats |
| Semi Detached House | £345,160.00 | 194 Semi Detached Houses |
| Detached House | £390,866.00 | 60 Detached Houses |
| Terraced House | £300,277.00 | 79 Terraced Houses |