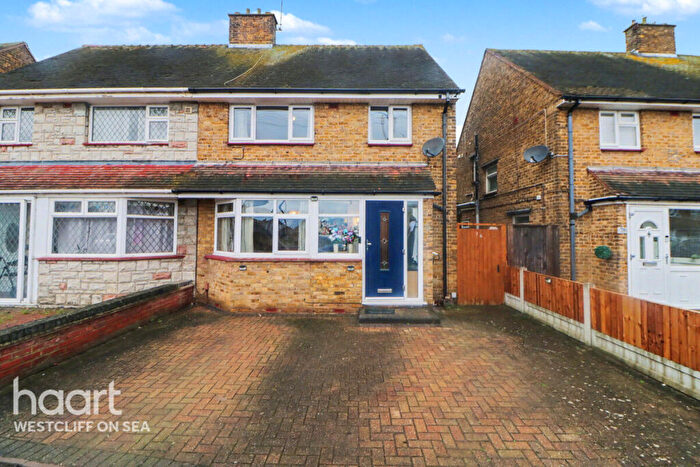
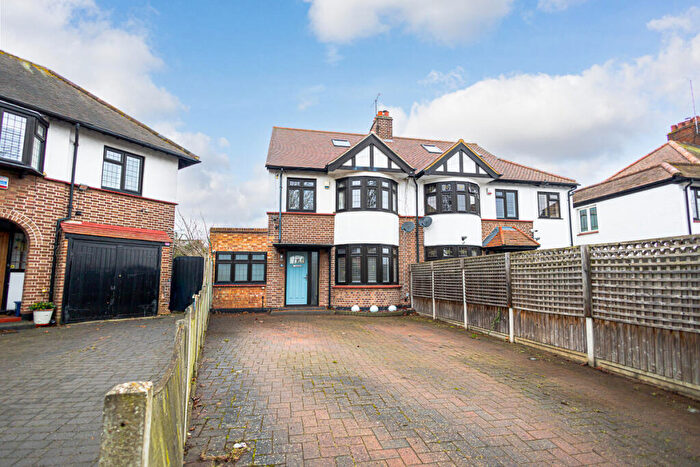
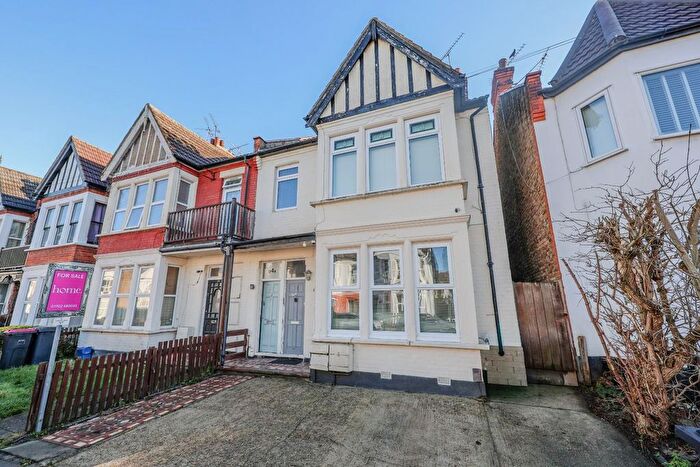
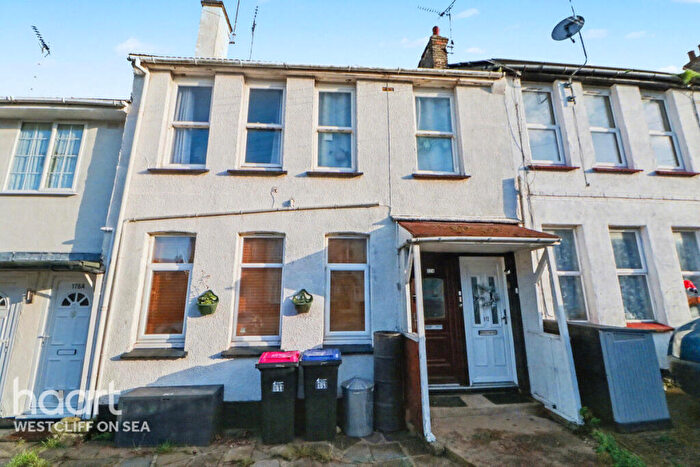
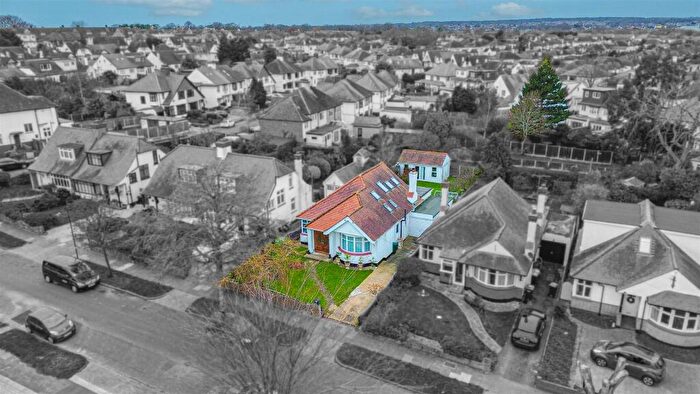
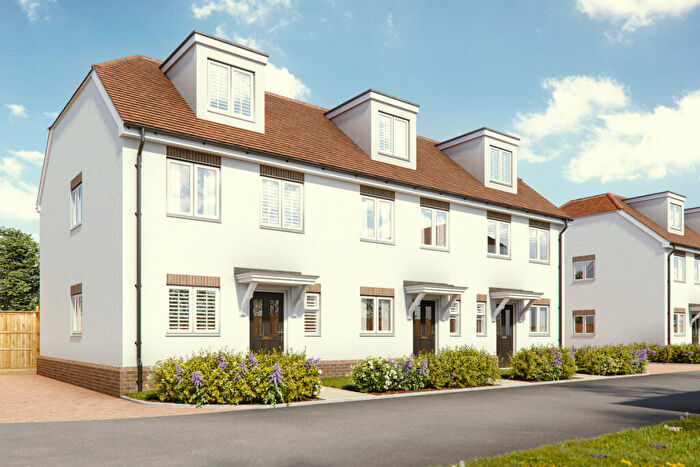
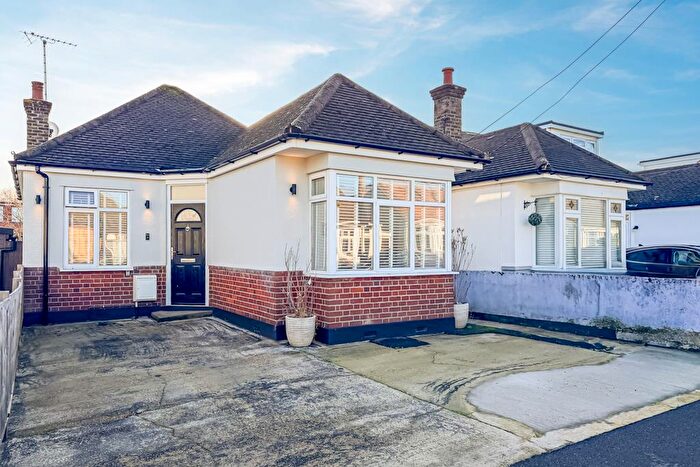
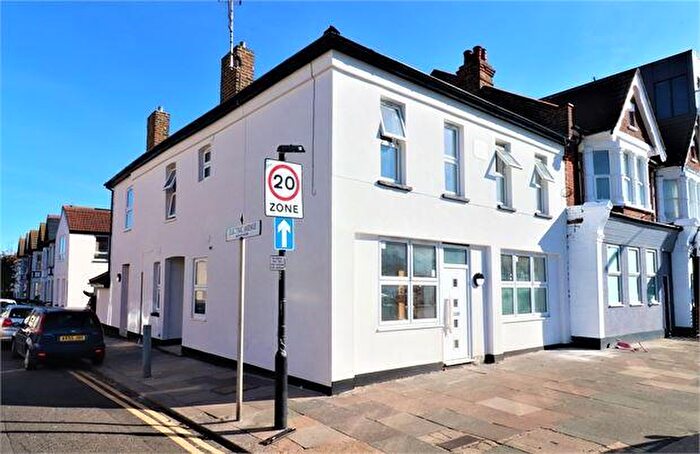
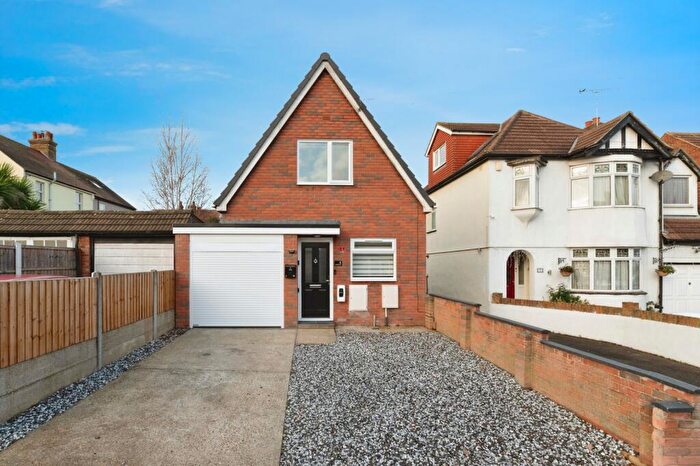
Houses for sale & to rent in Prittlewell, Westcliff-on-sea
House Prices in Prittlewell
Properties in Prittlewell have an average house price of £389,201.00 and had 403 Property Transactions within the last 3 years¹.
Prittlewell is an area in Westcliff-on-sea, Southend-on-Sea with 3,085 households², where the most expensive property was sold for £1,075,000.00.
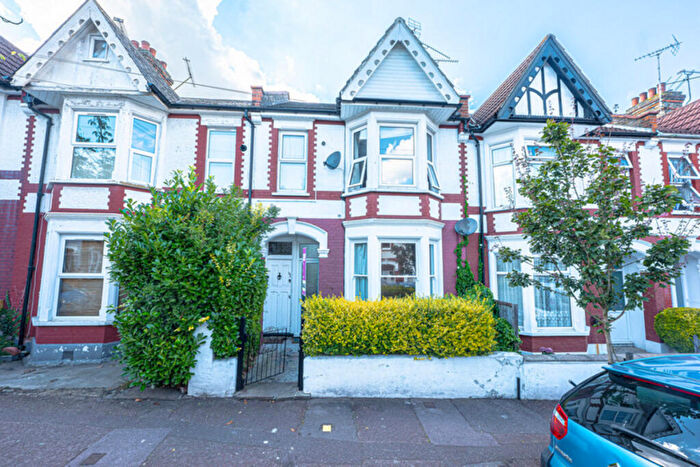
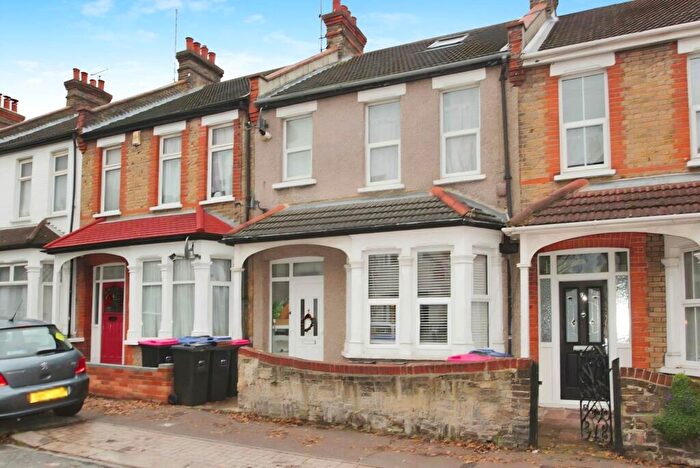
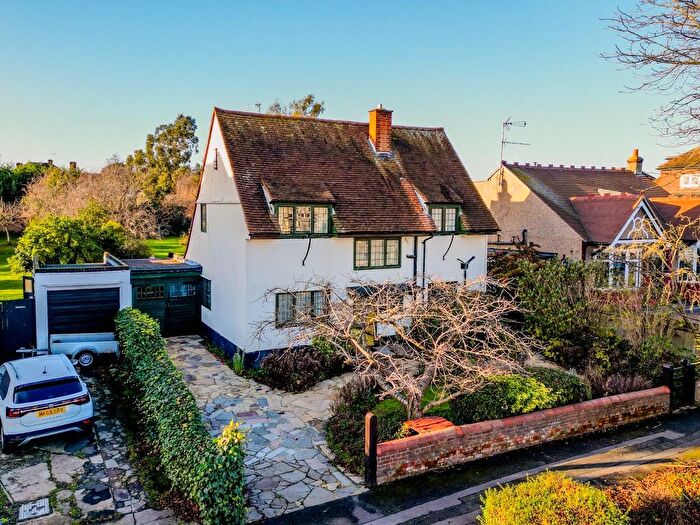
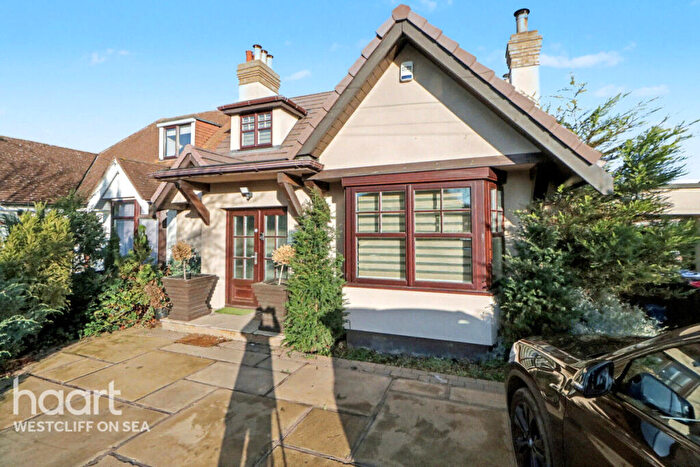
Properties for sale in Prittlewell
Roads and Postcodes in Prittlewell
Navigate through our locations to find the location of your next house in Prittlewell, Westcliff-on-sea for sale or to rent.
| Streets | Postcodes |
|---|---|
| Arundel Gardens | SS0 0BJ SS0 0BL |
| Badgers Close | SS0 0AP |
| Brampton Close | SS0 0DY |
| Bridgwater Drive | SS0 0DH SS0 0DJ |
| Cardigan Avenue | SS0 0SF |
| Carlingford Drive | SS0 0SB SS0 0SD SS0 0SE |
| Carlton Avenue | SS0 0PX SS0 0QD SS0 0QG SS0 0QH SS0 0QL SS0 0QN SS0 0QQ SS0 0QT |
| Chase Gardens | SS0 0RS |
| Cleveland Drive | SS0 0SU |
| Cockethurst Close | SS0 0DU |
| Colemans Avenue | SS0 0NU SS0 0NX |
| Commercial Road | SS0 0QJ |
| Cranfield Close | SS0 0SL |
| Dulverton Avenue | SS0 0HP SS0 0HR |
| Dulverton Close | SS0 0HS |
| Eastbourne Grove | SS0 0QE SS0 0QF |
| Exford Avenue | SS0 0DZ SS0 0EF |
| Fairfax Drive | SS0 9AF SS0 9AG SS0 9BH SS0 9FR |
| Fairview Drive | SS0 0NY |
| Gainsborough Drive | SS0 0SN SS0 9AH SS0 9AJ SS0 9AL SS0 9AN |
| Glastonbury Chase | SS0 0EE |
| Henley Crescent | SS0 0NS SS0 0NT |
| Highfield Close | SS0 0TF |
| Highfield Crescent | SS0 0TD |
| Highfield Drive | SS0 0TB |
| Highfield Gardens | SS0 0SX SS0 0SY |
| Highfield Grove | SS0 0TE |
| Highfield Way | SS0 0TA |
| Hillborough Road | SS0 0RZ SS0 0SA SS0 0SG |
| Hobleythick Lane | SS0 0RH SS0 0RJ SS0 0RL SS0 0RN SS0 0RP SS0 0RW |
| Holmsdale Close | SS0 0QW |
| Kenilworth Gardens | SS0 0BD SS0 0BE SS0 0BH SS0 0BN |
| Langport Drive | SS0 0EB |
| Lavender Grove | SS0 0QP |
| Lavender Mews | SS0 0PE |
| Macdonald Avenue | SS0 9BP SS0 9BS SS0 9BW |
| Mannering Gardens | SS0 0BG SS0 0BQ |
| Merilies Close | SS0 0AE |
| Merilies Gardens | SS0 0AB |
| Midhurst Avenue | SS0 0NP SS0 0NR |
| Northville Drive | SS0 0QA SS0 0QB |
| Oak Tree Gardens | SS0 0PA |
| Porlock Avenue | SS0 0EA |
| Prince Avenue | SS0 0EN SS0 0ER SS0 0EW SS0 0JN SS0 0NB SS0 0ND SS0 0NF SS0 0NN SS0 0NW SS0 0JL SS0 0LJ |
| Prittlewell Chase | SS0 0PL SS0 0PP SS0 0PW SS0 0RB SS0 0RD SS0 0RE SS0 0RQ SS0 0RR SS0 0RT SS0 0RG SS0 0RX SS0 0RY SS0 0SR |
| Queen Annes Drive | SS0 0NH SS0 0NQ |
| Queen Annes Mews | SS0 0TG |
| Richmond Drive | SS0 0PD |
| Rochester Drive | SS0 0NJ SS0 0NL |
| Rochester Mews | SS0 0NE |
| Rosary Gardens | SS0 0AJ |
| Seldon Close | SS0 0AD |
| Shakespeare Avenue | SS0 0ST |
| Shakespeare Drive | SS0 9AA SS0 9AB SS0 9AE SS0 9FJ |
| Somerset Avenue | SS0 0DL SS0 0DW |
| Somerset Crescent | SS0 0DN |
| Somerton Avenue | SS0 0ED |
| Southbourne Gardens | SS0 0AG |
| Southbourne Grove | SS0 0AF SS0 0AH SS0 0AL SS0 0AQ |
| Springfield Drive | SS0 0RA |
| St Georges Drive | SS0 0SS |
| Taunton Drive | SS0 0EQ |
| Teddington Villas | SS0 9AD |
| Thear Close | SS0 0PB |
| West Road | SS0 9DE SS0 9DH SS0 9FH |
| Westborough Road | SS0 9DR |
| Westbourne Grove | SS0 0PT SS0 0PU SS0 0PY SS0 0PZ |
| Winsford Gardens | SS0 0DP SS0 0DR |
| Yeovil Chase | SS0 0EG |
Transport near Prittlewell
-
Prittlewell Station
-
Southend Airport Station
-
Westcliff Station
-
Chalkwell Station
-
Southend Victoria Station
-
Southend Central Station
-
Rochford Station
-
Leigh-On-Sea Station
-
Southend East Station
- FAQ
- Price Paid By Year
- Property Type Price
Frequently asked questions about Prittlewell
What is the average price for a property for sale in Prittlewell?
The average price for a property for sale in Prittlewell is £389,201. This amount is 18% higher than the average price in Westcliff-on-sea. There are 2,848 property listings for sale in Prittlewell.
What streets have the most expensive properties for sale in Prittlewell?
The streets with the most expensive properties for sale in Prittlewell are Southbourne Grove at an average of £641,000, Arundel Gardens at an average of £594,054 and Hobleythick Lane at an average of £576,222.
What streets have the most affordable properties for sale in Prittlewell?
The streets with the most affordable properties for sale in Prittlewell are Hillborough Road at an average of £226,250, Northville Drive at an average of £233,687 and Westborough Road at an average of £242,000.
Which train stations are available in or near Prittlewell?
Some of the train stations available in or near Prittlewell are Prittlewell, Southend Airport and Westcliff.
Property Price Paid in Prittlewell by Year
The average sold property price by year was:
| Year | Average Sold Price | Price Change |
Sold Properties
|
|---|---|---|---|
| 2025 | £378,726 | 5% |
73 Properties |
| 2024 | £359,362 | -9% |
104 Properties |
| 2023 | £393,239 | -6% |
97 Properties |
| 2022 | £416,148 | 9% |
129 Properties |
| 2021 | £377,428 | 9% |
193 Properties |
| 2020 | £341,934 | 10% |
99 Properties |
| 2019 | £306,618 | 1% |
133 Properties |
| 2018 | £303,083 | -1% |
141 Properties |
| 2017 | £305,866 | 10% |
135 Properties |
| 2016 | £275,022 | 8% |
128 Properties |
| 2015 | £253,734 | 5% |
133 Properties |
| 2014 | £241,075 | 9% |
130 Properties |
| 2013 | £219,967 | 9% |
114 Properties |
| 2012 | £200,099 | -7% |
106 Properties |
| 2011 | £213,842 | 8% |
82 Properties |
| 2010 | £197,793 | -4% |
83 Properties |
| 2009 | £205,836 | -2% |
97 Properties |
| 2008 | £210,897 | 1% |
87 Properties |
| 2007 | £208,476 | 9% |
192 Properties |
| 2006 | £189,988 | 5% |
197 Properties |
| 2005 | £179,651 | 5% |
164 Properties |
| 2004 | £169,964 | 10% |
173 Properties |
| 2003 | £152,835 | 8% |
187 Properties |
| 2002 | £141,257 | 24% |
174 Properties |
| 2001 | £107,641 | 14% |
182 Properties |
| 2000 | £92,264 | 14% |
146 Properties |
| 1999 | £79,109 | 1% |
180 Properties |
| 1998 | £78,543 | 7% |
169 Properties |
| 1997 | £73,389 | 20% |
181 Properties |
| 1996 | £58,660 | 4% |
143 Properties |
| 1995 | £56,080 | - |
120 Properties |
Property Price per Property Type in Prittlewell
Here you can find historic sold price data in order to help with your property search.
The average Property Paid Price for specific property types in the last three years are:
| Property Type | Average Sold Price | Sold Properties |
|---|---|---|
| Semi Detached House | £407,907.00 | 223 Semi Detached Houses |
| Detached House | £512,315.00 | 76 Detached Houses |
| Terraced House | £336,004.00 | 47 Terraced Houses |
| Flat | £195,728.00 | 57 Flats |

