
Houses for sale & to rent in Prittlewell, Southend-on-sea
House Prices in Prittlewell
Properties in Prittlewell have an average house price of £306,053.00 and had 120 Property Transactions within the last 3 years¹.
Prittlewell is an area in Southend-on-sea, Southend-on-Sea with 1,102 households², where the most expensive property was sold for £735,000.00.
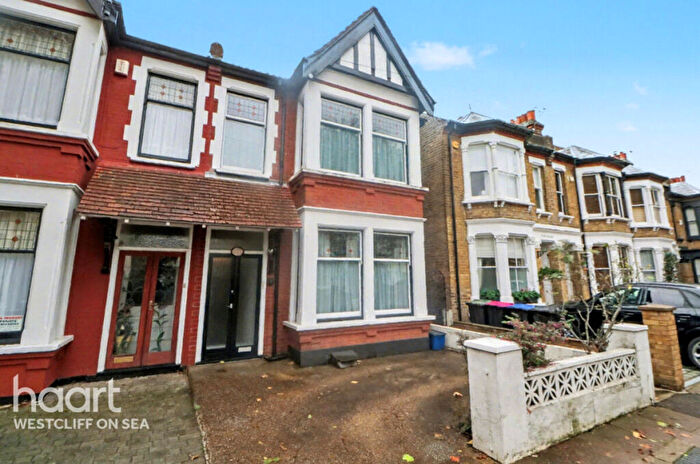
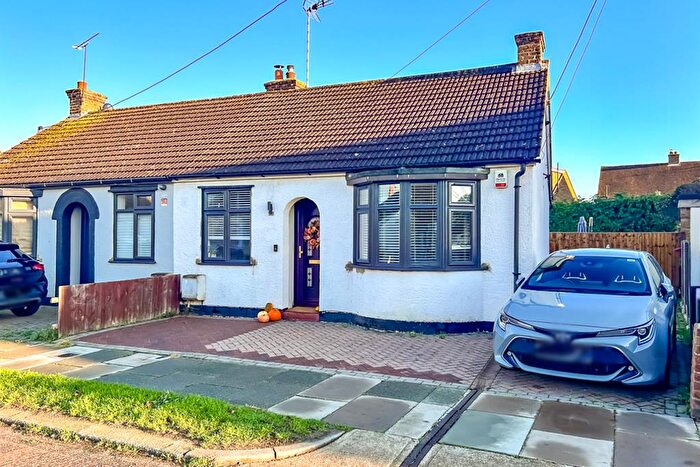
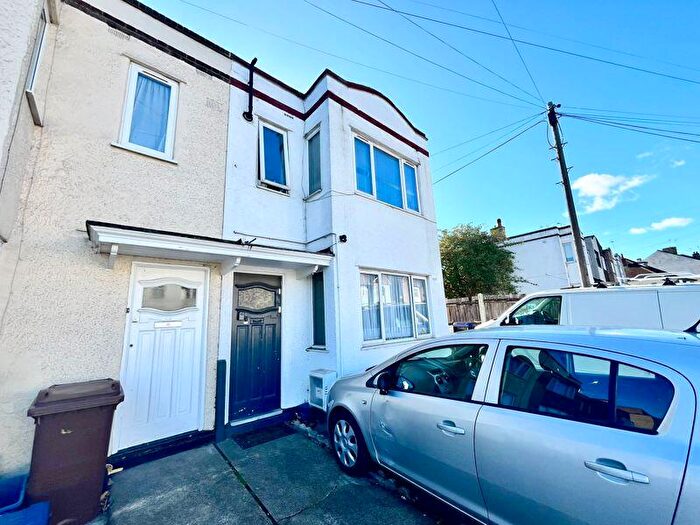
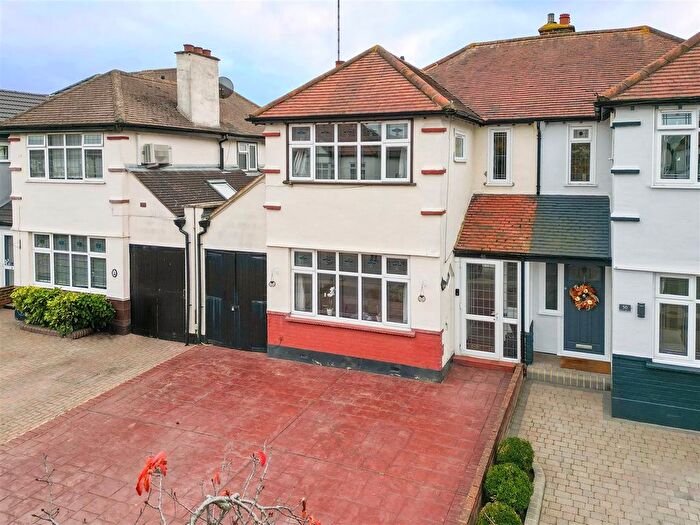
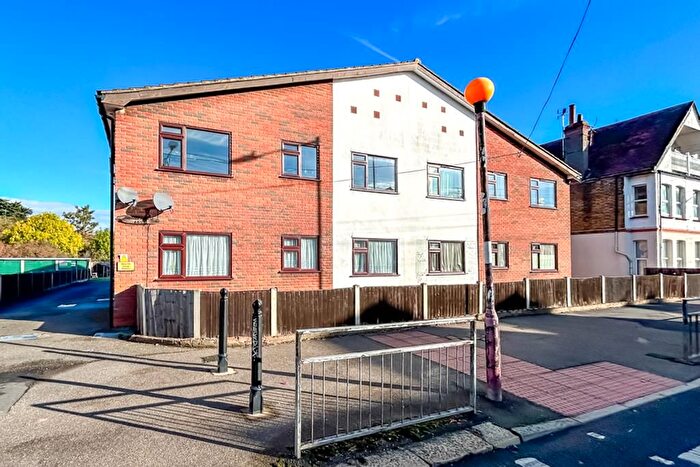
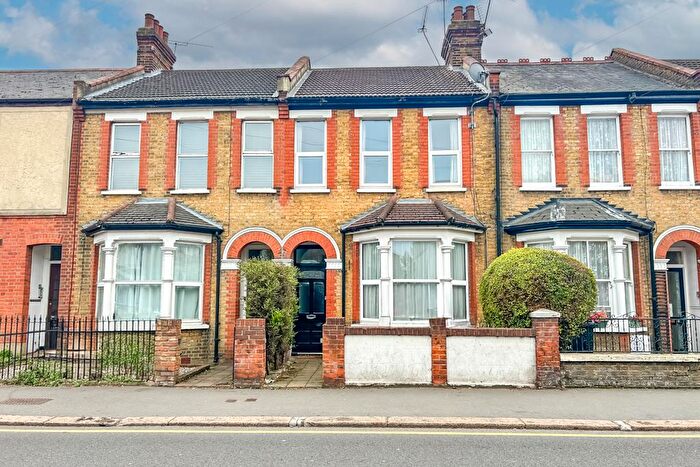
Properties for sale in Prittlewell
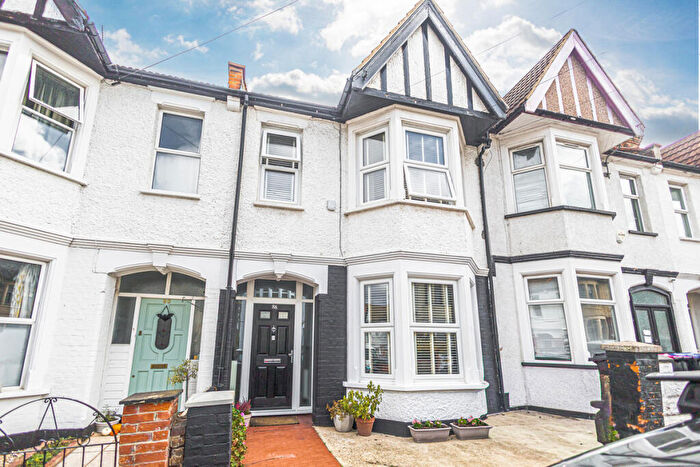


![]()
If you are looking to sell your house, let it out, or receive a property valuation, an expert can help you.
Click the button below to get started.


Roads and Postcodes in Prittlewell
Navigate through our locations to find the location of your next house in Prittlewell, Southend-on-sea for sale or to rent.
| Streets | Postcodes |
|---|---|
| Beeleigh Close | SS2 6PA |
| Burr Hill Chase | SS2 6RA SS2 6PE SS2 6PJ |
| Earls Hall Avenue | SS2 6NS SS2 6NT SS2 6NU SS2 6PB SS2 6PD |
| Earls Hall Parade | SS2 6NW |
| East Street | SS2 6LQ |
| Edith Road | SS2 6JU |
| Hill Road | SS2 6JT |
| Jones Close | SS2 6PF SS2 6PG SS2 6PQ |
| Mayfield Avenue | SS2 6NP SS2 6NR SS2 6NY SS2 6NZ |
| Parkstone Drive | SS2 6NX |
| Prince Avenue | SS2 6NN |
| Priory Avenue | SS2 6LA SS2 6LB SS2 6LD |
| Priory Crescent | SS2 6JX SS2 6JY SS2 6JZ SS2 6QN |
| Railway Approach | SS2 6LG |
| Regency Green | SS2 6LU |
| Roots Hall Avenue | SS2 6HN |
| Roots Hall Drive | SS2 6GW SS2 6HF SS2 6HL SS2 6DA |
| St Benets Road | SS2 6LE SS2 6LF |
| St Marys Road | SS2 6JR SS2 6JS |
| Tudor Mews | SS2 6AU |
| Victoria Avenue | SS2 6NA SS2 6NB SS2 6ND SS2 6NE SS2 6NF SS2 6NH SS2 6NJ SS2 6NL SS2 6BJ SS2 6NQ |
| West Street | SS2 6HJ |
Transport near Prittlewell
-
 Prittlewell Station
 -
Southend Victoria Station
-
Southend Central Station
-
Westcliff Station
-
Southend Airport Station
-
Southend East Station
-
Chalkwell Station
-
Rochford Station
-
Thorpe Bay Station
-
Leigh-On-Sea Station
- FAQ
- Price Paid By Year
- Property Type Price
Frequently asked questions about Prittlewell
What is the average price for a property for sale in Prittlewell?
The average price for a property for sale in Prittlewell is £306,053. This amount is 10% lower than the average price in Southend-on-sea. There are 2,915 property listings for sale in Prittlewell.
What streets have the most expensive properties for sale in Prittlewell?
The streets with the most expensive properties for sale in Prittlewell are Beeleigh Close at an average of £492,500, Earls Hall Avenue at an average of £482,500 and Regency Green at an average of £466,000.
What streets have the most affordable properties for sale in Prittlewell?
The streets with the most affordable properties for sale in Prittlewell are Burr Hill Chase at an average of £150,000, Roots Hall Drive at an average of £163,600 and West Street at an average of £185,625.
Which train stations are available in or near Prittlewell?
Some of the train stations available in or near Prittlewell are Prittlewell, Southend Victoria and Southend Central.
Property Price Paid in Prittlewell by Year
The average sold property price by year was:
| Year | Average Sold Price | Price Change |
Sold Properties
|
|---|---|---|---|
| 2025 | £277,555 | -14% |
18 Properties |
| 2024 | £317,115 | -0,2% |
26 Properties |
| 2023 | £317,670 | 4% |
29 Properties |
| 2022 | £303,680 | -9% |
47 Properties |
| 2021 | £332,380 | 1% |
47 Properties |
| 2020 | £329,590 | 17% |
33 Properties |
| 2019 | £275,081 | 2% |
43 Properties |
| 2018 | £270,932 | 8% |
41 Properties |
| 2017 | £248,231 | 0,3% |
40 Properties |
| 2016 | £247,473 | 10% |
40 Properties |
| 2015 | £223,739 | 8% |
47 Properties |
| 2014 | £205,988 | -0,4% |
52 Properties |
| 2013 | £206,859 | 5% |
25 Properties |
| 2012 | £196,282 | 16% |
25 Properties |
| 2011 | £165,069 | -4% |
47 Properties |
| 2010 | £171,068 | -1% |
29 Properties |
| 2009 | £172,807 | -2% |
25 Properties |
| 2008 | £176,842 | -15% |
35 Properties |
| 2007 | £204,035 | 10% |
63 Properties |
| 2006 | £182,641 | 7% |
68 Properties |
| 2005 | £169,111 | 4% |
40 Properties |
| 2004 | £162,077 | 10% |
45 Properties |
| 2003 | £146,642 | 17% |
45 Properties |
| 2002 | £121,879 | 17% |
53 Properties |
| 2001 | £100,919 | 7% |
49 Properties |
| 2000 | £93,755 | 22% |
69 Properties |
| 1999 | £73,429 | 15% |
53 Properties |
| 1998 | £62,752 | 16% |
50 Properties |
| 1997 | £53,018 | -2% |
44 Properties |
| 1996 | £54,209 | 3% |
50 Properties |
| 1995 | £52,627 | - |
46 Properties |
Property Price per Property Type in Prittlewell
Here you can find historic sold price data in order to help with your property search.
The average Property Paid Price for specific property types in the last three years are:
| Property Type | Average Sold Price | Sold Properties |
|---|---|---|
| Semi Detached House | £374,209.00 | 43 Semi Detached Houses |
| Detached House | £468,750.00 | 16 Detached Houses |
| Terraced House | £245,698.00 | 35 Terraced Houses |
| Flat | £174,461.00 | 26 Flats |