
Houses for sale & to rent in Thorpe, Southend-on-sea
House Prices in Thorpe
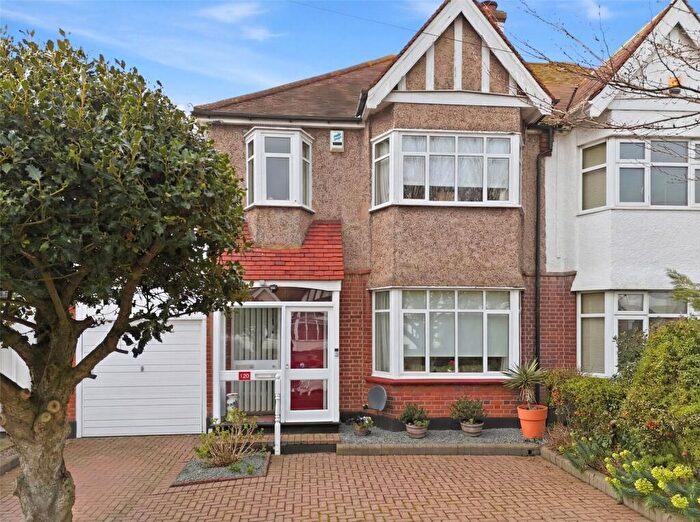
Properties in Thorpe have an average house price of £514k and had 391 Property Transactions within the last 3 years¹.
Thorpe is an area in Southend-on-sea, Southend-on-Sea with 3,893 households², where the most expensive property was sold for £2.05M.
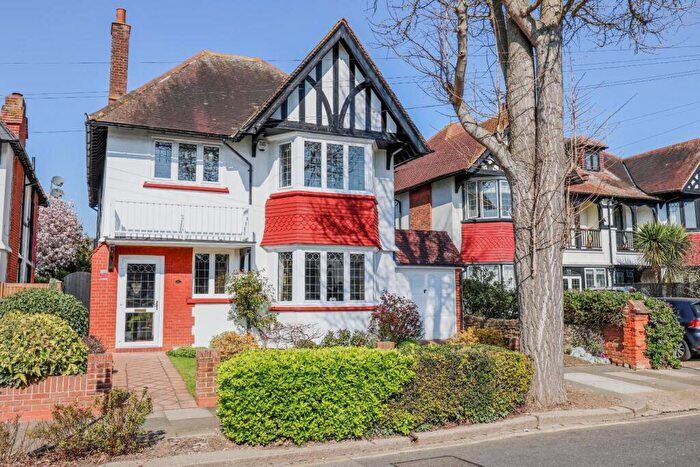
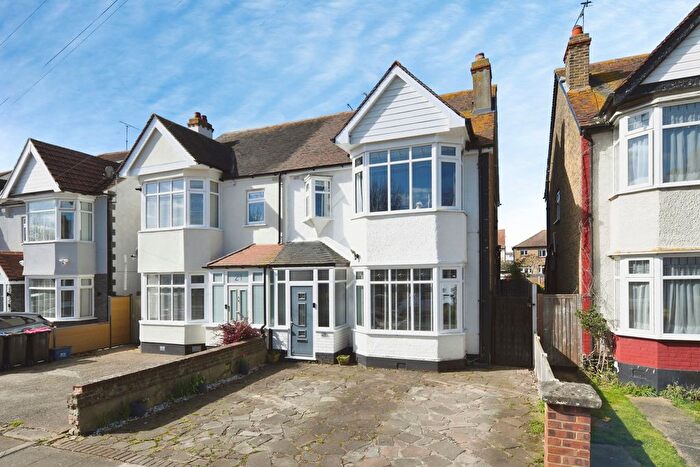
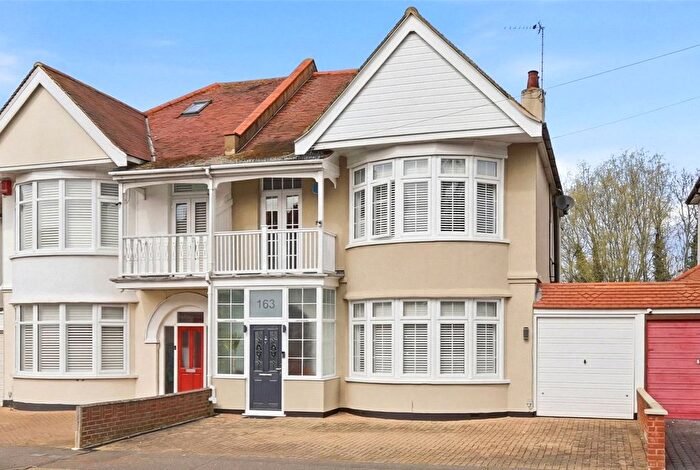
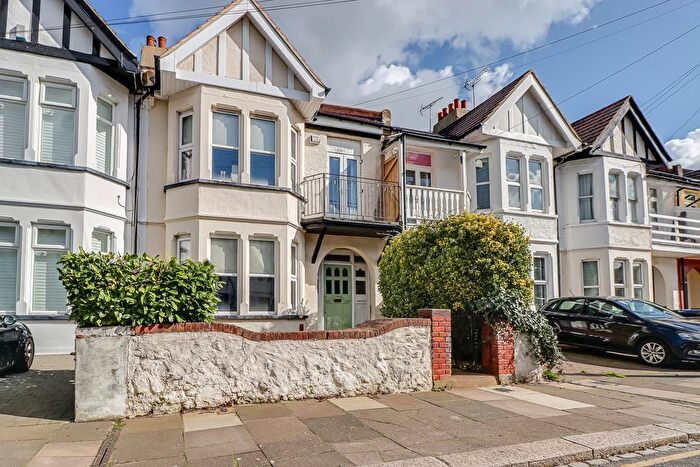
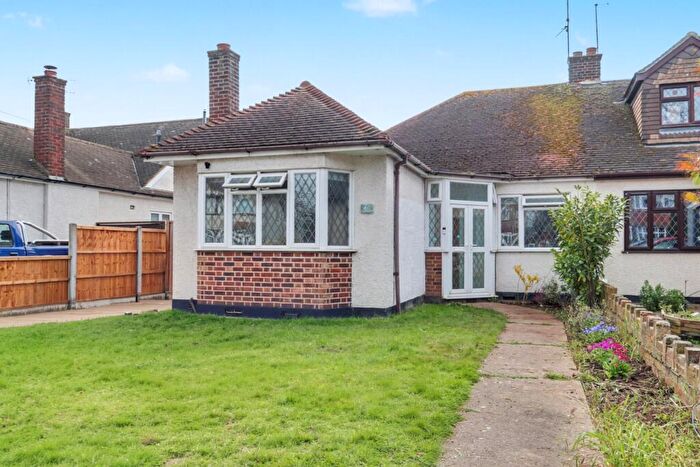
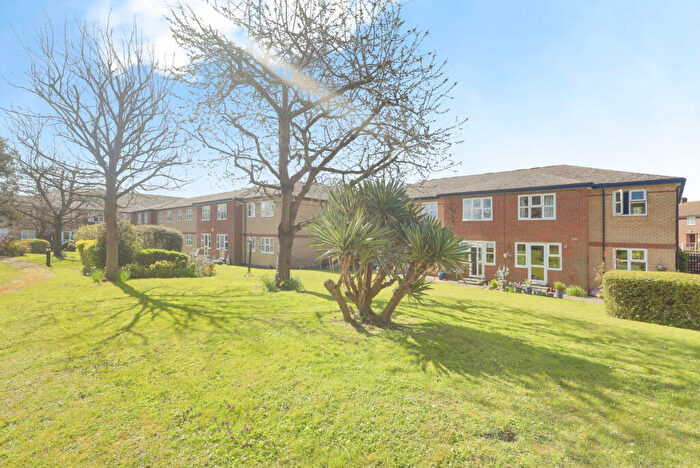
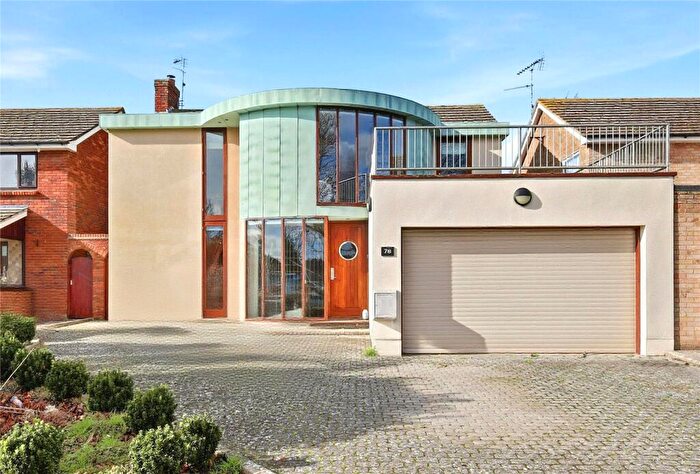
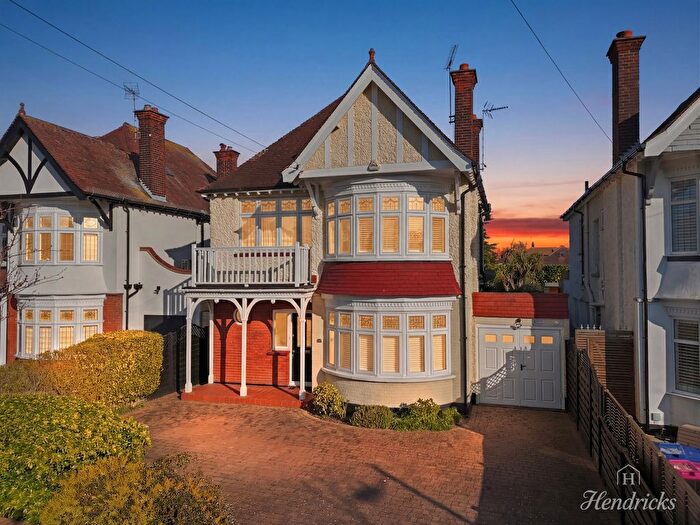
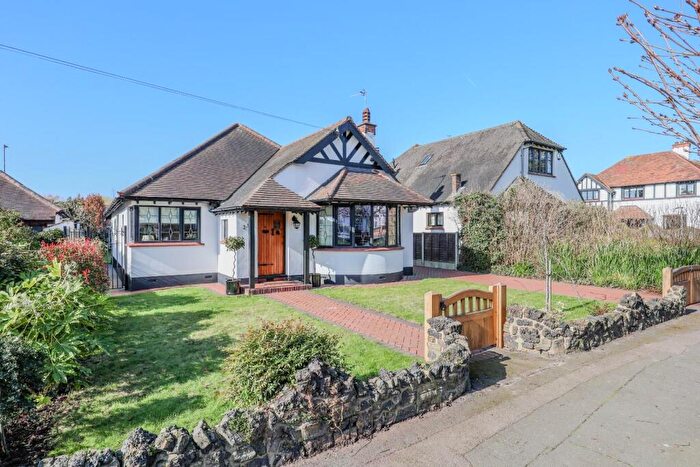
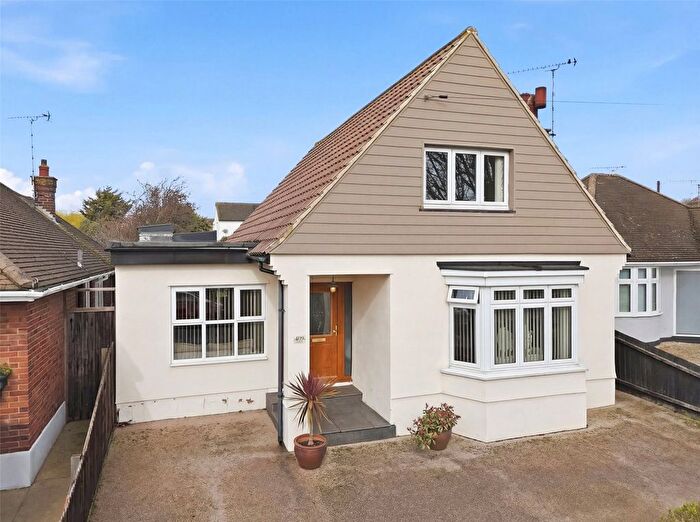
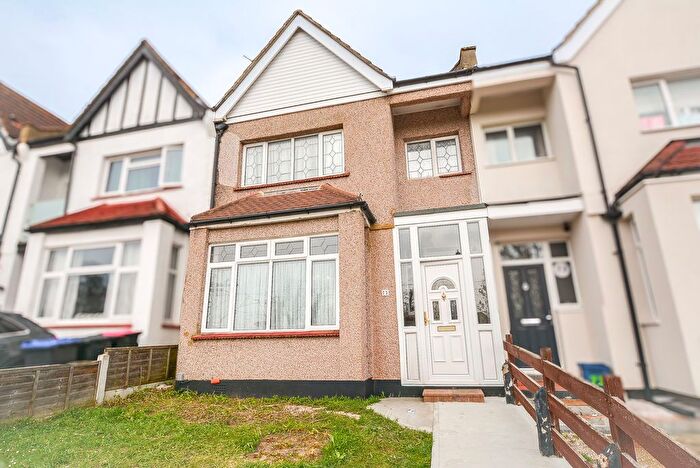
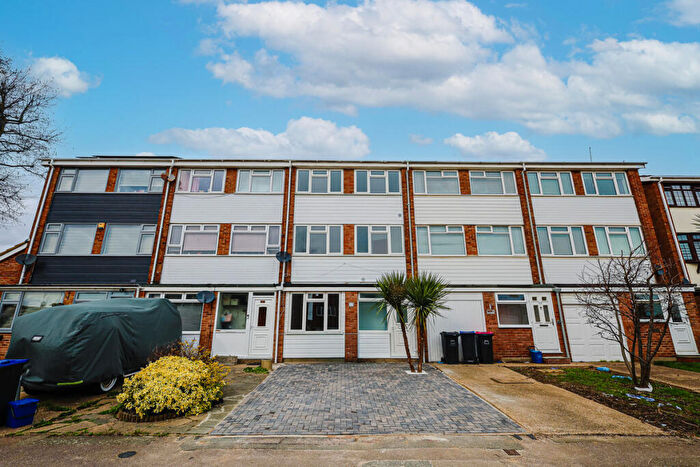
Properties for sale in Thorpe
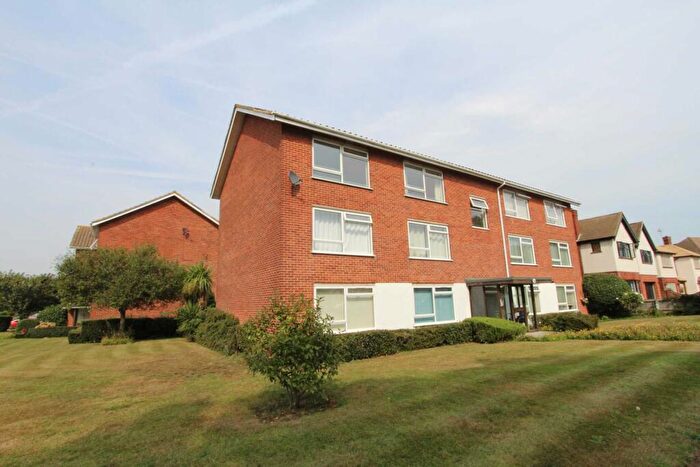
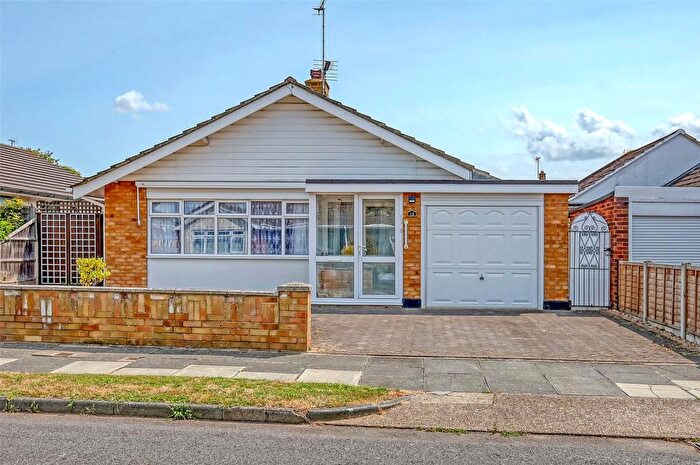
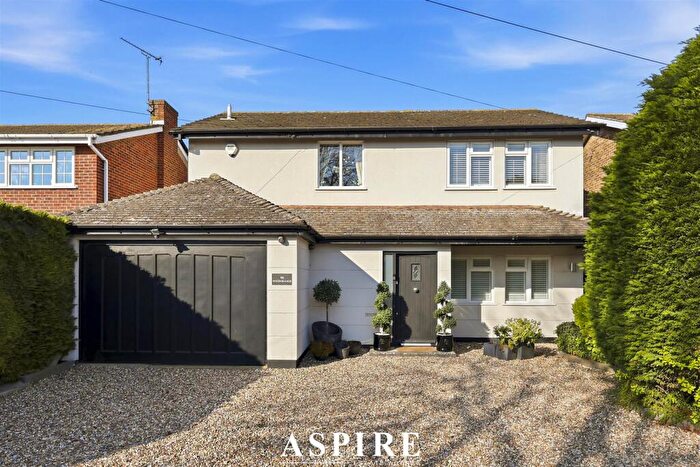
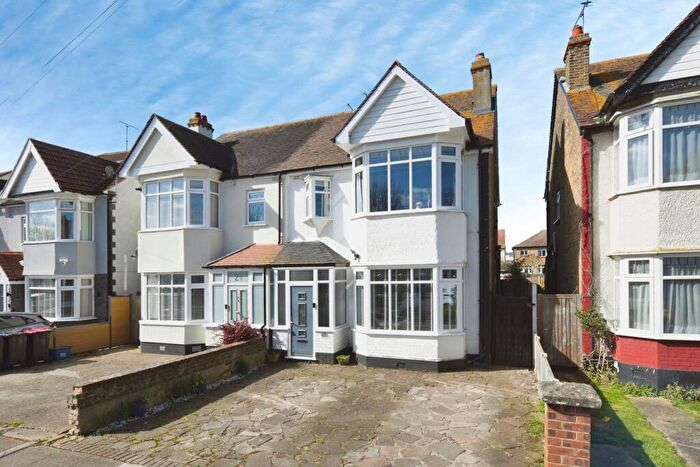
![]()
If you are looking to sell your house, let it out, or receive a property valuation, an expert can help you.
Click the button below to get started.


Roads and Postcodes in Thorpe
Navigate through our locations to find the location of your next house in Thorpe, Southend-on-sea for sale or to rent.
Transport near Thorpe
-
 Thorpe Bay Station
 -
Southend East Station
-
Southend Central Station
-
Southend Victoria Station
-
Shoeburyness Station
-
Prittlewell Station
-
Westcliff Station
- FAQ
- Price Paid By Year
- Property Type Price
Frequently asked questions about Thorpe
What is the average price for a property for sale in Thorpe?
The average price for a property for sale in Thorpe is £514,395. This amount is 51% higher than the average price in Southend-on-sea. There are 2,391 property listings for sale in Thorpe.
What streets have the most expensive properties for sale in Thorpe?
The streets with the most expensive properties for sale in Thorpe are Thorpe Bay Gardens at an average of £1,612,500, Thorpe Esplanade at an average of £1,300,000 and Burges Road at an average of £970,000.
What streets have the most affordable properties for sale in Thorpe?
The streets with the most affordable properties for sale in Thorpe are Plas Newydd at an average of £210,833, Camper Road at an average of £212,400 and Station Road at an average of £221,293.
Which train stations are available in or near Thorpe?
Some of the train stations available in or near Thorpe are Thorpe Bay, Southend East and Southend Central.
Property Price Paid in Thorpe by Year
The average sold property price by year was:
| Year | Average Sold Price | Price Change |
Sold Properties
|
|---|---|---|---|
| 2026 | £397,500 | -29% |
4 Properties |
| 2025 | £512,344 | 4% |
117 Properties |
| 2024 | £494,304 | -11% |
159 Properties |
| 2023 | £549,549 | 6% |
111 Properties |
| 2022 | £517,202 | 4% |
196 Properties |
| 2021 | £498,995 | 10% |
222 Properties |
| 2020 | £448,732 | 7% |
155 Properties |
| 2019 | £419,255 | -9% |
157 Properties |
| 2018 | £455,961 | 7% |
199 Properties |
| 2017 | £426,157 | 8% |
183 Properties |
| 2016 | £393,078 | 17% |
187 Properties |
| 2015 | £326,946 | 8% |
204 Properties |
| 2014 | £300,653 | 11% |
216 Properties |
| 2013 | £268,940 | -7% |
175 Properties |
| 2012 | £289,086 | -0,2% |
143 Properties |
| 2011 | £289,802 | -6% |
163 Properties |
| 2010 | £307,202 | 21% |
160 Properties |
| 2009 | £243,426 | -15% |
150 Properties |
| 2008 | £279,723 | 2% |
116 Properties |
| 2007 | £274,425 | 14% |
229 Properties |
| 2006 | £236,629 | 1% |
276 Properties |
| 2005 | £233,126 | 3% |
199 Properties |
| 2004 | £225,008 | 1% |
228 Properties |
| 2003 | £221,656 | 20% |
253 Properties |
| 2002 | £176,507 | 21% |
246 Properties |
| 2001 | £138,674 | 1% |
280 Properties |
| 2000 | £137,622 | 20% |
228 Properties |
| 1999 | £109,528 | 6% |
253 Properties |
| 1998 | £102,458 | 10% |
214 Properties |
| 1997 | £92,083 | 14% |
273 Properties |
| 1996 | £79,083 | 5% |
236 Properties |
| 1995 | £75,504 | - |
218 Properties |
Property Price per Property Type in Thorpe
Here you can find historic sold price data in order to help with your property search.
The average Property Paid Price for specific property types in the last three years are:
| Property Type | Average Sold Price | Sold Properties |
|---|---|---|
| Flat | £259,247.00 | 119 Flats |
| Semi Detached House | £522,739.00 | 108 Semi Detached Houses |
| Detached House | £773,467.00 | 128 Detached Houses |
| Terraced House | £411,625.00 | 36 Terraced Houses |