
Houses for sale & to rent in Southchurch, Southend-on-sea
House Prices in Southchurch
Properties in Southchurch have an average house price of £439,562.00 and had 404 Property Transactions within the last 3 years¹.
Southchurch is an area in Southend-on-sea, Southend-on-Sea with 4,080 households², where the most expensive property was sold for £1,300,000.00.
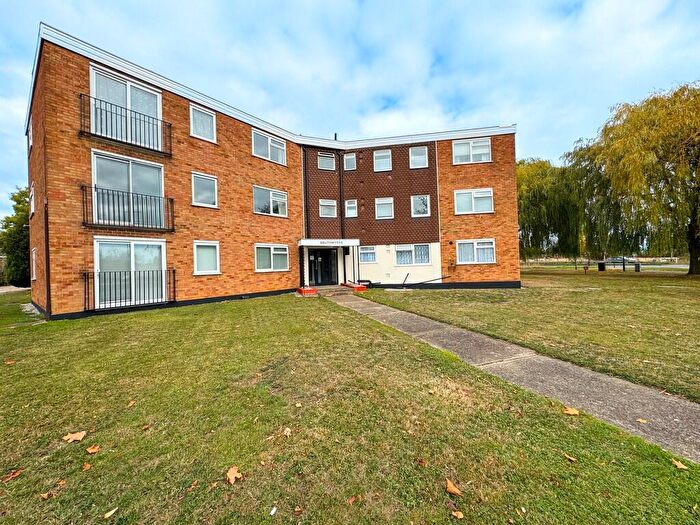
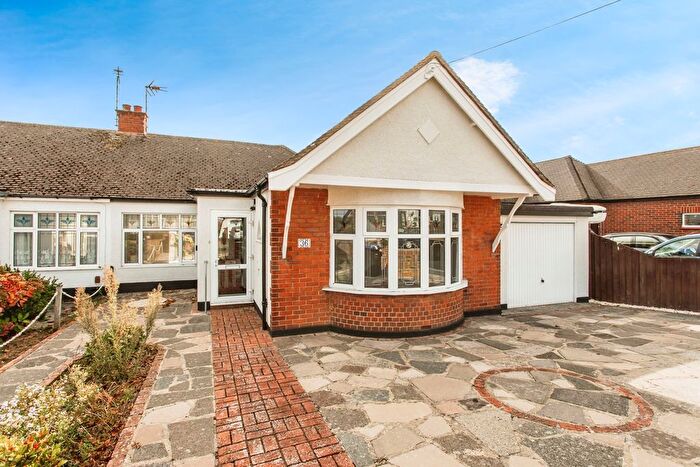
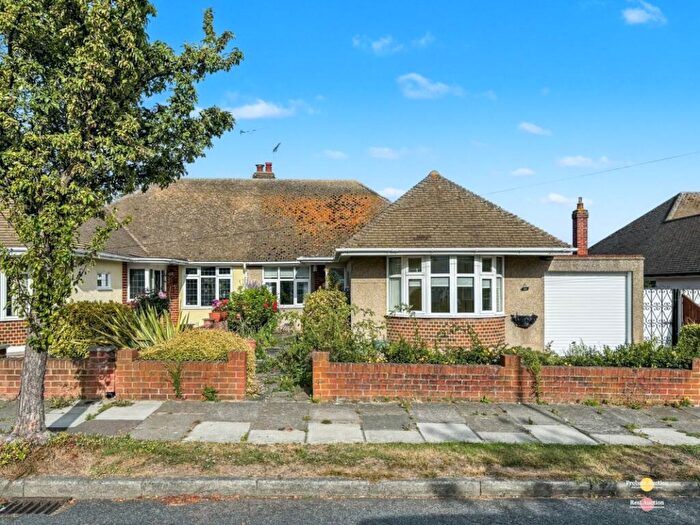
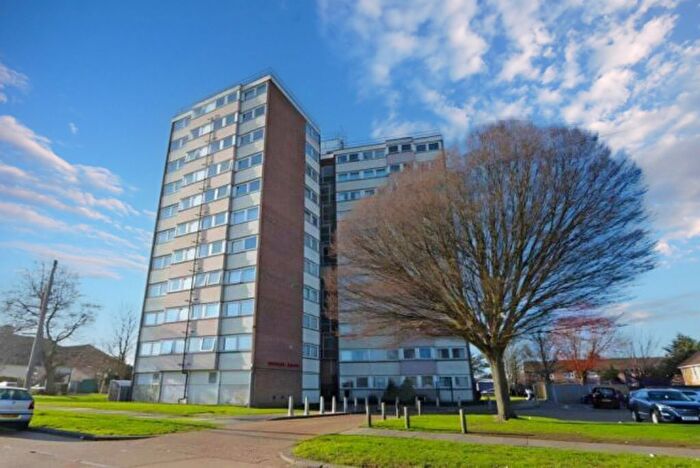
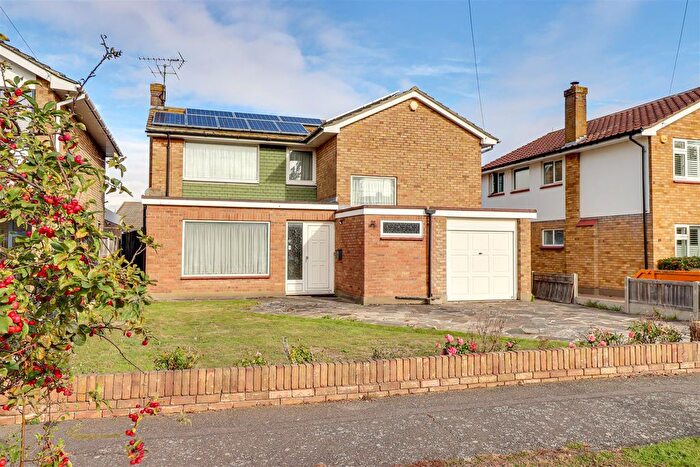
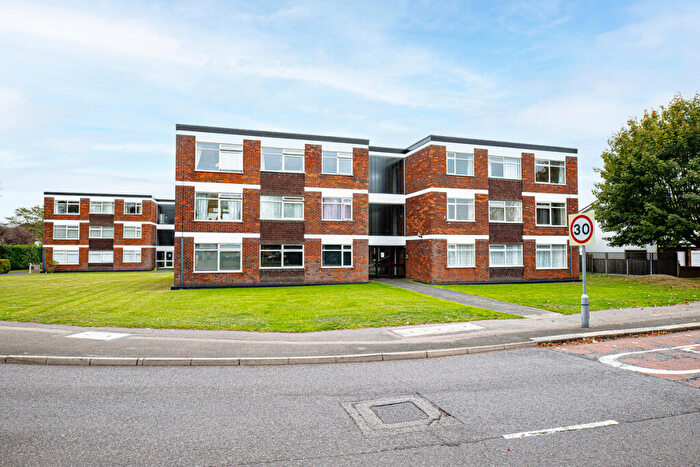
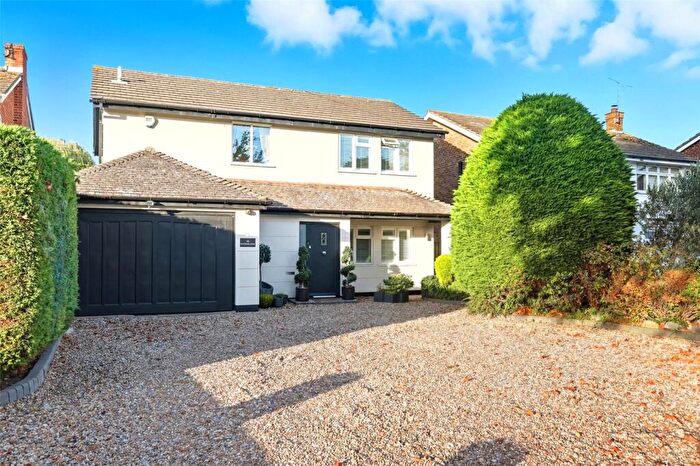
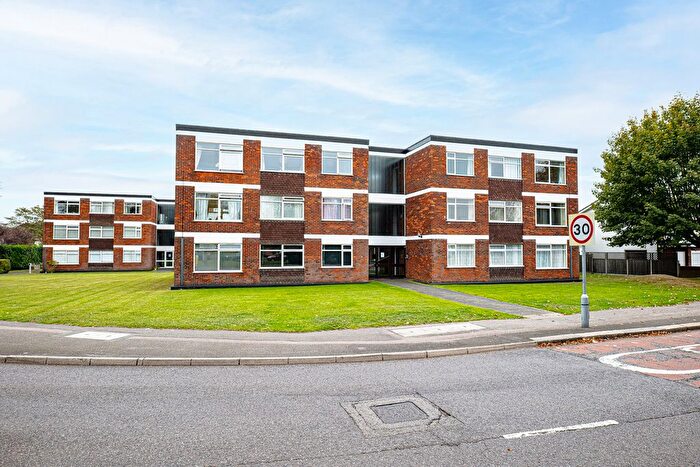
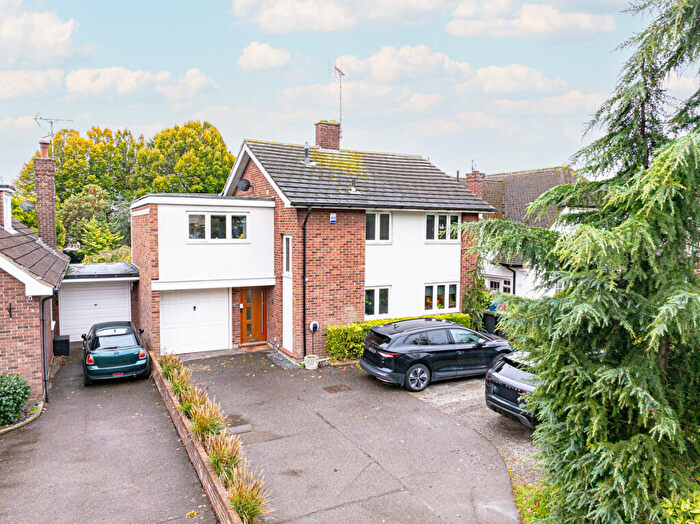
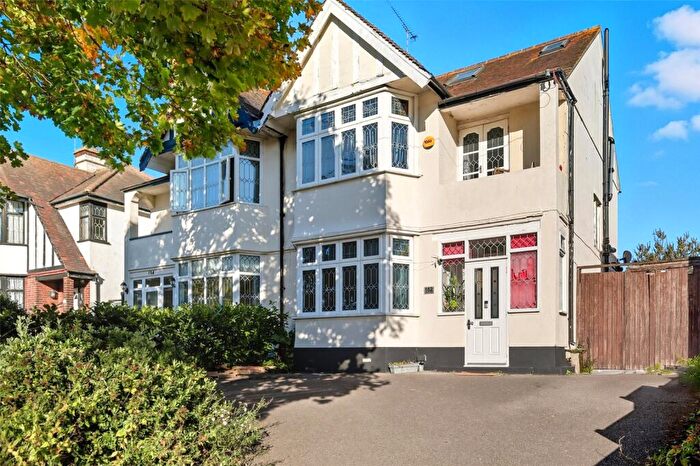
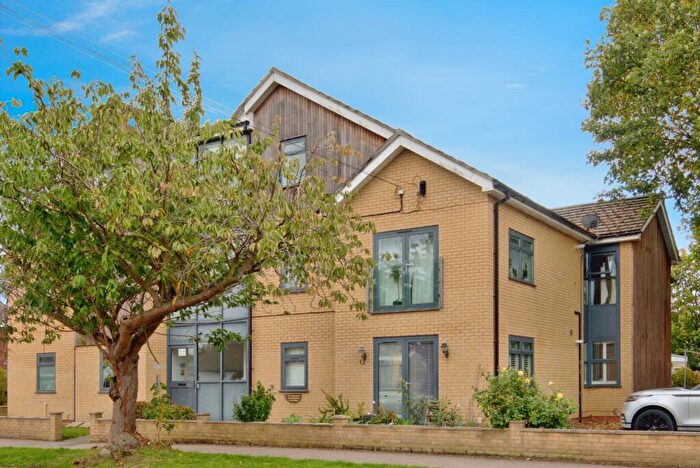
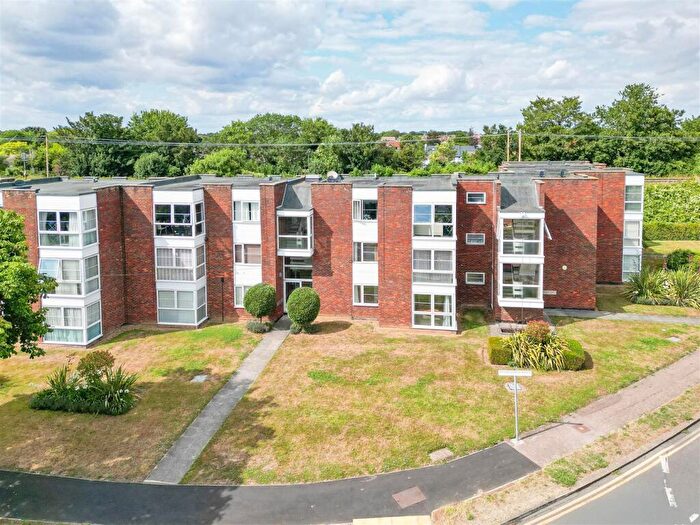
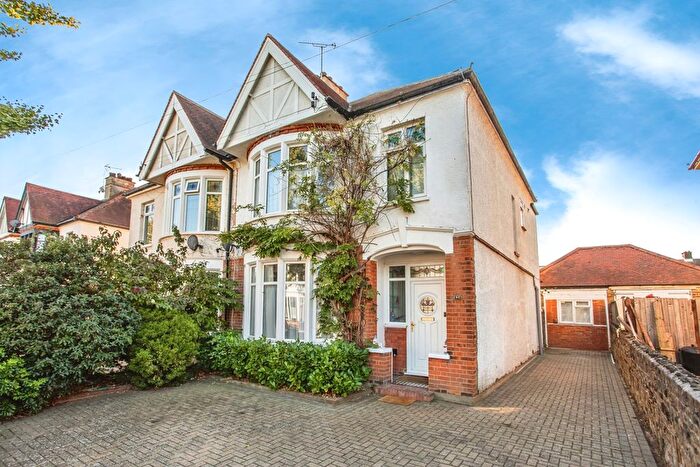
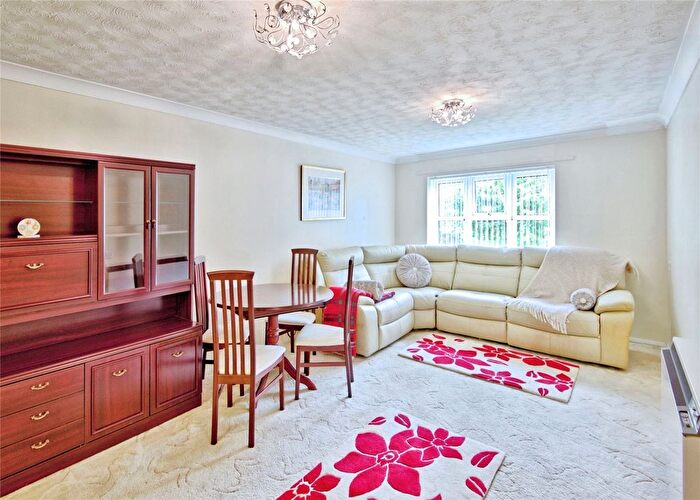
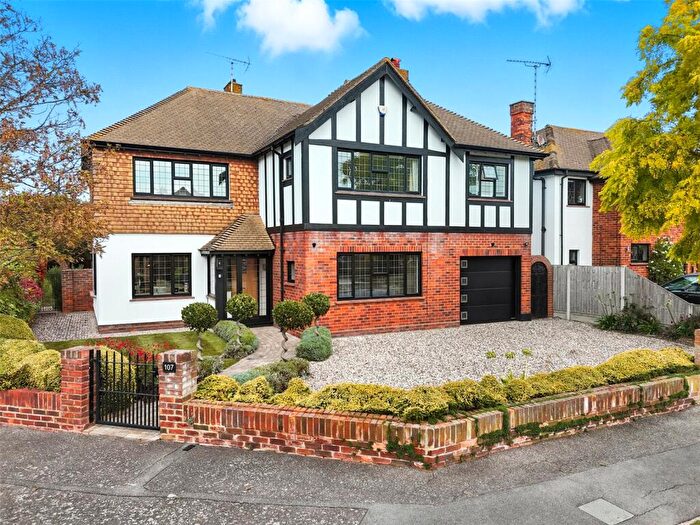
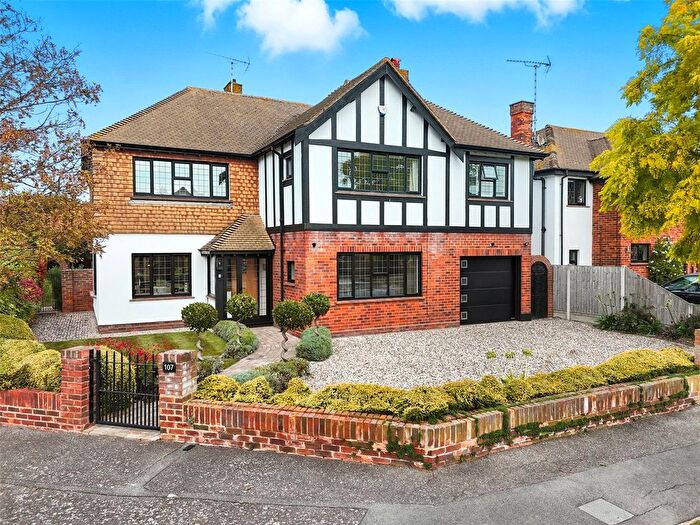
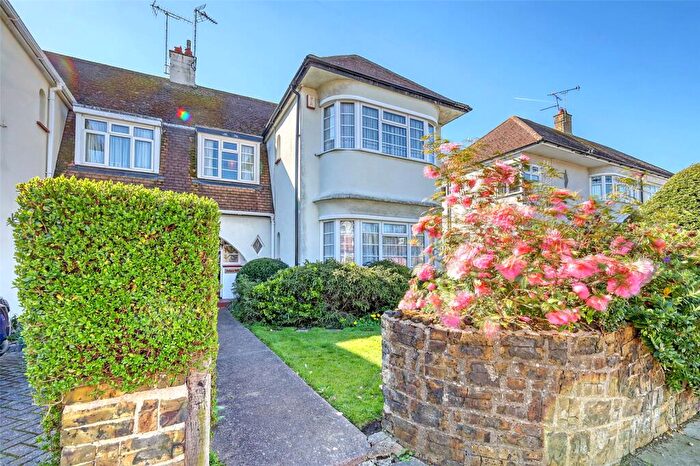
Properties for sale in Southchurch

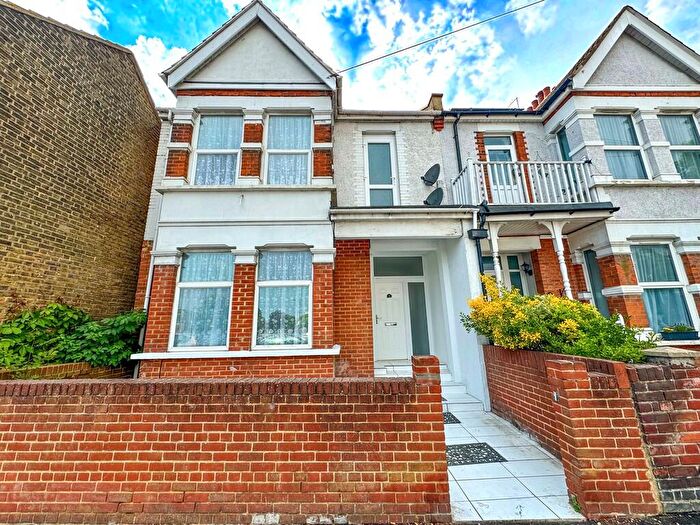

![]()
If you are looking to sell your house, let it out, or receive a property valuation, an expert can help you.
Click the button below to get started.


Roads and Postcodes in Southchurch
Navigate through our locations to find the location of your next house in Southchurch, Southend-on-sea for sale or to rent.
| Streets | Postcodes |
|---|---|
| Fox Hall Lane | SS2 4PT |
| Apollo Drive | SS2 4GU |
| Appletree Close | SS2 4QX |
| Archer Avenue | SS2 4QH SS2 4QQ SS2 4QT SS2 4QU SS2 4QZ SS2 4RA |
| Archer Close | SS2 4QY |
| Arlington Road | SS2 4UN SS2 4UW |
| Armitage Road | SS1 3RR |
| Ashurst Avenue | SS2 4TD SS2 4TE SS2 4TF SS2 4TJ SS2 4TL |
| Athena Close | SS2 4GL |
| Barnstaple Close | SS1 3PD |
| Barnstaple Road | SS1 3PA SS1 3PB SS1 3PL SS1 3PN SS1 3PP SS1 3PW SS1 3QH |
| Bournes Green | SS1 3RB |
| Bournes Green Chase | SS1 3SB |
| Bovinger Way | SS1 3SZ |
| Boyden Close | SS2 4SB |
| Branscombe Gardens | SS1 3PJ |
| Branscombe Square | SS1 3QD |
| Brighton Avenue | SS1 2QN |
| Broadclyst Close | SS1 3QR |
| Broadclyst Gardens | SS1 3QP SS1 3QS SS1 3QT SS1 3QU SS1 3QY |
| Burleigh Square | SS1 3PH |
| Burlescoombe Close | SS1 3QQ |
| Burlescoombe Leas | SS1 3QF |
| Burlescoombe Road | SS1 3PS SS1 3PT SS1 3QB SS1 3QE SS1 3QG |
| Canterbury Avenue | SS2 4QL SS2 4QR |
| Castleton Road | SS2 4UD SS2 4UF |
| Chadacre Road | SS1 3QX |
| Chaingate Avenue | SS2 4SW |
| Cherrybrook | SS1 3QZ |
| Chichester Road | SS1 2NH |
| Chinchilla Road | SS1 2QJ SS1 2QL |
| Claters Close | SS2 4SA |
| Coptfold Close | SS1 3SY |
| Daines Close | SS1 3PG |
| Daines Way | SS1 3PE SS1 3PF SS1 3PQ |
| Dalmatia Road | SS1 2QG SS1 2QQ |
| Droitwich Avenue | SS2 4PG |
| Eldbert Close | SS2 4SQ |
| Eros Avenue | SS2 4GN SS2 4GY |
| Fernbrook Avenue | SS1 2QW |
| Fortescue Chase | SS1 3SS |
| Glynde Way | SS2 4TR SS2 4TS SS2 4TT |
| Hamstel Mews | SS2 4PL |
| Hamstel Road | SS2 4LA SS2 4LB SS2 4LD SS2 4LE SS2 4NF SS2 4PF SS2 4PH SS2 4PP SS2 4PQ |
| Hera Close | SS2 4GP SS2 4GQ |
| Ladram Close | SS1 3PU |
| Ladram Road | SS1 3PX SS1 3PY |
| Ladram Way | SS1 3PZ |
| Lifstan Walk | SS2 4GW |
| Lifstan Way | SS1 2XY |
| Lincoln Chase | SS2 4QS |
| Lincoln Close | SS2 4FP |
| Little Thorpe | SS1 3RN SS1 3RW |
| Lloyd Wise Close | SS2 4QJ |
| Locksley Close | SS2 4XL |
| Maplin Way North | SS1 3NU SS1 3NX SS1 3NY |
| Moat End | SS1 3QA |
| Navestock Gardens | SS1 3SR |
| Newington Avenue | SS2 4RD SS2 4RE SS2 4RZ SS2 4SD SS2 4SE SS2 4SG SS2 4SN SS2 4SP |
| Newington Close | SS2 4SF |
| Newington Gardens | SS2 4FN |
| Oakleigh Avenue | SS1 2QR |
| Pavilion Close | SS2 4TZ |
| Pelham Road | SS2 4UH |
| Petworth Gardens | SS2 4TG |
| Philpott Avenue | SS2 4RJ SS2 4RL |
| Pilgrims Close | SS2 4XF |
| Pleshey Close | SS1 3SP |
| Plymtree | SS1 3RA |
| Poynings Avenue | SS2 4RS SS2 4RT SS2 4RU SS2 4RX SS2 4RY |
| Rebels Lane | SS3 0QE SS3 0QF |
| Riviera Drive | SS1 2QH |
| Roedean Close | SS2 4TH |
| Roedean Gardens | SS2 4TQ |
| Sackville Road | SS2 4UG SS2 4UQ |
| Samuels Drive | SS1 3PR |
| Sherwood Way | SS2 4SR SS2 4SS SS2 4ST SS2 4SU |
| Shoebury Road | SS1 3RG SS1 3RJ SS1 3RL SS1 3RP SS1 3RQ SS1 3RS |
| Southchurch Boulevard | SS2 4UA SS2 4UL SS2 4UP SS2 4UR SS2 4UT SS2 4UU SS2 4UX SS2 4UY SS2 4UZ SS2 4XA SS2 4UB |
| Southchurch Rectory Chase | SS2 4XB SS2 4XE |
| Southchurch Road | SS1 2PP SS1 2PS |
| Steyning Avenue | SS2 4TP SS2 4TW |
| Surbiton Avenue | SS1 2QS SS1 2NJ |
| The Willows | SS1 3SH |
| Thorpe Hall Avenue | SS1 3SD SS1 3SE SS1 3SF SS1 3SG SS1 3SJ |
| Thorpe Hall Close | SS1 3SQ |
| Thurston Avenue | SS2 4UJ |
| Vallance Close | SS2 4RB |
| Vaughan Avenue | SS2 4UE |
| Wakering Road | SS3 0PY SS3 0PZ SS3 0QA SS1 3RD SS3 0PW |
| Wansfell Gardens | SS1 3ST SS1 3SW |
| Waterhale | SS1 3SU |
| Welch Close | SS2 4SH |
| Whittingham Avenue | SS2 4RF SS2 4RG SS2 4RQ SS2 4JA SS2 4RH SS2 4WA |
| Wick Chase | SS2 4TN |
| Wickmead Close | SS2 4SJ |
| Willingale Way | SS1 3SL SS1 3SN SS1 3SX SS1 3TA |
| Zeus Road | SS2 4GE SS2 4GS |
Transport near Southchurch
-
 Thorpe Bay Station
 -
Southend East Station
-
Southend Victoria Station
-
Southend Central Station
-
Prittlewell Station
-
Shoeburyness Station
-
Westcliff Station
-
Southend Airport Station
- FAQ
- Price Paid By Year
- Property Type Price
Frequently asked questions about Southchurch
What is the average price for a property for sale in Southchurch?
The average price for a property for sale in Southchurch is £439,562. This amount is 30% higher than the average price in Southend-on-sea. There are 2,116 property listings for sale in Southchurch.
What streets have the most expensive properties for sale in Southchurch?
The streets with the most expensive properties for sale in Southchurch are Moat End at an average of £981,000, Daines Close at an average of £980,000 and Coptfold Close at an average of £882,500.
What streets have the most affordable properties for sale in Southchurch?
The streets with the most affordable properties for sale in Southchurch are Whittingham Avenue at an average of £90,750, Southchurch Rectory Chase at an average of £150,909 and Southchurch Road at an average of £167,833.
Which train stations are available in or near Southchurch?
Some of the train stations available in or near Southchurch are Thorpe Bay, Southend East and Southend Victoria.
Property Price Paid in Southchurch by Year
The average sold property price by year was:
| Year | Average Sold Price | Price Change |
Sold Properties
|
|---|---|---|---|
| 2025 | £436,822 | -1% |
50 Properties |
| 2024 | £441,049 | -2% |
101 Properties |
| 2023 | £448,228 | 3% |
98 Properties |
| 2022 | £433,997 | 4% |
155 Properties |
| 2021 | £416,519 | 7% |
194 Properties |
| 2020 | £387,880 | 3% |
126 Properties |
| 2019 | £376,717 | -14% |
139 Properties |
| 2018 | £428,598 | 17% |
148 Properties |
| 2017 | £356,740 | 11% |
161 Properties |
| 2016 | £316,133 | 2% |
188 Properties |
| 2015 | £310,549 | 16% |
177 Properties |
| 2014 | £261,169 | -0,2% |
159 Properties |
| 2013 | £261,768 | -0,1% |
148 Properties |
| 2012 | £261,937 | 3% |
108 Properties |
| 2011 | £254,569 | -7% |
131 Properties |
| 2010 | £271,283 | 23% |
132 Properties |
| 2009 | £210,229 | -1% |
144 Properties |
| 2008 | £213,164 | -17% |
104 Properties |
| 2007 | £248,418 | 8% |
210 Properties |
| 2006 | £229,193 | 5% |
213 Properties |
| 2005 | £217,397 | 4% |
138 Properties |
| 2004 | £208,715 | 3% |
193 Properties |
| 2003 | £202,886 | 19% |
166 Properties |
| 2002 | £163,716 | 19% |
218 Properties |
| 2001 | £132,706 | 19% |
200 Properties |
| 2000 | £108,005 | 13% |
174 Properties |
| 1999 | £94,386 | 5% |
202 Properties |
| 1998 | £89,871 | 6% |
168 Properties |
| 1997 | £84,113 | 10% |
154 Properties |
| 1996 | £75,586 | 11% |
147 Properties |
| 1995 | £67,472 | - |
157 Properties |
Property Price per Property Type in Southchurch
Here you can find historic sold price data in order to help with your property search.
The average Property Paid Price for specific property types in the last three years are:
| Property Type | Average Sold Price | Sold Properties |
|---|---|---|
| Flat | £210,831.00 | 86 Flats |
| Semi Detached House | £443,250.00 | 102 Semi Detached Houses |
| Detached House | £688,627.00 | 126 Detached Houses |
| Terraced House | £305,255.00 | 90 Terraced Houses |