
Houses for sale & to rent in Rainford, St Helens
House Prices in Rainford
Properties in Rainford have an average house price of £293k and had 334 Property Transactions within the last 3 years¹.
Rainford is an area in St Helens, St. Helens with 3,516 households², where the most expensive property was sold for £4.23M.
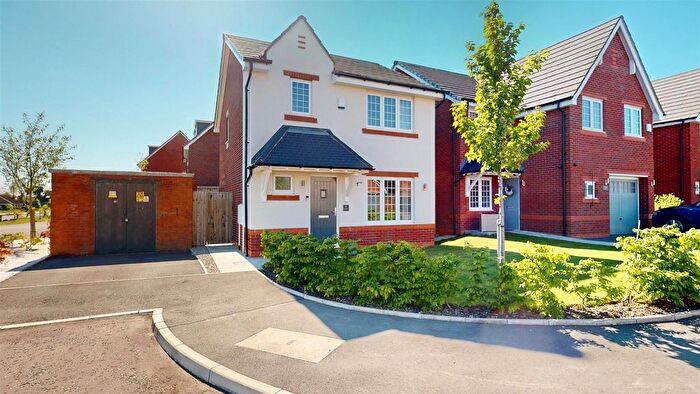
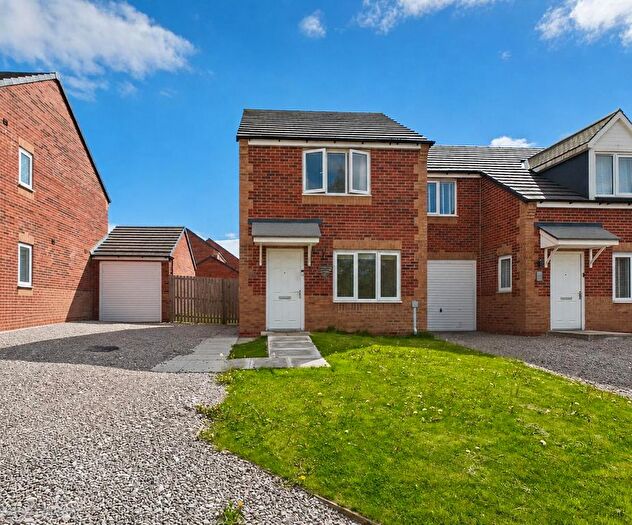
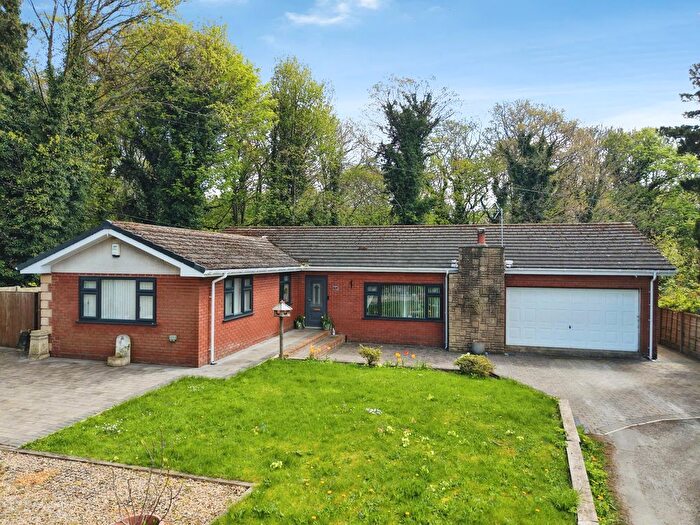
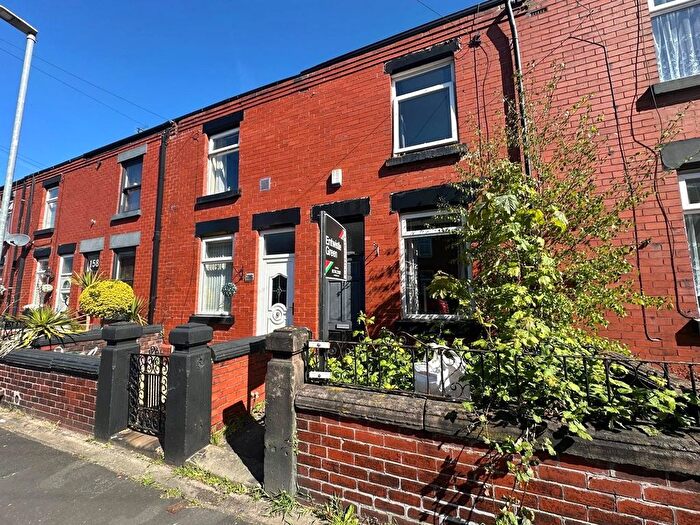
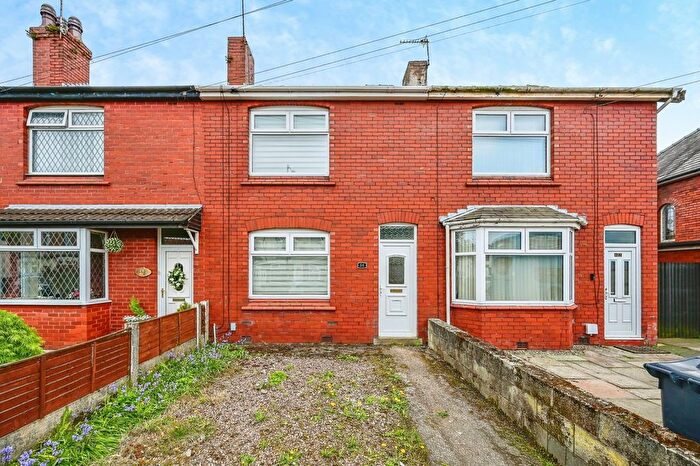
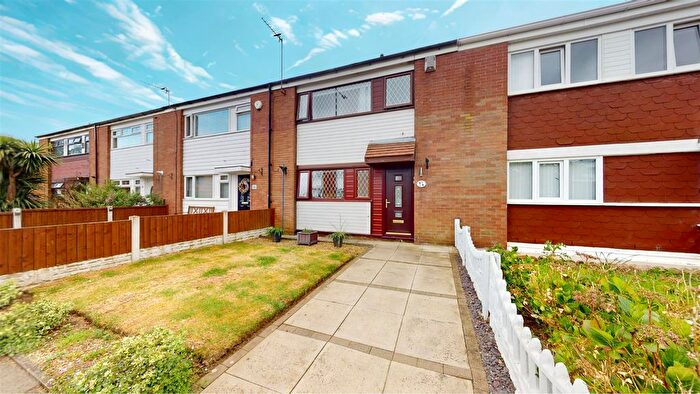
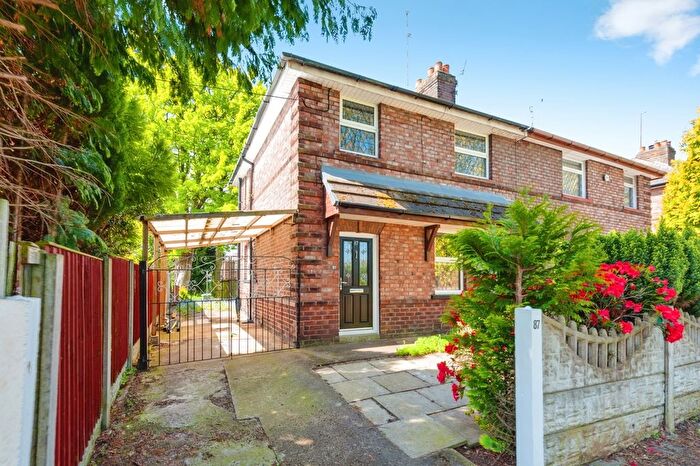
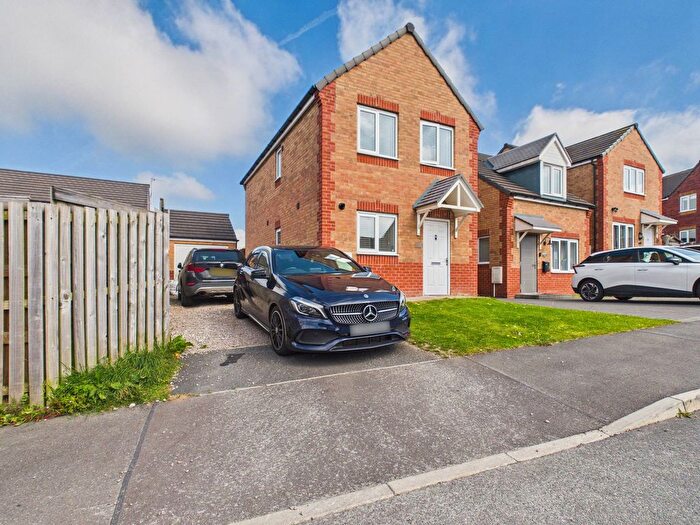
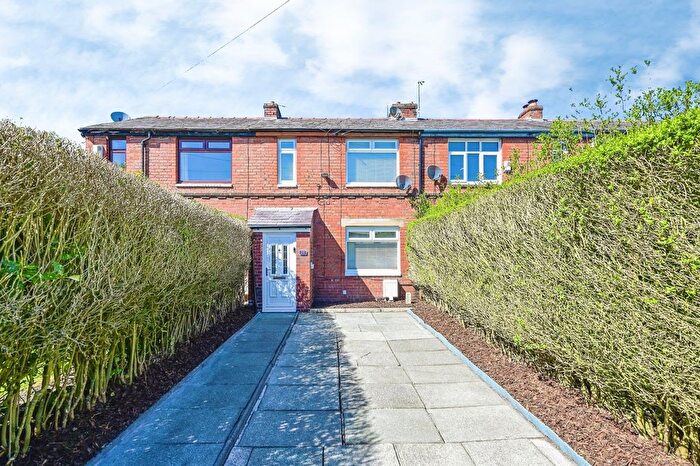
Properties for sale in Rainford
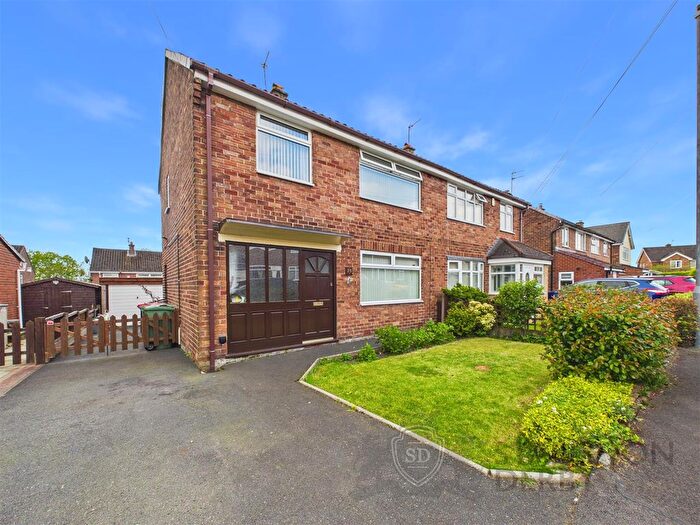
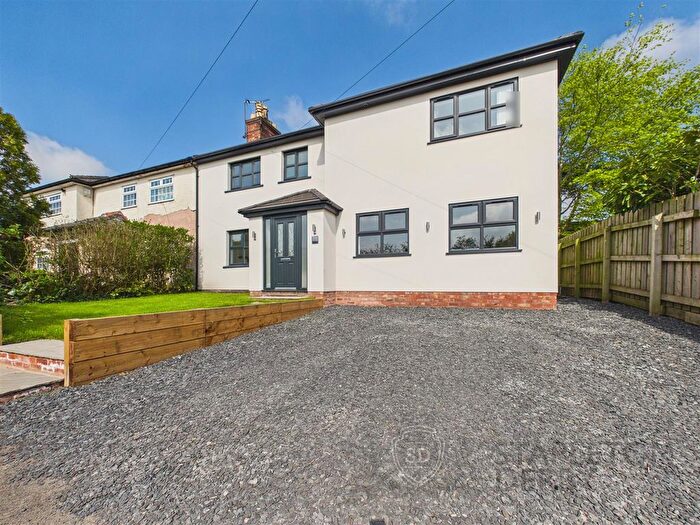
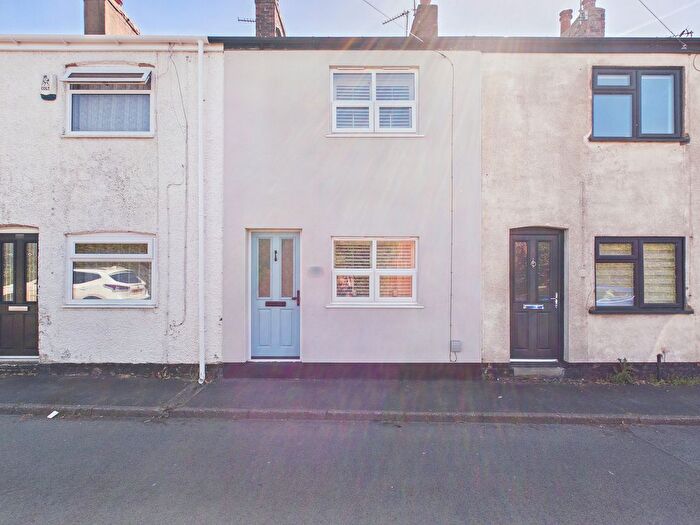
![]()
If you are looking to sell your house, let it out, or receive a property valuation, an expert can help you.
Click the button below to get started.

Roads and Postcodes in Rainford
Navigate through our locations to find the location of your next house in Rainford, St Helens for sale or to rent.
Transport near Rainford
-
 Rainford Station
 -
Upholland Station
-
Orrell Station
-
St.Helens Central Station
-
Thatto Heath Station
-
Garswood Station
-
Eccleston Park Station
- FAQ
- Price Paid By Year
- Property Type Price
Frequently asked questions about Rainford
What is the average price for a property for sale in Rainford?
The average price for a property for sale in Rainford is £293,486. This amount is 70% higher than the average price in St Helens. There are 3,567 property listings for sale in Rainford.
What streets have the most expensive properties for sale in Rainford?
The streets with the most expensive properties for sale in Rainford are Dairy Farm Road at an average of £1,267,875, Berringtons Lane at an average of £950,000 and Massam Close at an average of £950,000.
What streets have the most affordable properties for sale in Rainford?
The streets with the most affordable properties for sale in Rainford are Parklands at an average of £119,500, Coniston Way at an average of £132,000 and Springfield at an average of £135,500.
Which train stations are available in or near Rainford?
Some of the train stations available in or near Rainford are Rainford, Upholland and Orrell.
Property Price Paid in Rainford by Year
The average sold property price by year was:
| Year | Average Sold Price | Price Change |
Sold Properties
|
|---|---|---|---|
| 2026 | £314,125 | 9% |
4 Properties |
| 2025 | £287,378 | -10% |
100 Properties |
| 2024 | £315,427 | 15% |
132 Properties |
| 2023 | £269,323 | -5% |
98 Properties |
| 2022 | £281,786 | 17% |
110 Properties |
| 2021 | £235,205 | -1% |
141 Properties |
| 2020 | £238,651 | 1% |
108 Properties |
| 2019 | £236,399 | 6% |
116 Properties |
| 2018 | £221,315 | 5% |
106 Properties |
| 2017 | £211,245 | 8% |
146 Properties |
| 2016 | £194,170 | -0,5% |
110 Properties |
| 2015 | £195,048 | 3% |
132 Properties |
| 2014 | £188,702 | 6% |
128 Properties |
| 2013 | £177,063 | 8% |
102 Properties |
| 2012 | £162,701 | -17% |
63 Properties |
| 2011 | £189,783 | -3% |
77 Properties |
| 2010 | £194,786 | -5% |
69 Properties |
| 2009 | £205,008 | 4% |
59 Properties |
| 2008 | £196,575 | 3% |
68 Properties |
| 2007 | £190,228 | 9% |
139 Properties |
| 2006 | £173,928 | 6% |
117 Properties |
| 2005 | £164,072 | -4% |
105 Properties |
| 2004 | £170,731 | 15% |
147 Properties |
| 2003 | £145,327 | 17% |
126 Properties |
| 2002 | £120,247 | 21% |
131 Properties |
| 2001 | £95,530 | 14% |
142 Properties |
| 2000 | £82,630 | 2% |
132 Properties |
| 1999 | £81,321 | 9% |
156 Properties |
| 1998 | £73,883 | 4% |
102 Properties |
| 1997 | £71,260 | -1% |
148 Properties |
| 1996 | £71,676 | 8% |
118 Properties |
| 1995 | £65,733 | - |
92 Properties |
Property Price per Property Type in Rainford
Here you can find historic sold price data in order to help with your property search.
The average Property Paid Price for specific property types in the last three years are:
| Property Type | Average Sold Price | Sold Properties |
|---|---|---|
| Flat | £130,807.00 | 13 Flats |
| Semi Detached House | £254,835.00 | 178 Semi Detached Houses |
| Detached House | £471,562.00 | 84 Detached Houses |
| Terraced House | £192,406.00 | 59 Terraced Houses |