
Houses for sale & to rent in WA10 5EX, Lester Drive, Eccleston, St Helens
House Prices in WA10 5EX, Lester Drive, Eccleston
Properties in WA10 5EX have no sales history available within the last 3 years. WA10 5EX is a postcode in Lester Drive located in Eccleston, an area in St Helens, St. Helens, with 3 households².
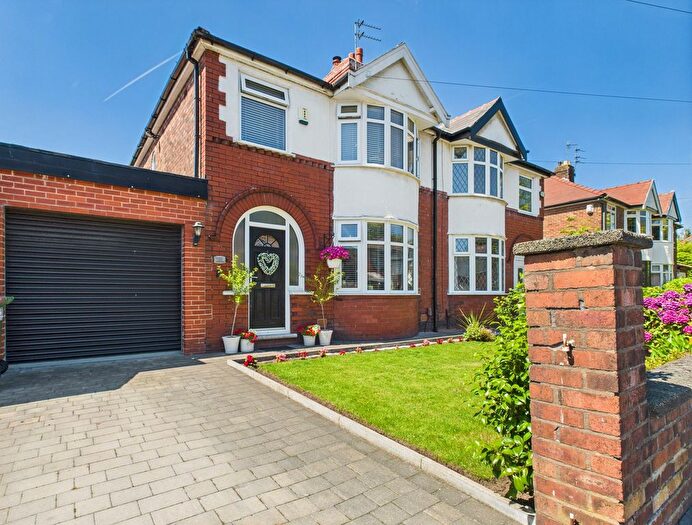
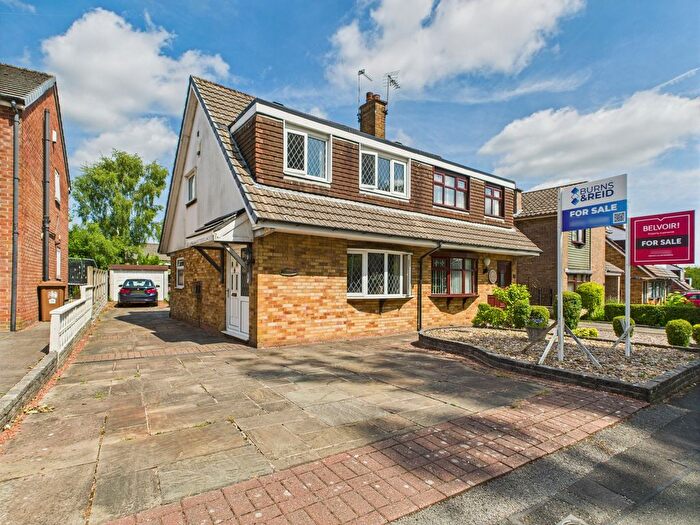
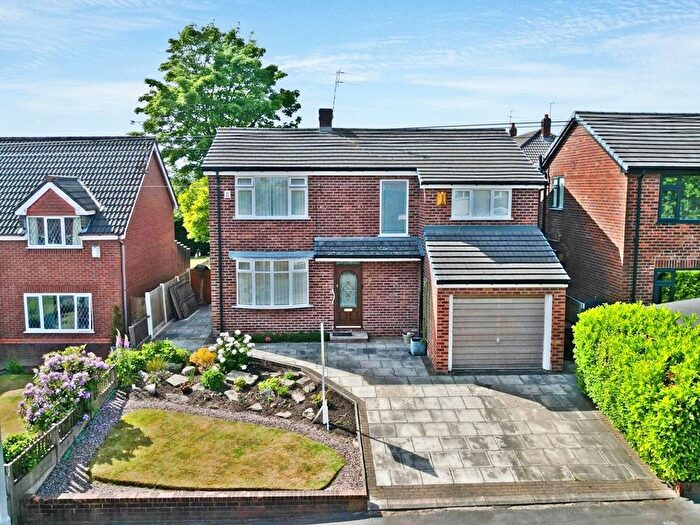
Properties for sale near WA10 5EX, Lester Drive


![]()
If you are looking to sell your house, let it out, or receive a property valuation, an expert can help you.
Click the button below to get started.


Price Paid in Lester Drive, WA10 5EX, Eccleston
15 Lester Drive, WA10 5EX, Eccleston St Helens
Property 15 has been sold 3 times. The last time it was sold was in 18/03/2016 and the sold price was £180,000.00.
This semi detached house, sold as a freehold on 18/03/2016, is a 96 sqm semi-detached house with an EPC rating of E.
| Date | Price | Property Type | Tenure | Classification |
|---|---|---|---|---|
| 18/03/2016 | £180,000.00 | Semi Detached House | freehold | Established Building |
| 03/11/2015 | £72,000.00 | Semi Detached House | freehold | Established Building |
| 04/02/2000 | £45,000.00 | Semi Detached House | freehold | Established Building |
19 Lester Drive, WA10 5EX, Eccleston St Helens
Property 19 has been sold 1 time. The last time it was sold was in 22/03/2013 and the sold price was £159,000.00.
This semi detached house, sold as a freehold on 22/03/2013, is a 84 sqm semi-detached house with an EPC rating of D.
| Date | Price | Property Type | Tenure | Classification |
|---|---|---|---|---|
| 22/03/2013 | £159,000.00 | Semi Detached House | freehold | Established Building |
Postcodes in Lester Drive, Eccleston
Navigate through other locations in Lester Drive, Eccleston, St Helens to see more property listings for sale or to rent.
Transport near WA10 5EX, Lester Drive
-
 Thatto Heath Station
 -
Eccleston Park Station
-
St.Helens Central Station
-
Prescot Station
-
Rainhill Station
House price paid reports for WA10 5EX, Lester Drive
Click on the buttons below to see price paid reports by year or property price:
- Price Paid By Year
Property Price Paid in WA10 5EX, Lester Drive by Year
The average sold property price by year was:
| Year | Average Sold Price | Price Change |
Sold Properties
|
|---|---|---|---|
| 2016 | £180,000 | 60% |
1 Property |
| 2015 | £72,000 | -121% |
1 Property |
| 2013 | £159,000 | 72% |
1 Property |
| 2000 | £45,000 | - |
1 Property |