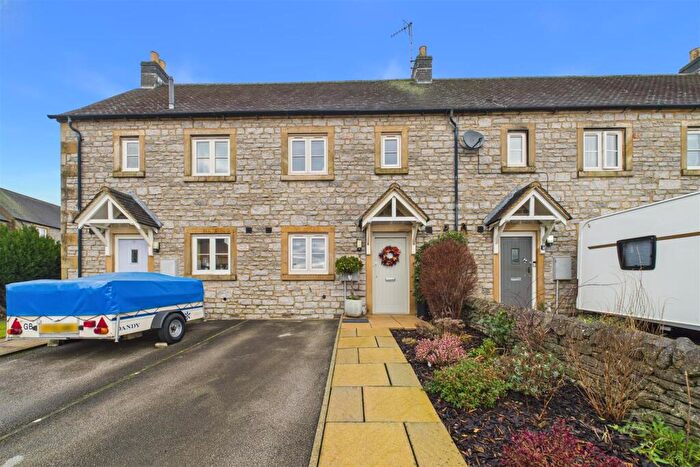
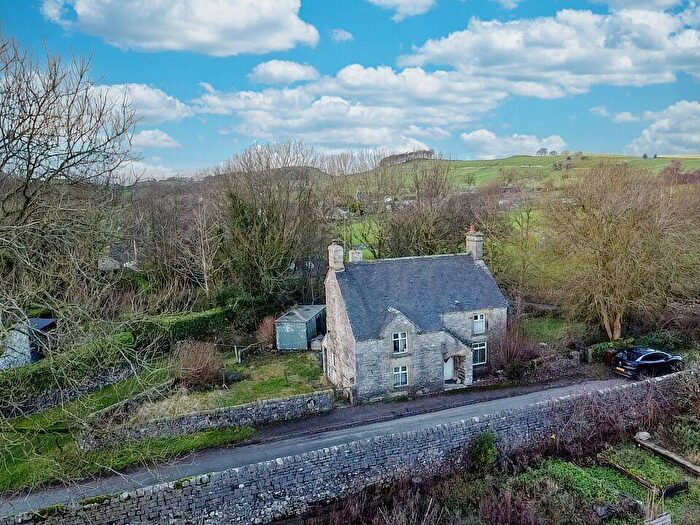
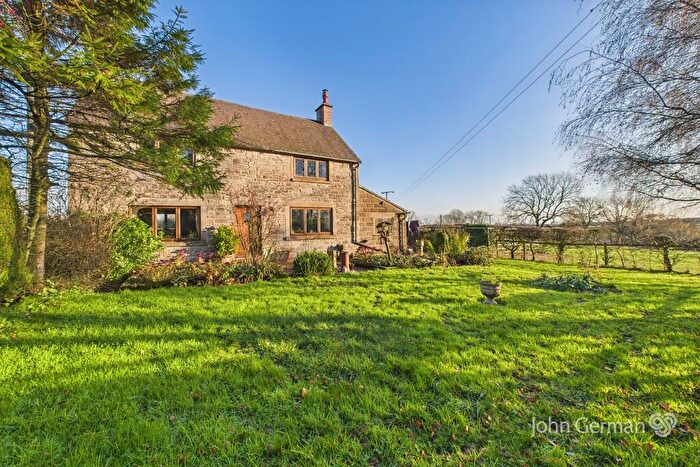
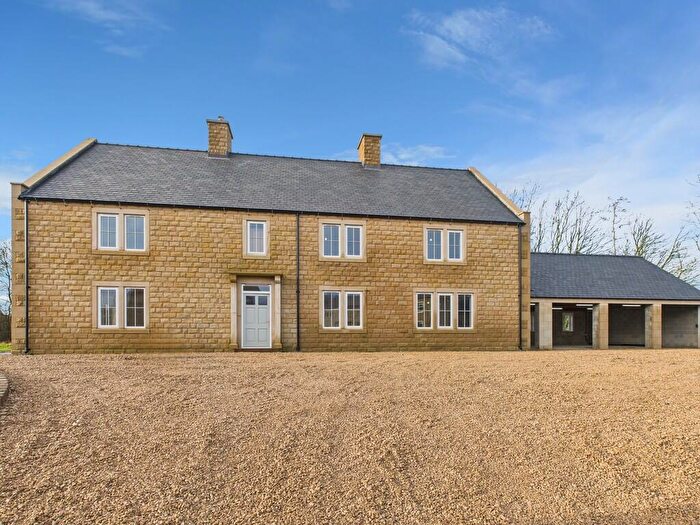
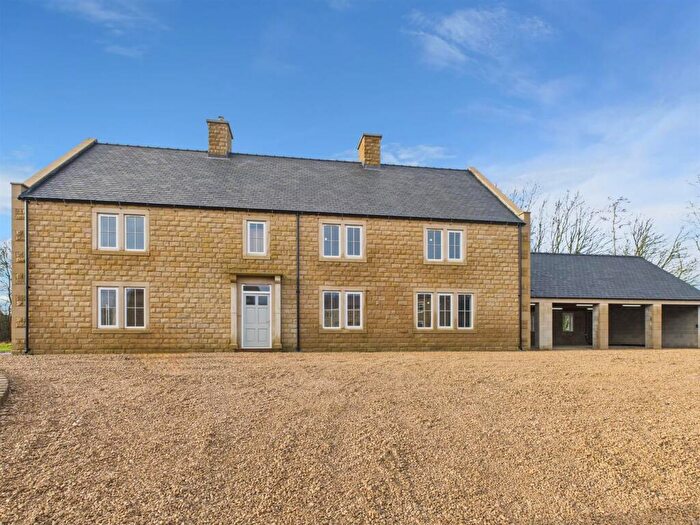
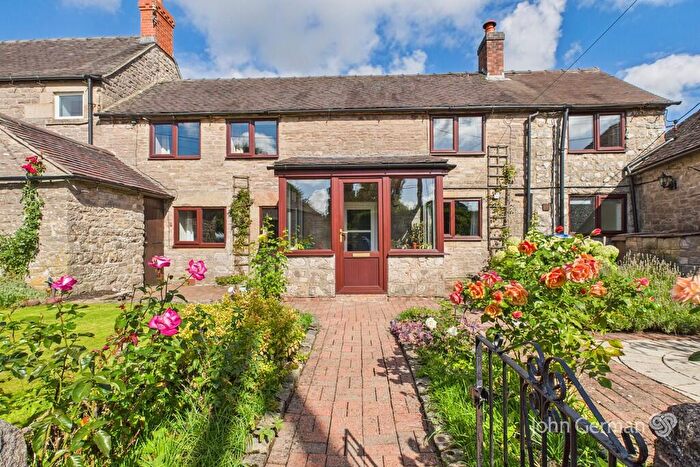
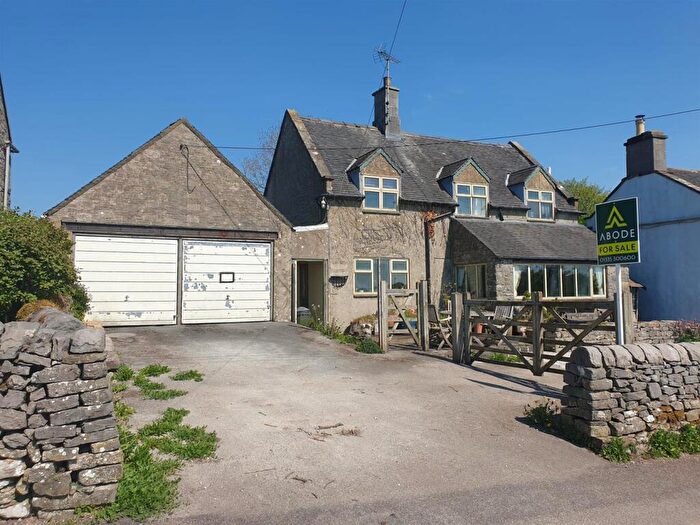
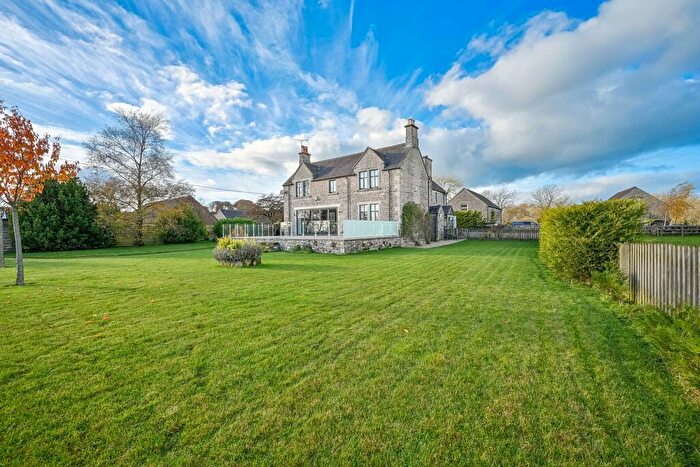
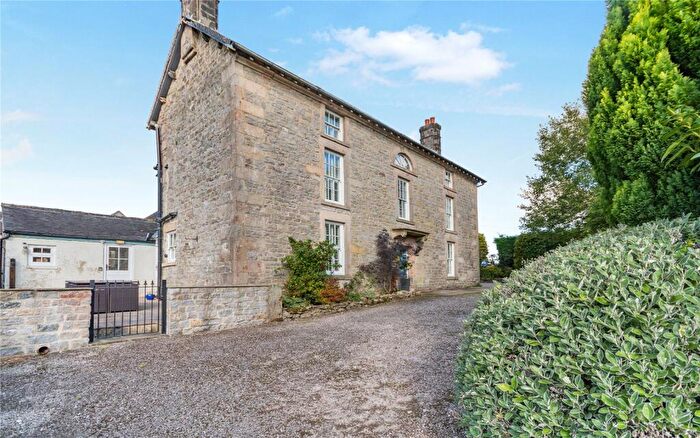
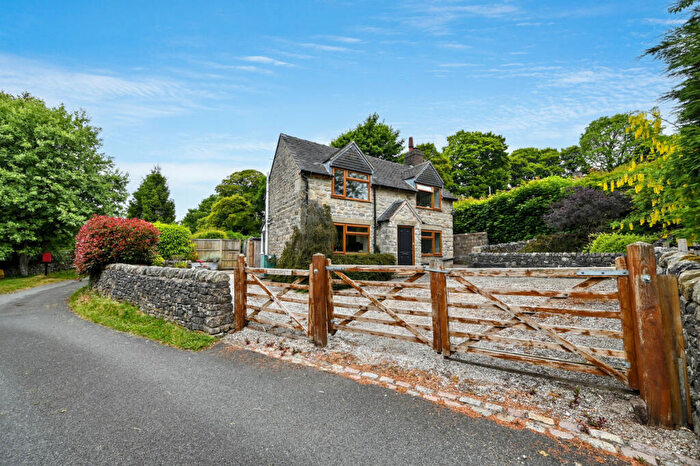
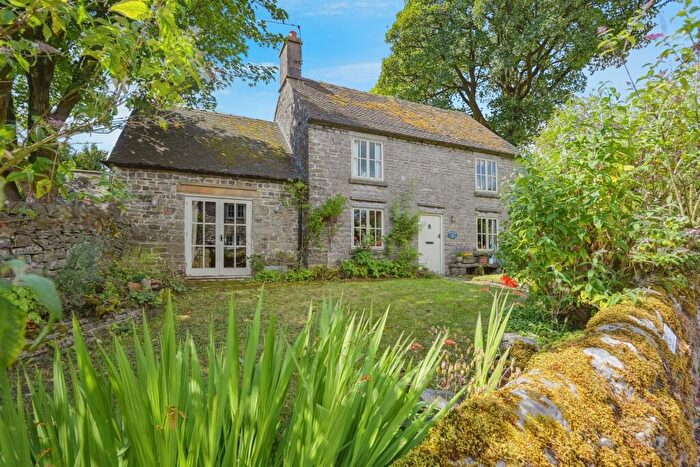
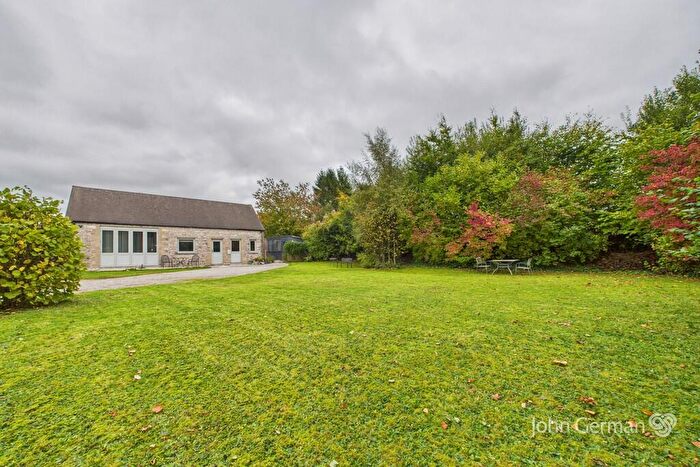
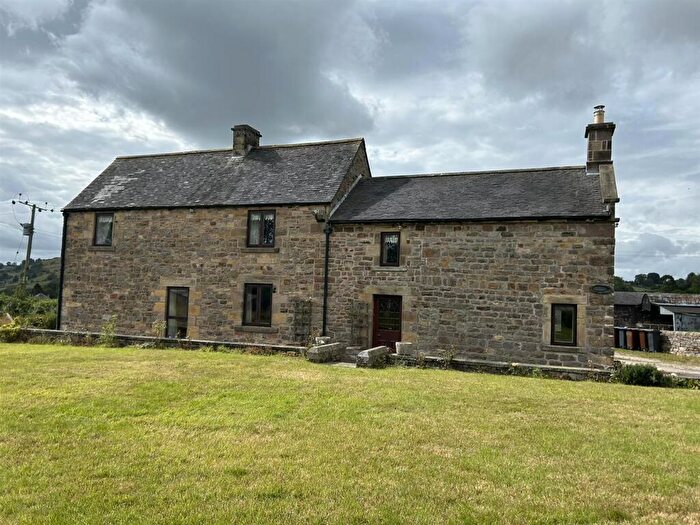
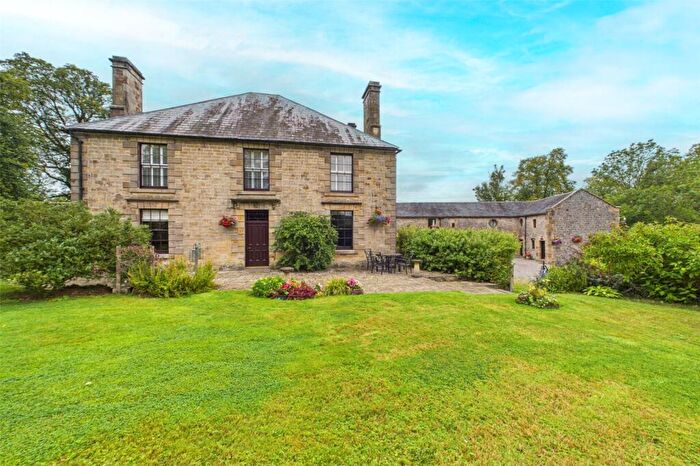
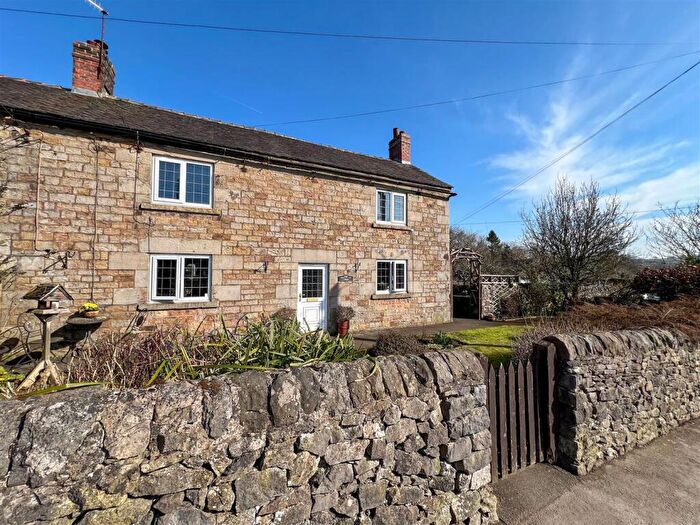
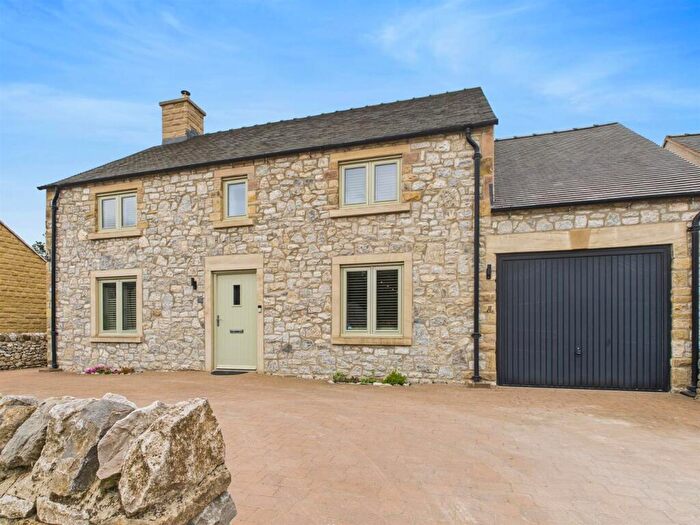
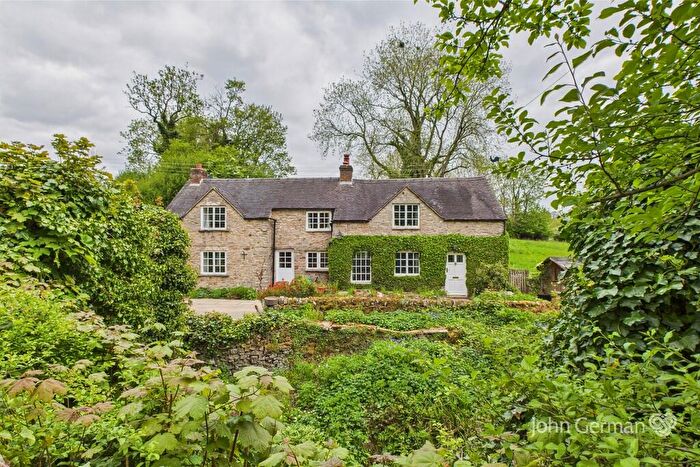
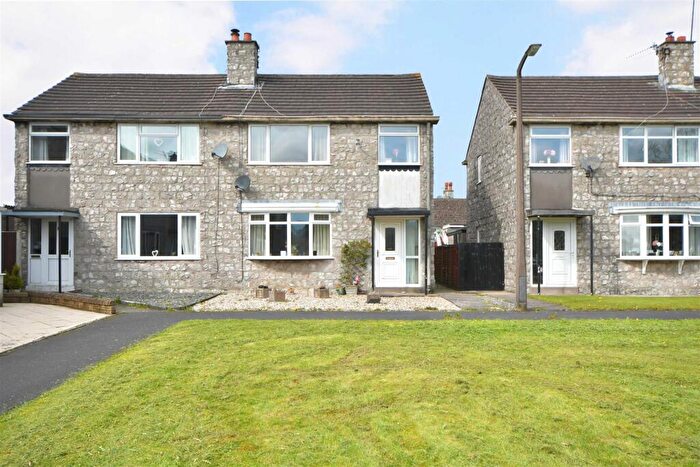
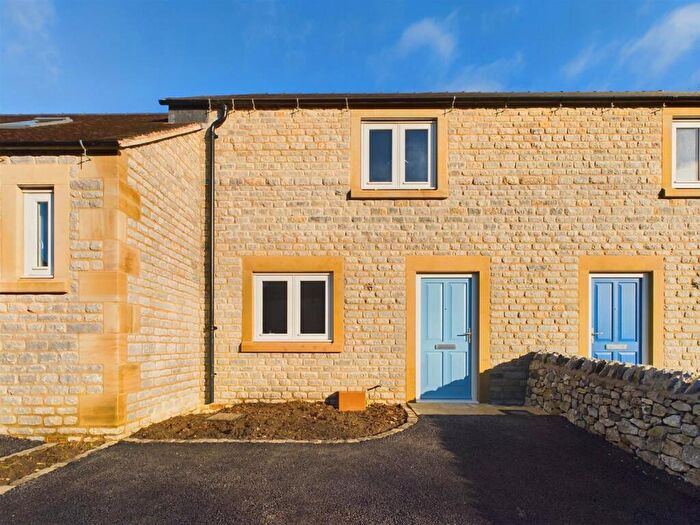
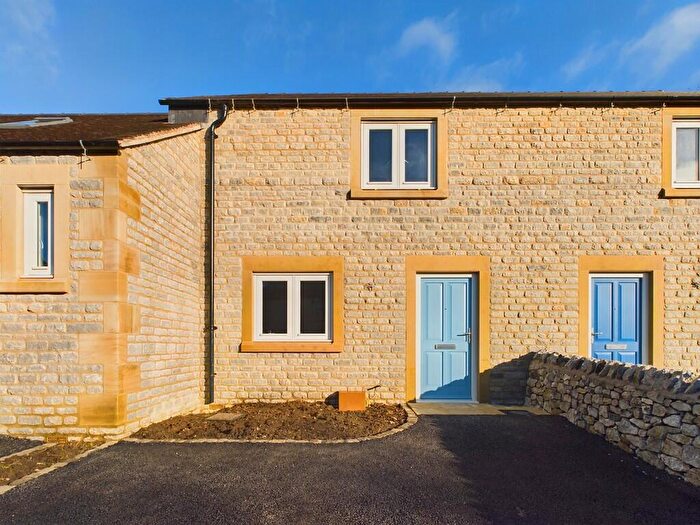
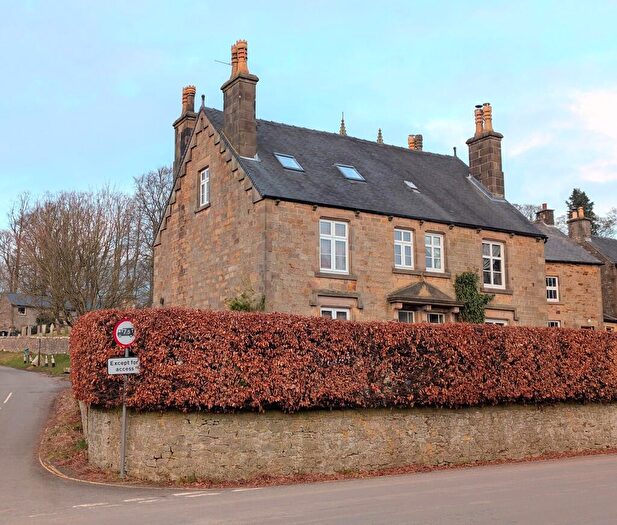
Houses for sale & to rent in Hamps Valley, Ashbourne
House Prices in Hamps Valley
Properties in Hamps Valley have an average house price of £413,235.00 and had 17 Property Transactions within the last 3 years¹.
Hamps Valley is an area in Ashbourne, Staffordshire with 280 households², where the most expensive property was sold for £662,000.00.
Properties for sale in Hamps Valley
Roads and Postcodes in Hamps Valley
Navigate through our locations to find the location of your next house in Hamps Valley, Ashbourne for sale or to rent.
| Streets | Postcodes |
|---|---|
| Back Lane | DE6 2FW |
| Back Of Ecton | DE6 2AJ |
| Gypsy Lane | DE6 2HU |
| Hope | DE6 2GE |
| Hope Dale | DE6 2GD |
| Hope Marsh | DE6 2GF |
| Ilam Moor Lane | DE6 2BD |
| Lode Lane | DE6 2FZ |
| Mill Dale | DE6 2GB |
| Orchard View | DE6 2AZ |
| The Gables | DE6 2FY |
| Town End Lane | DE6 2HS |
| DE6 2AD DE6 2AF DE6 2AH DE6 2BU DE6 2BW DE6 2FR DE6 2FS DE6 2FT DE6 2FX DE6 2AE DE6 2AG DE6 2AY DE6 2BA DE6 2BB DE6 2BG DE6 2BS DE6 2BT DE6 2HH |
Transport near Hamps Valley
-
Matlock Bath Station
-
Cromford Station
-
Matlock Station
-
Uttoxeter Station
-
Blythe Bridge Station
-
Whatstandwell Station
-
Buxton Station
-
Ambergate Station
-
Belper Station
-
Longton Station
- FAQ
- Price Paid By Year
- Property Type Price
Frequently asked questions about Hamps Valley
What is the average price for a property for sale in Hamps Valley?
The average price for a property for sale in Hamps Valley is £413,235. This amount is 7% higher than the average price in Ashbourne. There are 175 property listings for sale in Hamps Valley.
What streets have the most expensive properties for sale in Hamps Valley?
The streets with the most expensive properties for sale in Hamps Valley are Mill Dale at an average of £558,333 and Town End Lane at an average of £385,000.
What streets have the most affordable properties for sale in Hamps Valley?
The street with the most affordable properties for sale in Hamps Valley is Hope Dale at an average of £240,000.
Which train stations are available in or near Hamps Valley?
Some of the train stations available in or near Hamps Valley are Matlock Bath, Cromford and Matlock.
Property Price Paid in Hamps Valley by Year
The average sold property price by year was:
| Year | Average Sold Price | Price Change |
Sold Properties
|
|---|---|---|---|
| 2025 | £460,000 | 11% |
5 Properties |
| 2024 | £409,571 | 9% |
7 Properties |
| 2023 | £371,600 | -24% |
5 Properties |
| 2022 | £460,983 | -33% |
8 Properties |
| 2021 | £612,466 | 26% |
12 Properties |
| 2020 | £450,950 | -10% |
10 Properties |
| 2019 | £498,204 | 32% |
11 Properties |
| 2018 | £336,820 | -19% |
5 Properties |
| 2017 | £399,675 | 34% |
6 Properties |
| 2016 | £263,000 | -16% |
4 Properties |
| 2015 | £305,285 | -8% |
7 Properties |
| 2014 | £331,121 | 0,3% |
6 Properties |
| 2013 | £330,250 | -1% |
8 Properties |
| 2012 | £334,214 | -4% |
7 Properties |
| 2011 | £347,491 | -57% |
6 Properties |
| 2010 | £545,500 | 53% |
4 Properties |
| 2009 | £254,990 | -67% |
5 Properties |
| 2008 | £426,750 | 39% |
8 Properties |
| 2007 | £260,333 | -17% |
3 Properties |
| 2006 | £304,625 | -37% |
4 Properties |
| 2005 | £418,642 | 31% |
7 Properties |
| 2004 | £287,000 | 10% |
6 Properties |
| 2003 | £258,722 | 10% |
9 Properties |
| 2002 | £233,290 | -2% |
10 Properties |
| 2001 | £237,285 | 33% |
7 Properties |
| 2000 | £159,468 | 21% |
8 Properties |
| 1999 | £125,550 | 20% |
10 Properties |
| 1998 | £100,816 | 9% |
3 Properties |
| 1997 | £92,166 | -42% |
6 Properties |
| 1996 | £130,990 | 43% |
5 Properties |
| 1995 | £75,000 | - |
4 Properties |
Property Price per Property Type in Hamps Valley
Here you can find historic sold price data in order to help with your property search.
The average Property Paid Price for specific property types in the last three years are:
| Property Type | Average Sold Price | Sold Properties |
|---|---|---|
| Semi Detached House | £372,142.00 | 7 Semi Detached Houses |
| Detached House | £442,000.00 | 10 Detached Houses |

