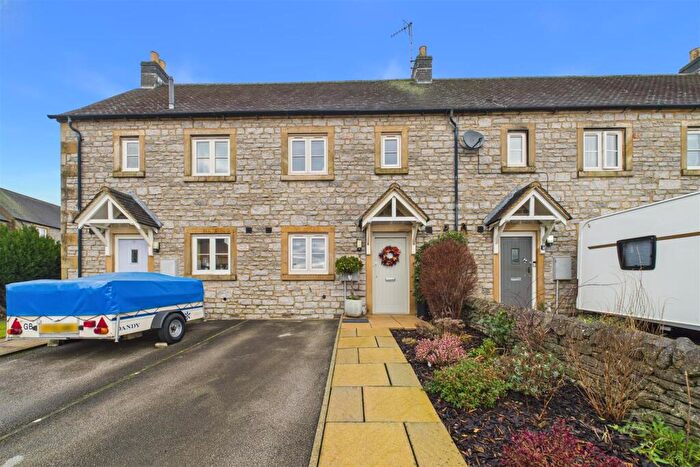
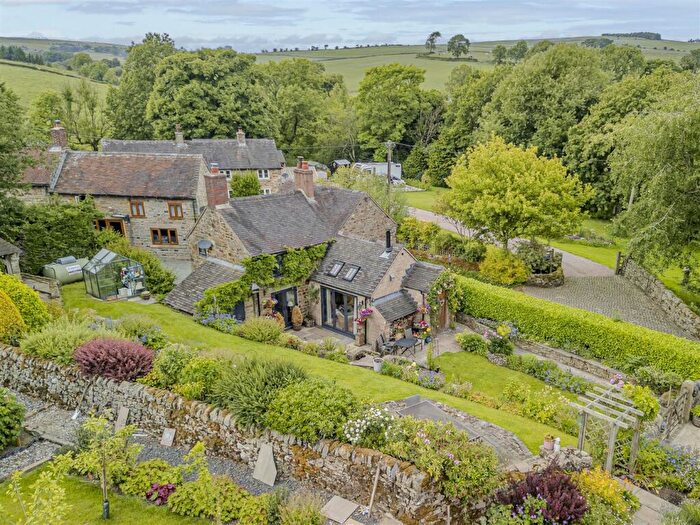
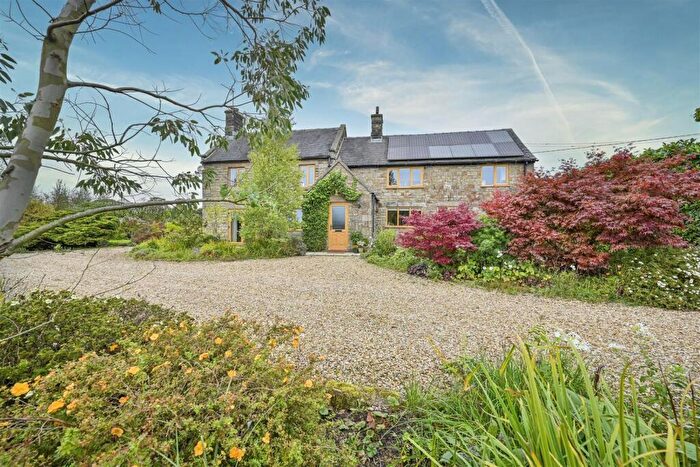
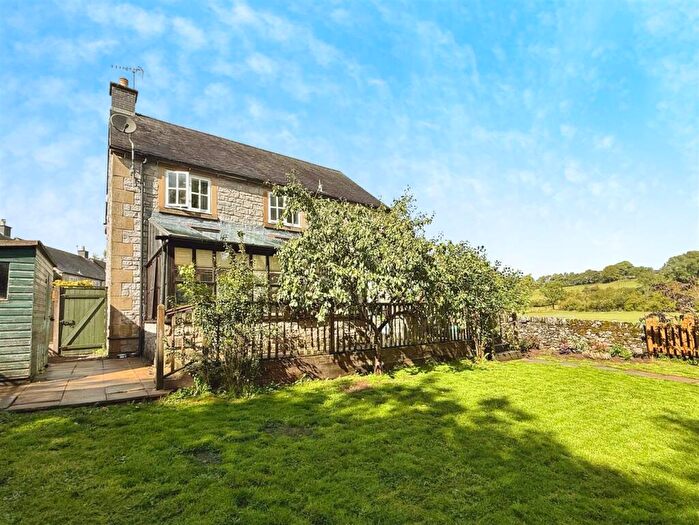
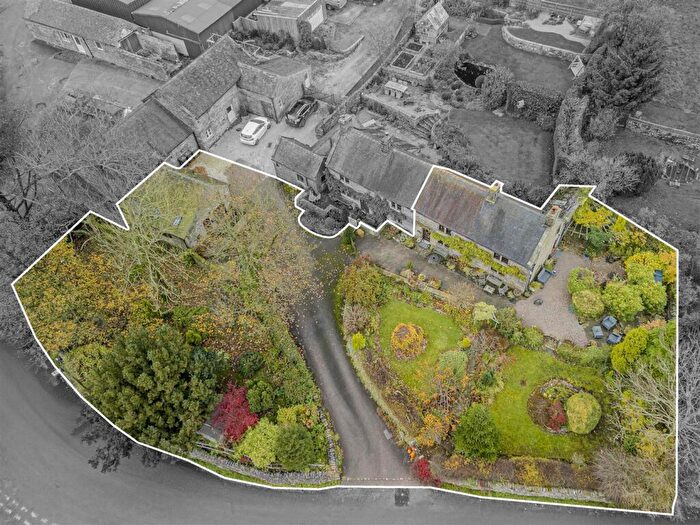
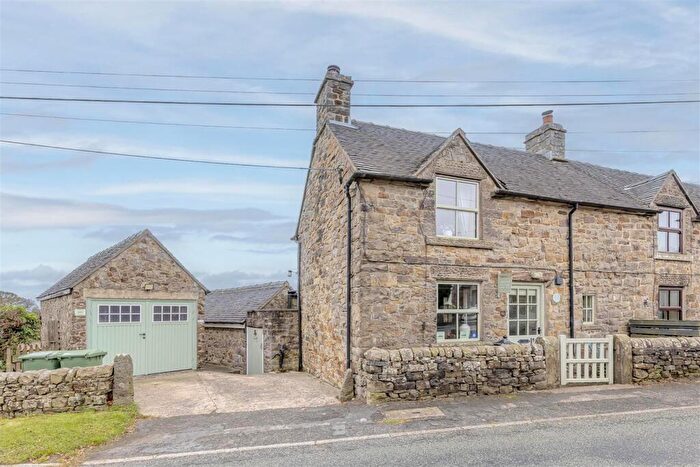
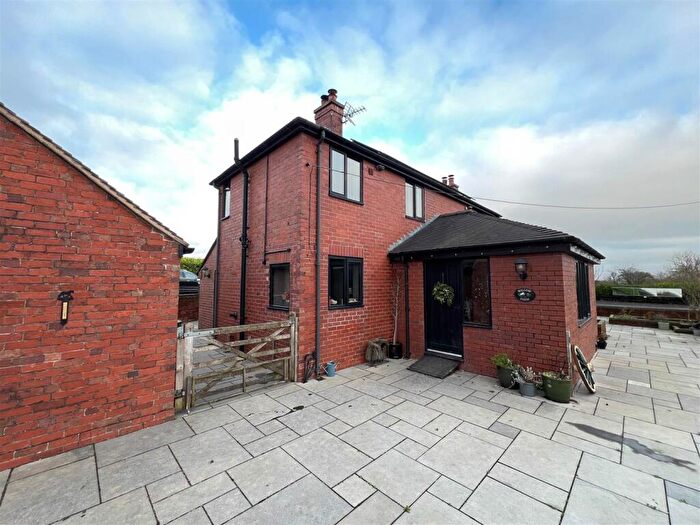
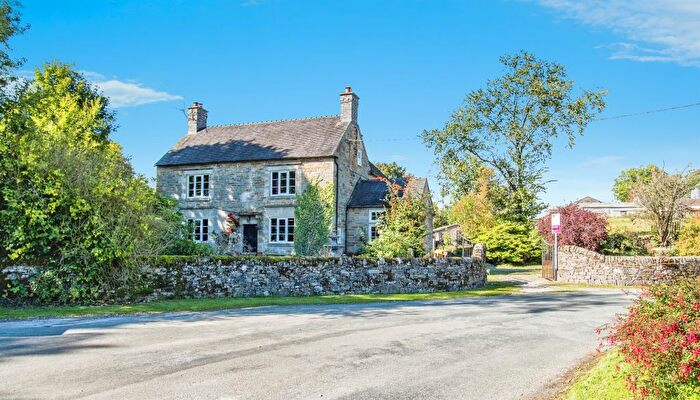
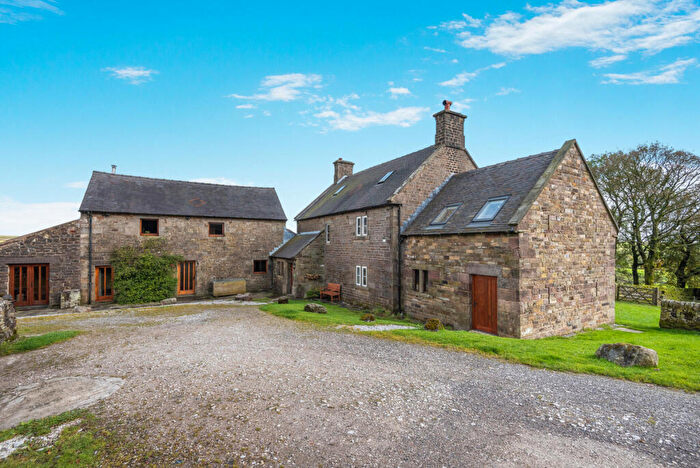
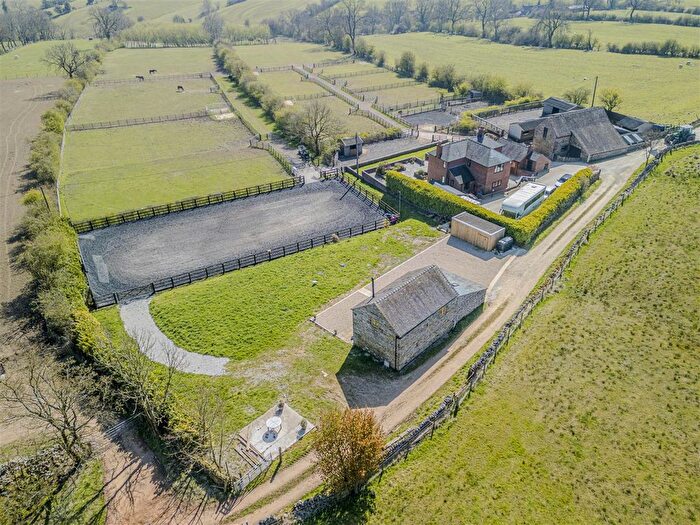
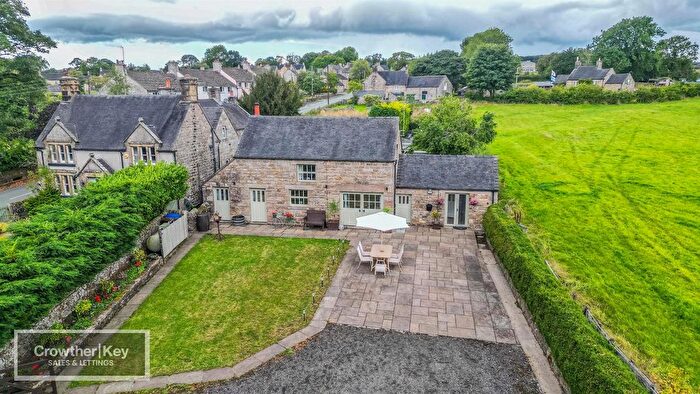
Houses for sale & to rent in Manifold, Leek
House Prices in Manifold
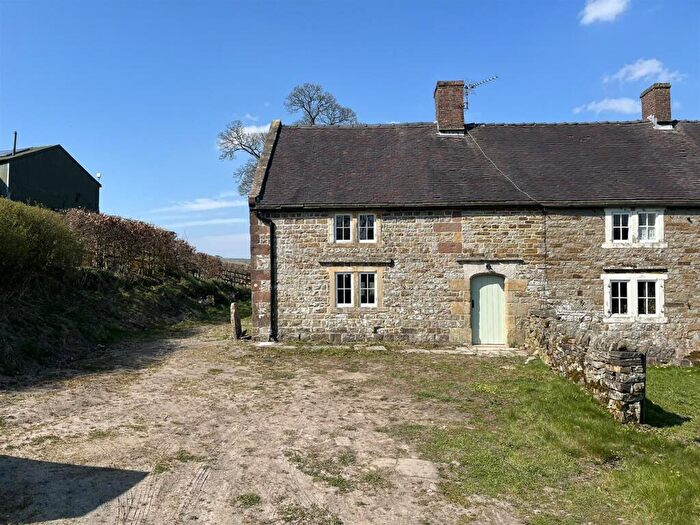
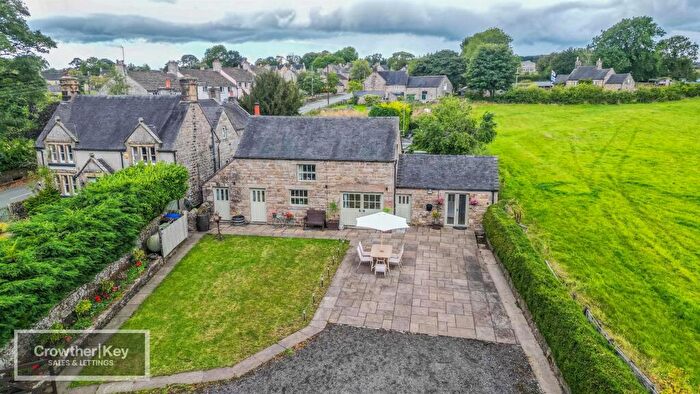
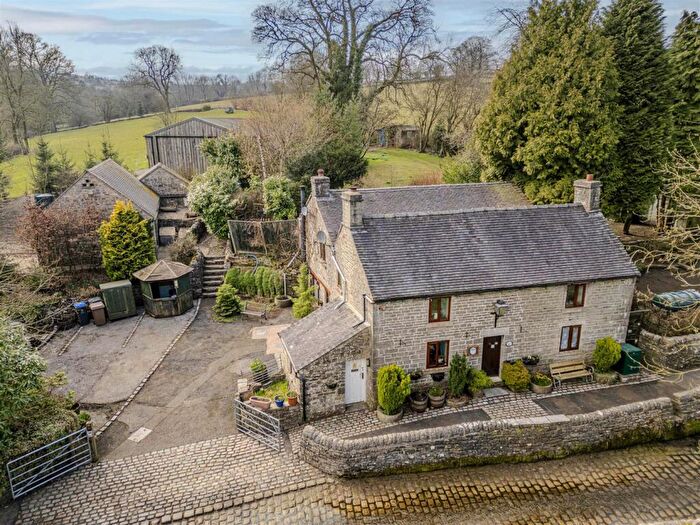
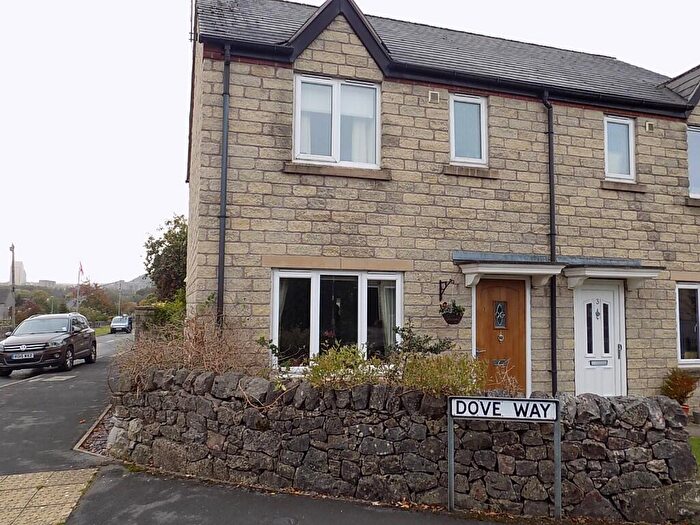
Properties in Manifold have an average house price of £396,071.00 and had 7 Property Transactions within the last 3 years¹.
Manifold is an area in Leek, Staffordshire with 285 households², where the most expensive property was sold for £565,000.00.
Properties for sale in Manifold
Previously listed properties in Manifold
Roads and Postcodes in Manifold
Navigate through our locations to find the location of your next house in Manifold, Leek for sale or to rent.
| Streets | Postcodes |
|---|---|
| Back Lane | ST13 7PJ ST13 7SZ |
| Blakelow Road | ST13 7SG ST13 7SQ |
| Causeway Place | ST13 7TL |
| Church Avenue | ST13 7TR |
| Dog Lane | ST13 7TH |
| Douse Lane | ST13 7SJ |
| Easter Lane | ST13 7TB |
| Ford Wetley | ST13 7RN ST13 7RP |
| Hillsdale Lane | ST13 7PE |
| Martins Low | ST13 7RL |
| Mixon | ST13 7SH |
| Parsons Lane | ST13 7PD ST13 7RH ST13 7RJ |
| Pethills Lane | ST13 7PF ST13 7PG |
| Pot Hooks Lane | ST13 7TA |
| Swainsley | ST13 7SS |
| The Causeway | ST13 7TJ |
| Titterton Lane | ST13 7RQ |
| Wetton Road | ST13 7ST |
| ST13 7RR ST13 7RU ST13 7RW ST13 7RZ ST13 7SD ST13 7SE ST13 7SY ST13 7TD ST13 7TP ST13 7PA ST13 7PB ST13 7PH ST13 7RG ST13 7RX ST13 7RY ST13 7SP ST13 7SR ST13 7TE ST13 7TF ST13 7TG ST13 7TQ ST13 7TS ST13 7TT ST13 8UN ST13 8UP |
Transport near Manifold
-
Blythe Bridge Station
-
Buxton Station
-
Longton Station
-
Congleton Station
-
Stoke-On-Trent Station
-
Longport Station
-
Kidsgrove Station
-
Dove Holes Station
-
Uttoxeter Station
-
Macclesfield Station
- FAQ
- Price Paid By Year
- Property Type Price
Frequently asked questions about Manifold
What is the average price for a property for sale in Manifold?
The average price for a property for sale in Manifold is £396,071. This amount is 73% higher than the average price in Leek. There are 90 property listings for sale in Manifold.
Which train stations are available in or near Manifold?
Some of the train stations available in or near Manifold are Blythe Bridge, Buxton and Longton.
Property Price Paid in Manifold by Year
The average sold property price by year was:
| Year | Average Sold Price | Price Change |
Sold Properties
|
|---|---|---|---|
| 2025 | £252,500 | -33% |
1 Property |
| 2024 | £335,000 | -51% |
3 Properties |
| 2023 | £505,000 | -42% |
3 Properties |
| 2022 | £717,500 | 21% |
4 Properties |
| 2021 | £565,000 | 30% |
2 Properties |
| 2020 | £396,600 | 11% |
5 Properties |
| 2019 | £354,187 | 1% |
4 Properties |
| 2018 | £350,666 | -37% |
3 Properties |
| 2017 | £480,000 | 33% |
4 Properties |
| 2016 | £321,666 | -25% |
3 Properties |
| 2015 | £401,183 | 12% |
3 Properties |
| 2014 | £351,666 | 25% |
3 Properties |
| 2013 | £263,250 | -33% |
4 Properties |
| 2012 | £350,000 | 13% |
4 Properties |
| 2011 | £305,000 | -51% |
1 Property |
| 2010 | £460,833 | 76% |
3 Properties |
| 2009 | £110,000 | -130% |
1 Property |
| 2008 | £252,500 | -53% |
2 Properties |
| 2007 | £385,611 | 15% |
9 Properties |
| 2006 | £329,000 | -21% |
1 Property |
| 2005 | £397,000 | 6% |
1 Property |
| 2004 | £373,852 | 42% |
6 Properties |
| 2003 | £214,983 | -15% |
3 Properties |
| 2002 | £246,550 | 5% |
10 Properties |
| 2001 | £234,390 | 45% |
5 Properties |
| 2000 | £128,125 | -12% |
4 Properties |
| 1999 | £144,125 | -40% |
4 Properties |
| 1998 | £202,333 | 44% |
3 Properties |
| 1997 | £113,600 | -28% |
5 Properties |
| 1996 | £145,750 | 34% |
4 Properties |
| 1995 | £96,666 | - |
3 Properties |
Property Price per Property Type in Manifold
Here you can find historic sold price data in order to help with your property search.
The average Property Paid Price for specific property types in the last three years are:
| Property Type | Average Sold Price | Sold Properties |
|---|---|---|
| Detached House | £486,000.00 | 5 Detached Houses |
| Flat | £90,000.00 | 1 Flat |
| Semi Detached House | £252,500.00 | 1 Semi Detached House |

