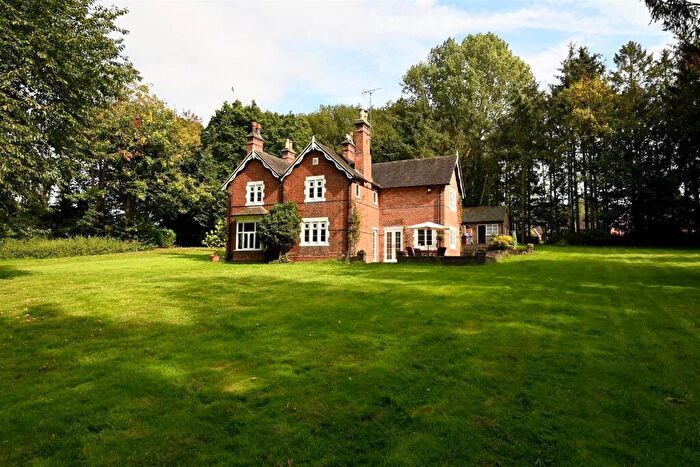
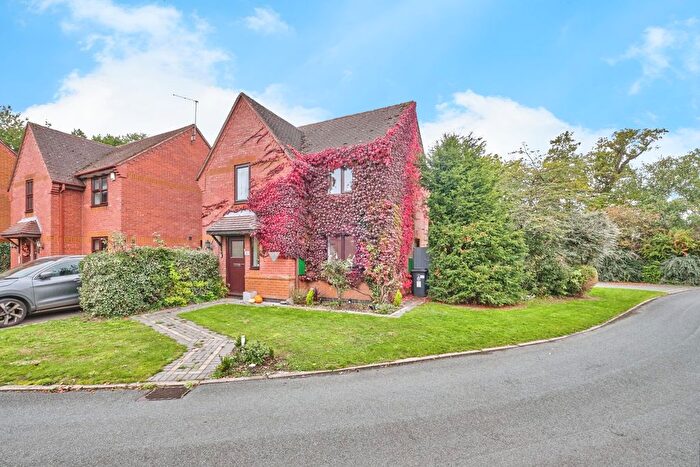
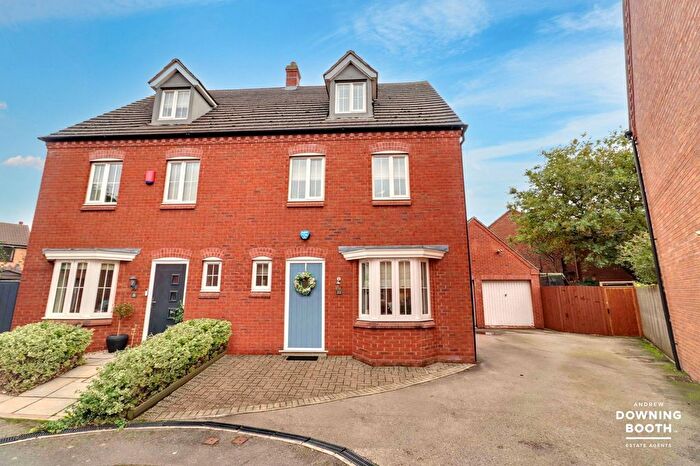
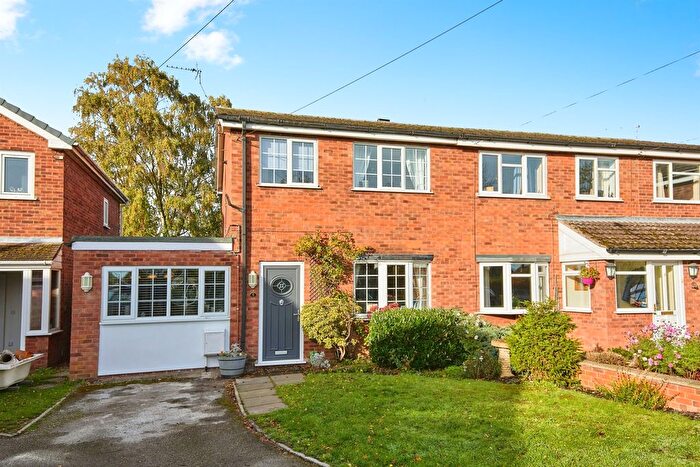
Houses for sale & to rent in Alrewas And Fradley, Burton-on-trent
House Prices in Alrewas And Fradley
Properties in Alrewas And Fradley have an average house price of £414,845.00 and had 168 Property Transactions within the last 3 years¹.
Alrewas And Fradley is an area in Burton-on-trent, Staffordshire with 1,236 households², where the most expensive property was sold for £1,125,000.00.
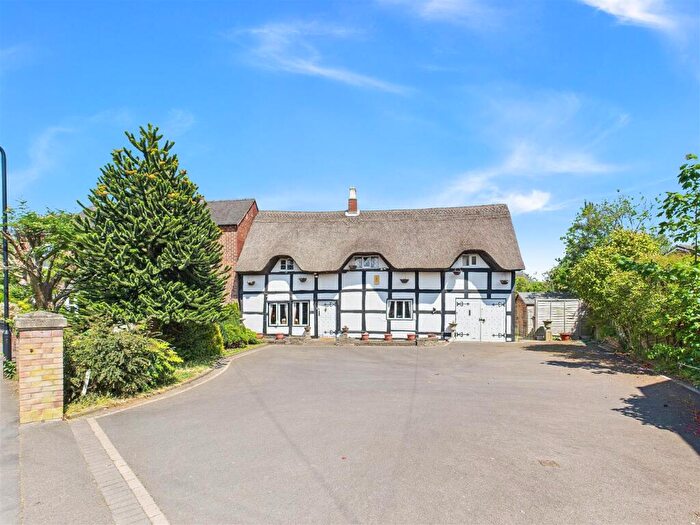
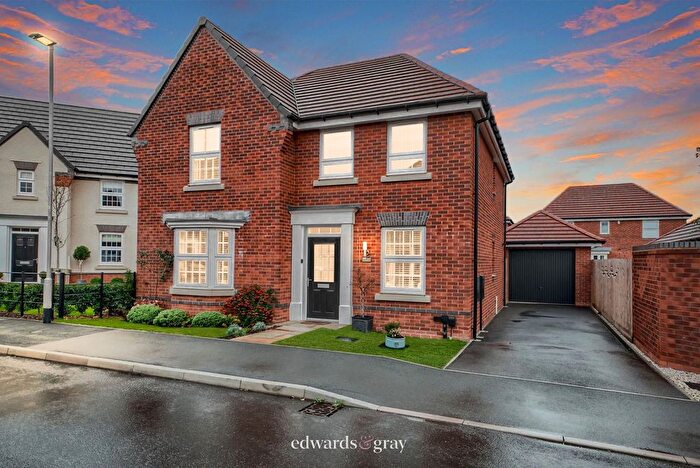
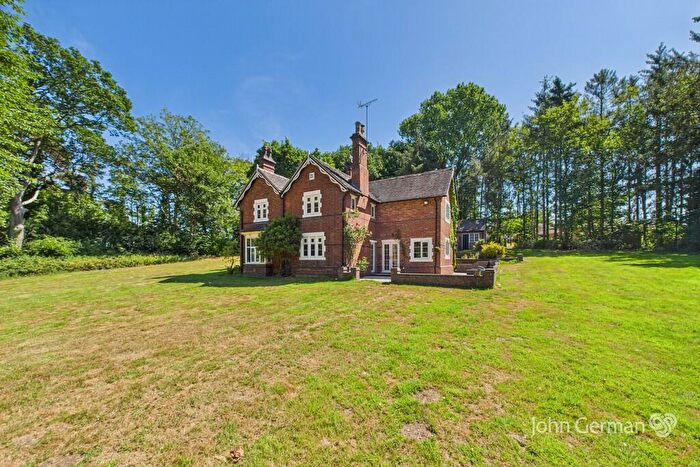
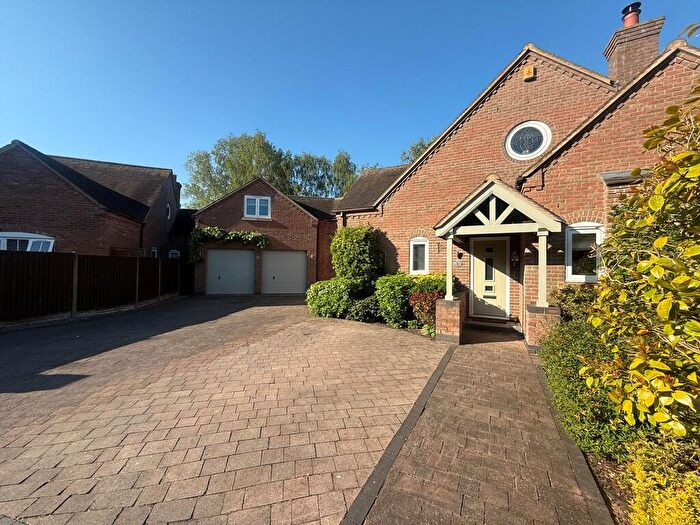
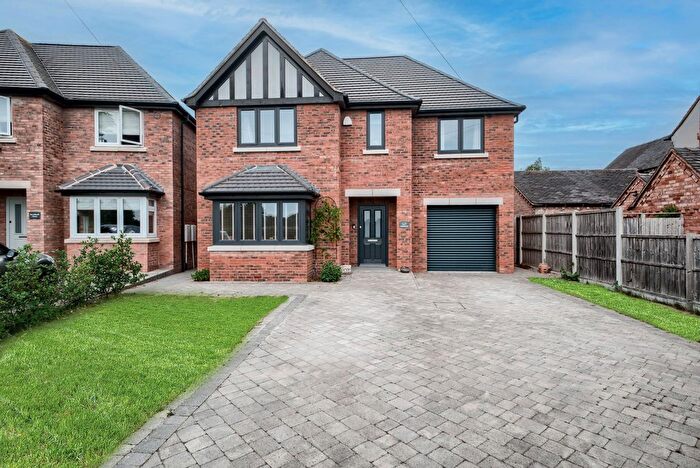
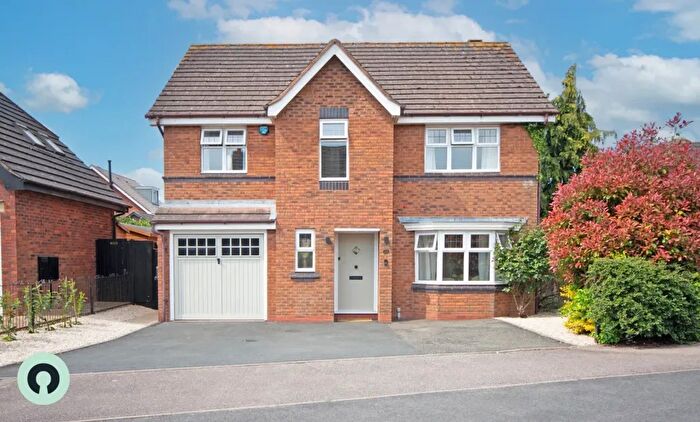
Properties for sale in Alrewas And Fradley
Previously listed properties in Alrewas And Fradley
Roads and Postcodes in Alrewas And Fradley
Navigate through our locations to find the location of your next house in Alrewas And Fradley, Burton-on-trent for sale or to rent.
| Streets | Postcodes |
|---|---|
| Alrewas Hayes | DE13 7DL |
| Anson Road | DE13 7ES |
| Audley Close | DE13 7EX |
| Brace Dein | DE13 7BE |
| Broomhalls Croft | DE13 7FG |
| Burton Road | DE13 7BB |
| Burway Meadow | DE13 7EB |
| Chaseview Road | DE13 7EL |
| Church Road | DE13 7BT |
| Churchill Crescent | DE13 7EH |
| Cotton Close | DE13 7BF |
| Croxall Road | DE13 7BD |
| Daisy Lane | DE13 7EW |
| Dark Lane | DE13 7AP |
| Deepmore Close | DE13 7AY |
| Essington Close | DE13 7AL |
| Fox Lane | DE13 7EG DE13 7EQ |
| Foxton Close | DE13 7FE |
| Fradley Junction | DE13 7DN DE13 7DW |
| Furlong Close | DE13 7EF |
| Furlong Lane | DE13 7EE |
| Great Furlong | DE13 7ER |
| Heron Court | DE13 7FD |
| Inge Drive | DE13 7AZ |
| Kings Bromley Road | DE13 7DB |
| Main Street | DE13 7AA DE13 7AE DE13 7ED |
| Manor Fields | DE13 7DA |
| Mays Walk | DE13 7DT |
| Mellor Drive | DE13 7FF |
| Micklehome Drive | DE13 7AT DE13 7AU |
| Mill End Lane | DE13 7BX DE13 7BY |
| Noon Croft | DE13 7EA |
| Oakfield Road | DE13 7ET DE13 7EU |
| Orgreave | DE13 7DH |
| Orgreave Mews | DE13 7DG |
| Park Road | DE13 7AG DE13 7AJ |
| Poppy Gardens | DE13 7EY |
| Post Office Road | DE13 7BS |
| Rykneld Street | DE13 7AX |
| Sale Lane | DE13 7DP |
| Salters Green Way | DE13 7AW |
| Selwyn Close | DE13 7DR |
| Somerville Road | DE13 7EJ DE13 7EP |
| Swallow Close | DE13 7FB |
| The Cricketers | DE13 7DJ |
| The Moorings | DE13 7BG |
| Turton Close | DE13 7HA |
| Walkfield Road | DE13 7EN |
| Wellfield Road | DE13 7EZ DE13 7HB |
| White Hart Mews | DE13 7AD |
| Wilkins Croft | DE13 7DS |
| William Iv Road | DE13 7AN |
Transport near Alrewas And Fradley
-
Lichfield Trent Valley Station
-
Lichfield City Station
-
Burton-On-Trent Station
-
Tamworth Low Level Station
-
Shenstone Station
-
Rugeley Trent Valley Station
-
Rugeley Town Station
-
Wilnecote Station
-
Polesworth Station
-
Blake Street Station
- FAQ
- Price Paid By Year
- Property Type Price
Frequently asked questions about Alrewas And Fradley
What is the average price for a property for sale in Alrewas And Fradley?
The average price for a property for sale in Alrewas And Fradley is £414,845. This amount is 72% higher than the average price in Burton-on-trent. There are 457 property listings for sale in Alrewas And Fradley.
What streets have the most expensive properties for sale in Alrewas And Fradley?
The streets with the most expensive properties for sale in Alrewas And Fradley are Post Office Road at an average of £765,000, Daisy Lane at an average of £713,333 and The Moorings at an average of £689,166.
What streets have the most affordable properties for sale in Alrewas And Fradley?
The streets with the most affordable properties for sale in Alrewas And Fradley are Somerville Road at an average of £191,857, Oakfield Road at an average of £234,375 and Deepmore Close at an average of £238,350.
Which train stations are available in or near Alrewas And Fradley?
Some of the train stations available in or near Alrewas And Fradley are Lichfield Trent Valley, Lichfield City and Burton-On-Trent.
Property Price Paid in Alrewas And Fradley by Year
The average sold property price by year was:
| Year | Average Sold Price | Price Change |
Sold Properties
|
|---|---|---|---|
| 2025 | £468,090 | 21% |
11 Properties |
| 2024 | £367,921 | -6% |
57 Properties |
| 2023 | £388,902 | -19% |
36 Properties |
| 2022 | £462,077 | 14% |
64 Properties |
| 2021 | £397,665 | 24% |
63 Properties |
| 2020 | £301,736 | -11% |
41 Properties |
| 2019 | £334,788 | -11% |
57 Properties |
| 2018 | £371,723 | 25% |
55 Properties |
| 2017 | £277,462 | -13% |
54 Properties |
| 2016 | £313,214 | 6% |
44 Properties |
| 2015 | £294,739 | 12% |
37 Properties |
| 2014 | £258,943 | -2% |
42 Properties |
| 2013 | £263,275 | 1% |
55 Properties |
| 2012 | £259,525 | -2% |
36 Properties |
| 2011 | £264,743 | 1% |
51 Properties |
| 2010 | £261,980 | 11% |
34 Properties |
| 2009 | £234,375 | -23% |
35 Properties |
| 2008 | £288,671 | 16% |
25 Properties |
| 2007 | £243,604 | -12% |
51 Properties |
| 2006 | £273,900 | 13% |
64 Properties |
| 2005 | £237,800 | 16% |
61 Properties |
| 2004 | £200,798 | -11% |
68 Properties |
| 2003 | £223,839 | 21% |
59 Properties |
| 2002 | £177,567 | 12% |
63 Properties |
| 2001 | £156,421 | 13% |
54 Properties |
| 2000 | £136,126 | -1% |
69 Properties |
| 1999 | £137,628 | -1% |
82 Properties |
| 1998 | £138,599 | 28% |
87 Properties |
| 1997 | £99,760 | 26% |
82 Properties |
| 1996 | £74,283 | -2% |
75 Properties |
| 1995 | £76,074 | - |
33 Properties |
Property Price per Property Type in Alrewas And Fradley
Here you can find historic sold price data in order to help with your property search.
The average Property Paid Price for specific property types in the last three years are:
| Property Type | Average Sold Price | Sold Properties |
|---|---|---|
| Semi Detached House | £324,726.00 | 66 Semi Detached Houses |
| Detached House | £522,702.00 | 74 Detached Houses |
| Terraced House | £349,333.00 | 27 Terraced Houses |
| Flat | £150,000.00 | 1 Flat |

