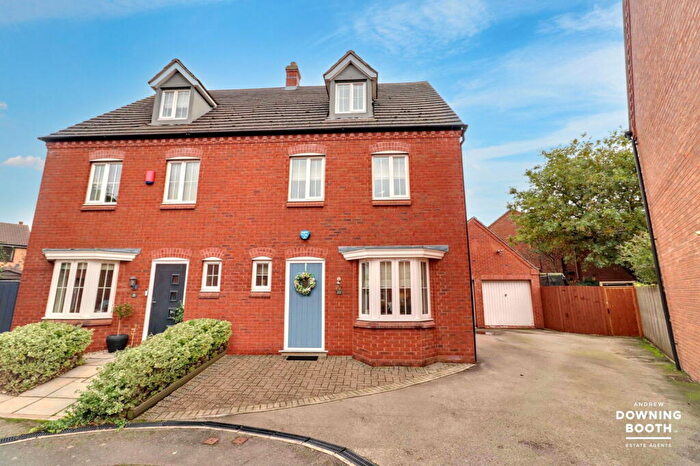
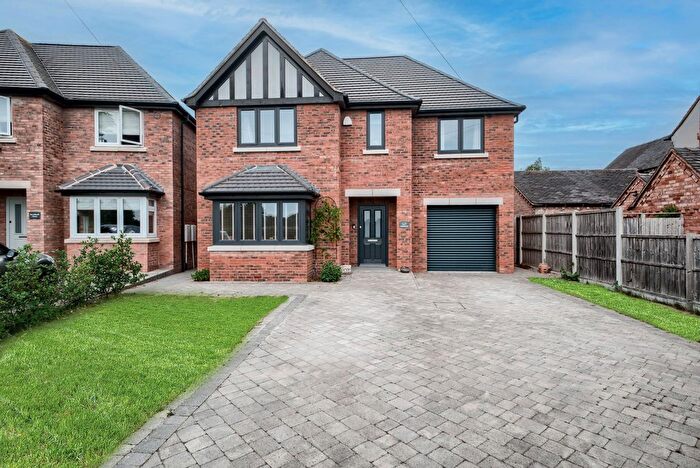
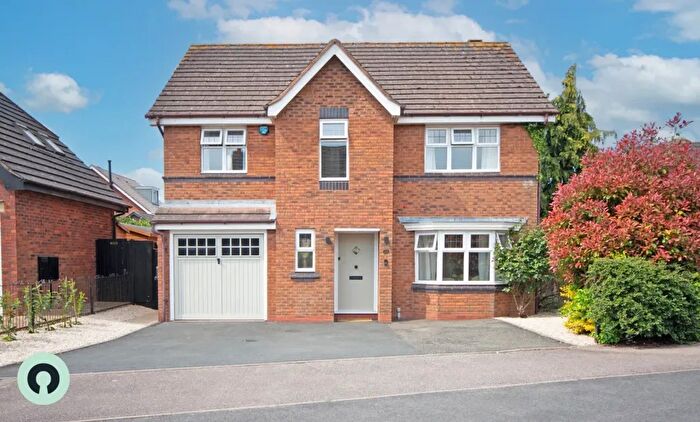
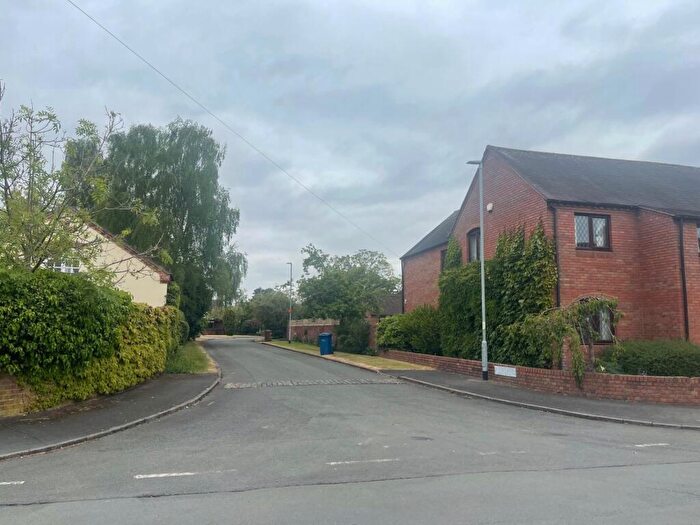
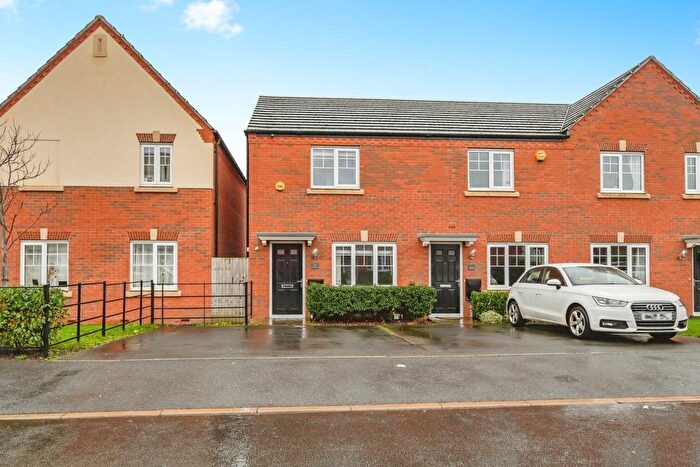
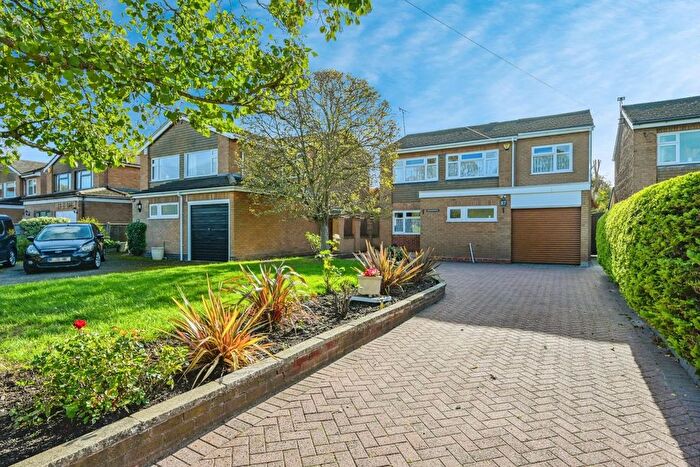
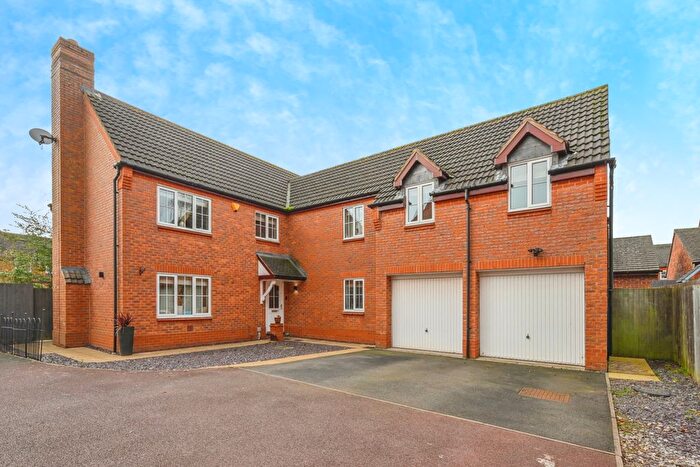
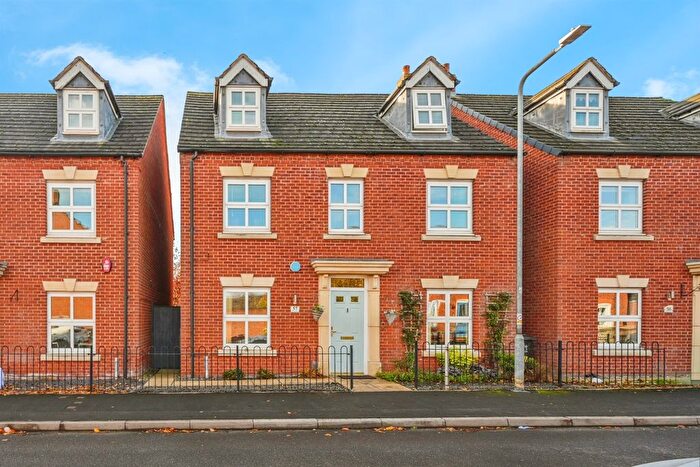
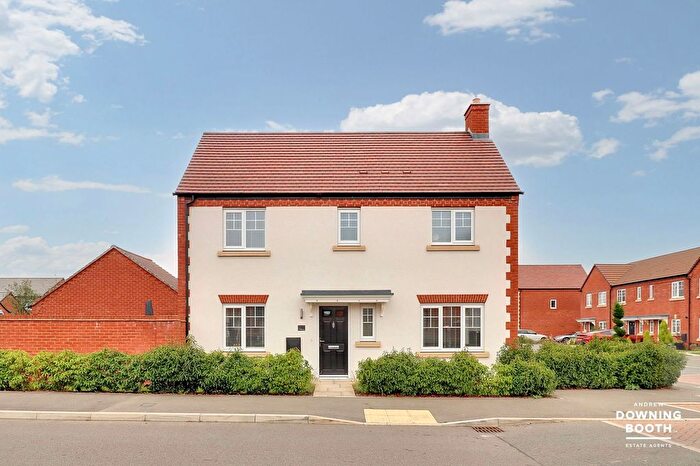
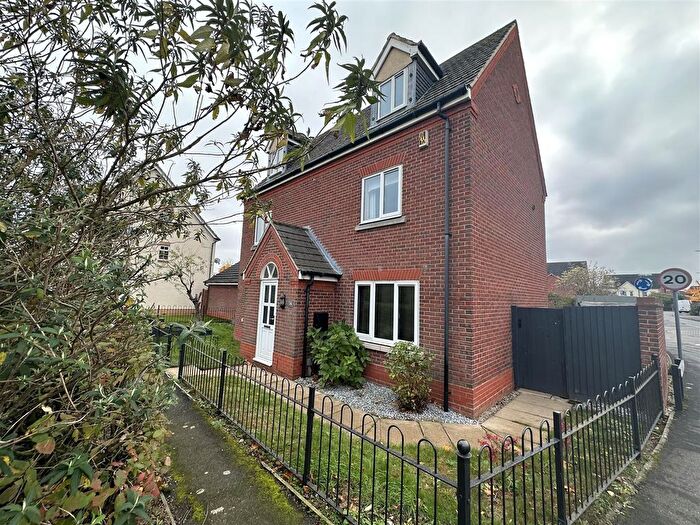
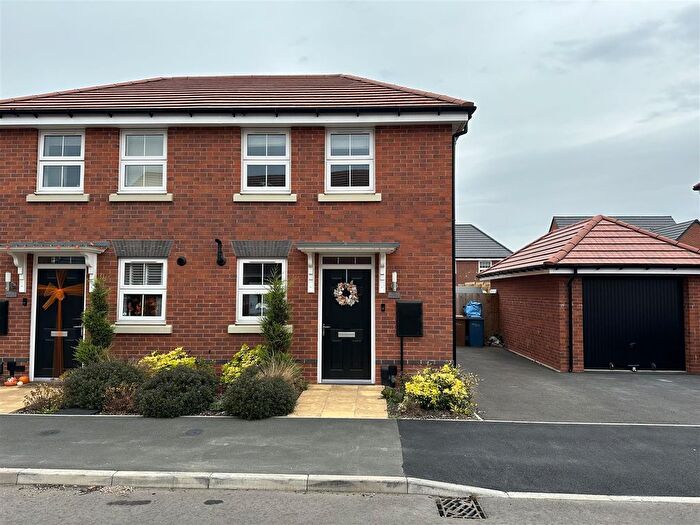
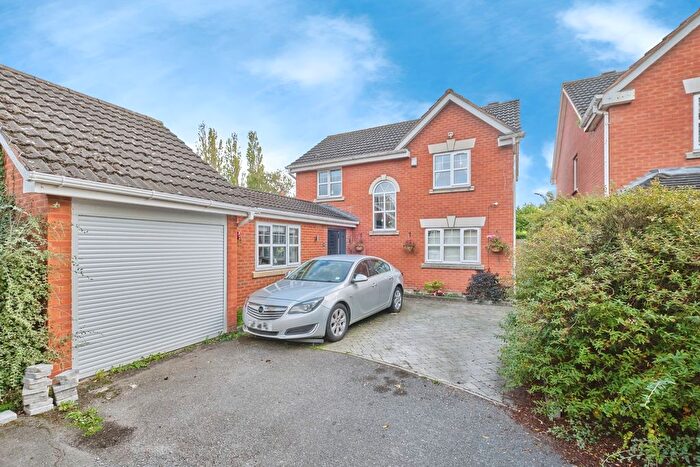
Houses for sale & to rent in Alrewas And Fradley, Lichfield
House Prices in Alrewas And Fradley
Properties in Alrewas And Fradley have an average house price of £362,305.00 and had 151 Property Transactions within the last 3 years¹.
Alrewas And Fradley is an area in Lichfield, Staffordshire with 1,041 households², where the most expensive property was sold for £935,000.00.
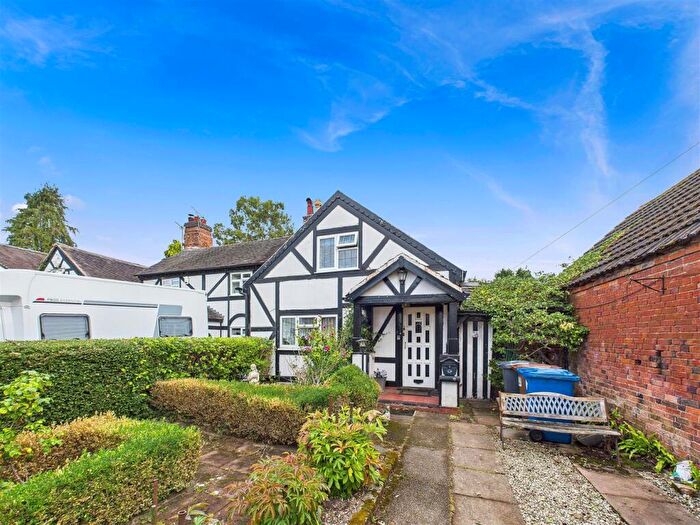
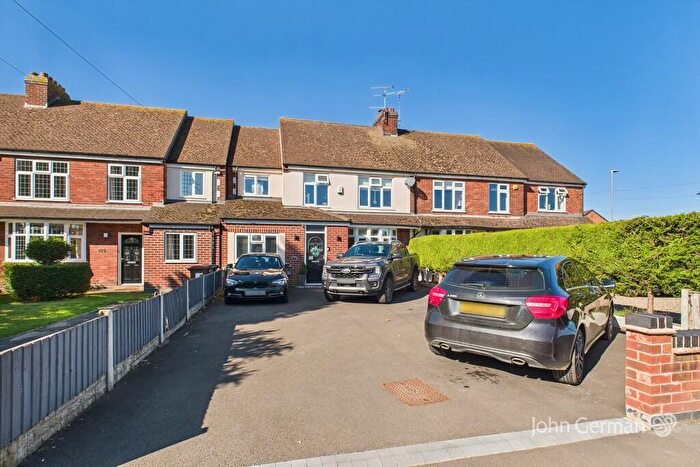
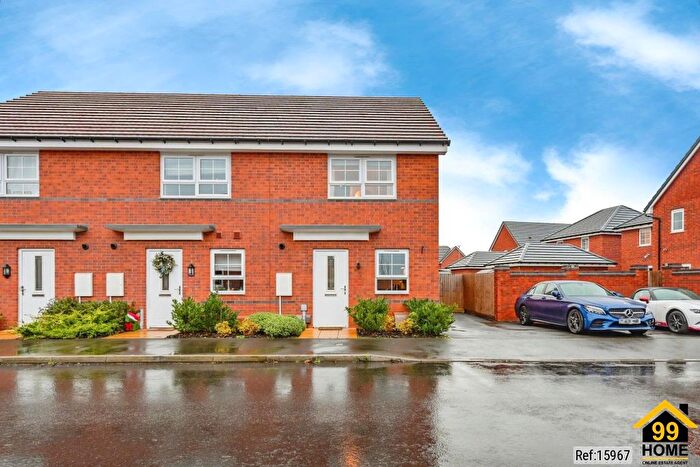
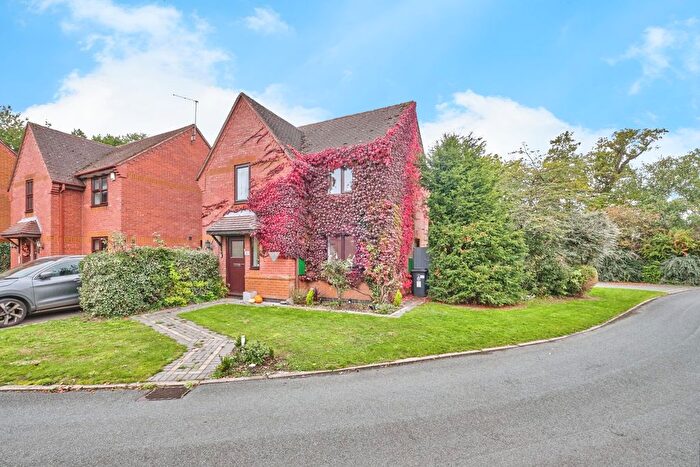
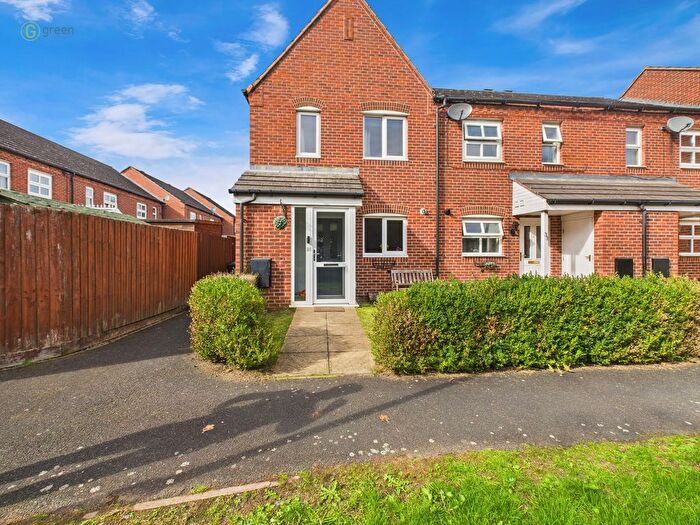
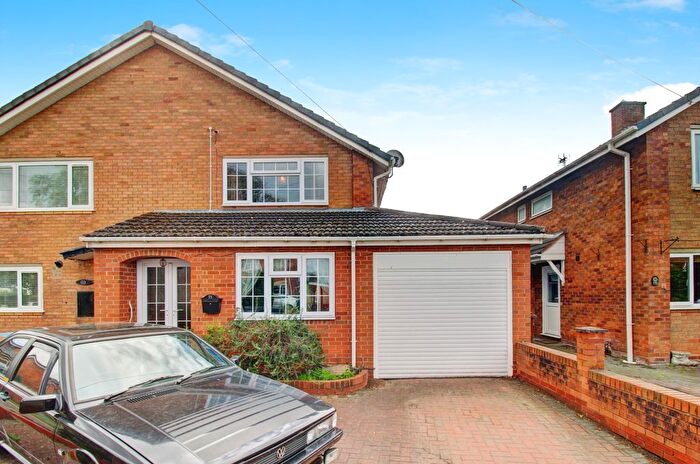
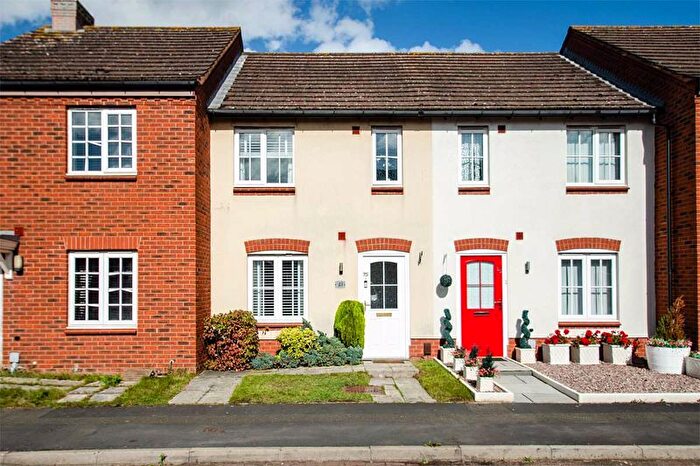
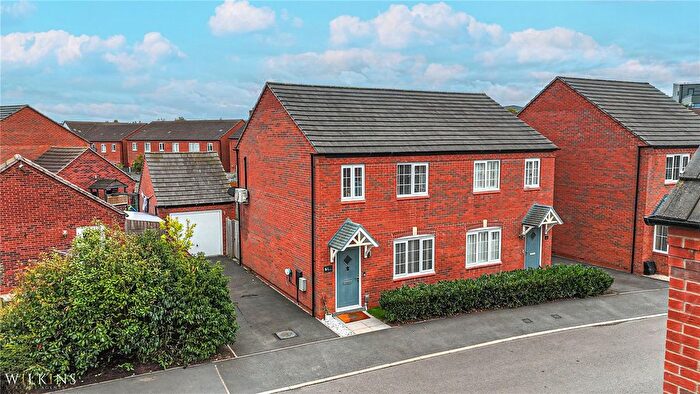
Properties for sale in Alrewas And Fradley
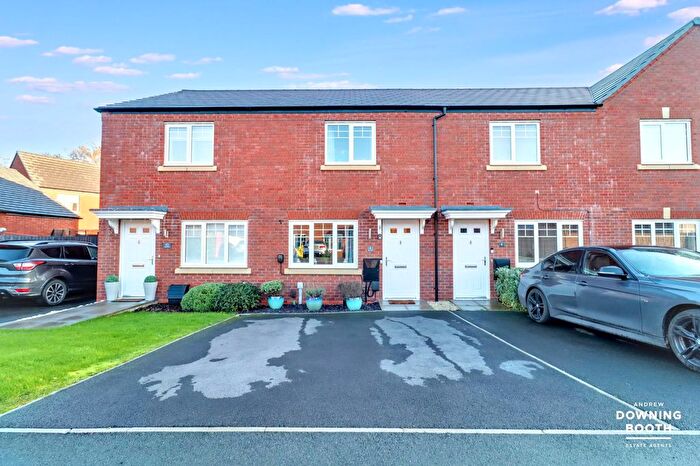
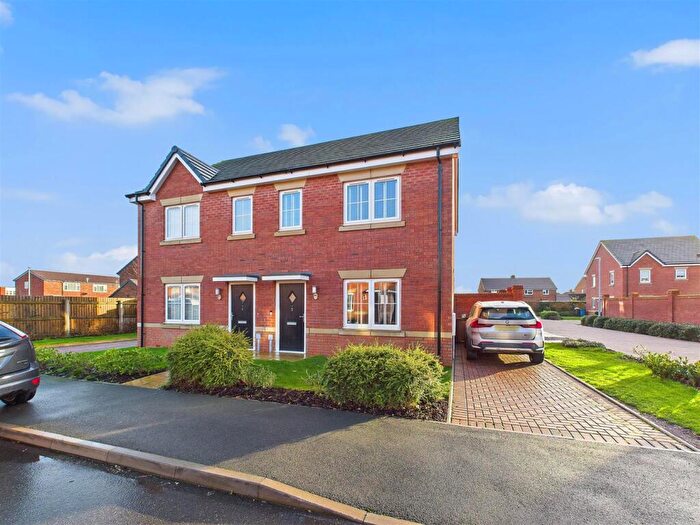
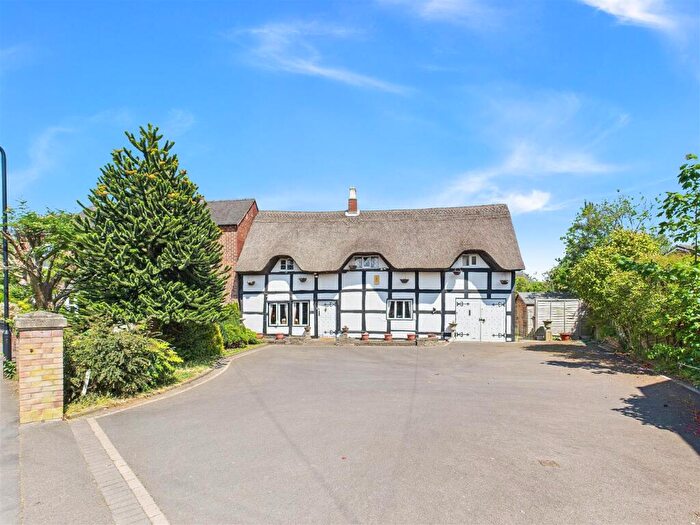
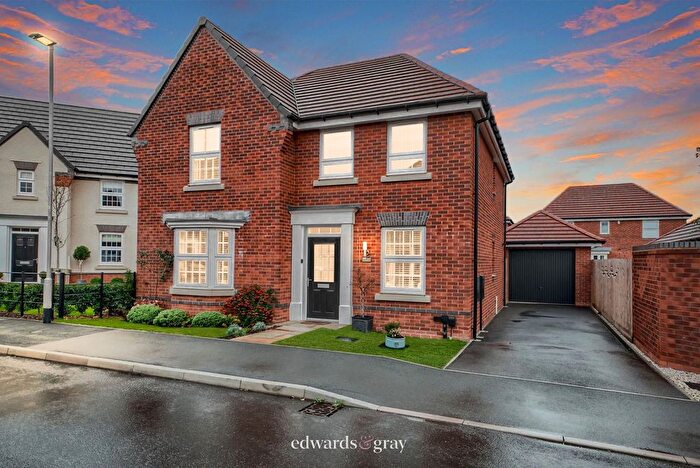
Previously listed properties in Alrewas And Fradley
Roads and Postcodes in Alrewas And Fradley
Navigate through our locations to find the location of your next house in Alrewas And Fradley, Lichfield for sale or to rent.
| Streets | Postcodes |
|---|---|
| Alexander Close | WS13 8SH |
| Baker Drive | WS13 8TD |
| Barlow Drive | WS13 8TL |
| Beeches Croft | WS13 8RX |
| Bromwich Drive | WS13 8SD |
| Brookhay Lane | WS13 8RG WS13 8RL WS13 8RQ |
| Bycars Farm Croft | WS13 8TT |
| Church Close | WS13 8PB |
| Church Lane | WS13 8NJ WS13 8NN WS13 8NP |
| Common Lane | WS13 8TG |
| Cowhill Lane | WS13 8FX |
| Denyer Court | WS13 8TQ |
| Dunmore Hay Lane | WS13 8PL |
| Edwards Farm Road | WS13 8NR |
| Finch Way | WS13 8UB |
| Fletcher Drive | WS13 8TH |
| Forrester Close | WS13 8SF |
| Gillespie Close | WS13 8SN |
| Godfrey Drive | WS13 8TJ |
| Gorse Lane | WS13 8EN |
| Heath Gap | WS13 8PH |
| Hewitt Close | WS13 8TA |
| Holly Drive | WS13 8SE |
| Horner Avenue | WS13 8TR |
| Jackman Close | WS13 8PW |
| Jackman Road | WS13 8PF |
| Jones Close | WS13 8UD |
| Jordan Close | WS13 8PQ |
| Jordan Croft | WS13 8PN |
| Long Lane | WS13 8NS WS13 8NT |
| Milne Avenue | WS13 8SQ |
| Mitchell Close | WS13 8SL |
| Oaklands Close | WS13 8RU |
| Old Hall Lane | WS13 8PA |
| Paskin Close | WS13 8NZ |
| Pettiford Close | WS13 8SG |
| Rogerson Road | WS13 8PE |
| Rumbold Avenue | WS13 8SJ |
| Rykneld Street | WS13 8PJ WS13 8RE |
| Shaw Close | WS13 8SB |
| Shaw Drive | WS13 8TP |
| Statfold Lane | WS13 8NY |
| The Moor | WS13 8PP |
| Thorpe Drive | WS13 8RN |
| Turnbull Road | WS13 8TB |
| Turner Croft | WS13 8SA |
| Ward Close | WS13 8TS |
| Watson Close | WS13 8UA |
| Webb Close | WS13 8TF |
| Williams Avenue | WS13 8TE |
| Willow Close | WS13 8RW |
| Worthington Road | WS13 8PG |
| Wyndham Wood Close | WS13 8UZ |
Transport near Alrewas And Fradley
-
Lichfield Trent Valley Station
-
Lichfield City Station
-
Shenstone Station
-
Tamworth Low Level Station
-
Rugeley Town Station
-
Rugeley Trent Valley Station
-
Wilnecote Station
-
Burton-On-Trent Station
-
Blake Street Station
-
Butlers Lane Station
- FAQ
- Price Paid By Year
- Property Type Price
Frequently asked questions about Alrewas And Fradley
What is the average price for a property for sale in Alrewas And Fradley?
The average price for a property for sale in Alrewas And Fradley is £362,305. This amount is 1% higher than the average price in Lichfield. There are 482 property listings for sale in Alrewas And Fradley.
What streets have the most expensive properties for sale in Alrewas And Fradley?
The streets with the most expensive properties for sale in Alrewas And Fradley are Bycars Farm Croft at an average of £680,000, Willow Close at an average of £628,500 and Cowhill Lane at an average of £600,000.
What streets have the most affordable properties for sale in Alrewas And Fradley?
The streets with the most affordable properties for sale in Alrewas And Fradley are Baker Drive at an average of £193,095, Watson Close at an average of £232,500 and Hewitt Close at an average of £232,750.
Which train stations are available in or near Alrewas And Fradley?
Some of the train stations available in or near Alrewas And Fradley are Lichfield Trent Valley, Lichfield City and Shenstone.
Property Price Paid in Alrewas And Fradley by Year
The average sold property price by year was:
| Year | Average Sold Price | Price Change |
Sold Properties
|
|---|---|---|---|
| 2025 | £299,152 | -20% |
23 Properties |
| 2024 | £359,347 | -11% |
43 Properties |
| 2023 | £397,741 | 6% |
29 Properties |
| 2022 | £372,165 | 9% |
56 Properties |
| 2021 | £337,927 | 9% |
79 Properties |
| 2020 | £307,358 | -2% |
36 Properties |
| 2019 | £313,426 | 10% |
48 Properties |
| 2018 | £282,244 | 1% |
51 Properties |
| 2017 | £278,562 | 1% |
63 Properties |
| 2016 | £277,011 | -3% |
42 Properties |
| 2015 | £286,366 | 14% |
50 Properties |
| 2014 | £245,262 | 5% |
68 Properties |
| 2013 | £233,440 | -6% |
62 Properties |
| 2012 | £247,543 | 11% |
34 Properties |
| 2011 | £220,083 | -3% |
26 Properties |
| 2010 | £227,478 | 13% |
38 Properties |
| 2009 | £198,092 | -11% |
40 Properties |
| 2008 | £220,802 | -1% |
37 Properties |
| 2007 | £223,865 | 2% |
71 Properties |
| 2006 | £219,588 | -14% |
102 Properties |
| 2005 | £250,294 | 13% |
93 Properties |
| 2004 | £218,385 | 11% |
126 Properties |
| 2003 | £194,157 | 21% |
130 Properties |
| 2002 | £153,881 | 15% |
127 Properties |
| 2001 | £130,454 | -30% |
76 Properties |
| 2000 | £169,103 | 17% |
79 Properties |
| 1999 | £140,296 | 35% |
41 Properties |
| 1998 | £90,531 | 1% |
53 Properties |
| 1997 | £89,598 | 9% |
38 Properties |
| 1996 | £81,360 | -13% |
28 Properties |
| 1995 | £92,156 | - |
22 Properties |
Property Price per Property Type in Alrewas And Fradley
Here you can find historic sold price data in order to help with your property search.
The average Property Paid Price for specific property types in the last three years are:
| Property Type | Average Sold Price | Sold Properties |
|---|---|---|
| Semi Detached House | £297,480.00 | 26 Semi Detached Houses |
| Detached House | £448,978.00 | 82 Detached Houses |
| Terraced House | £246,385.00 | 39 Terraced Houses |
| Flat | £137,112.00 | 4 Flats |

