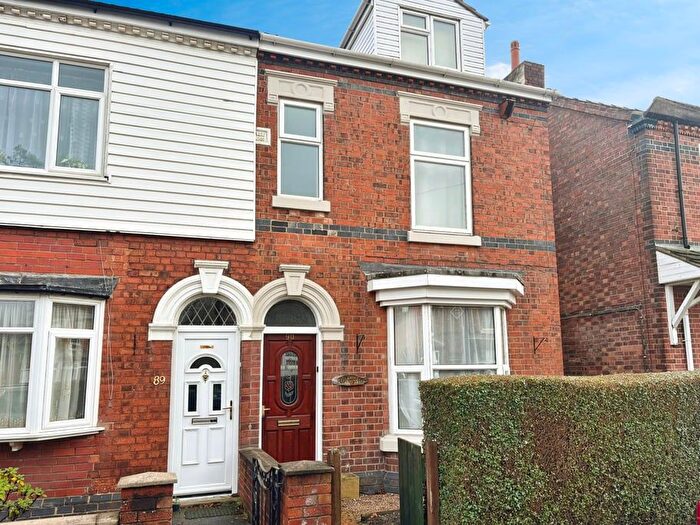
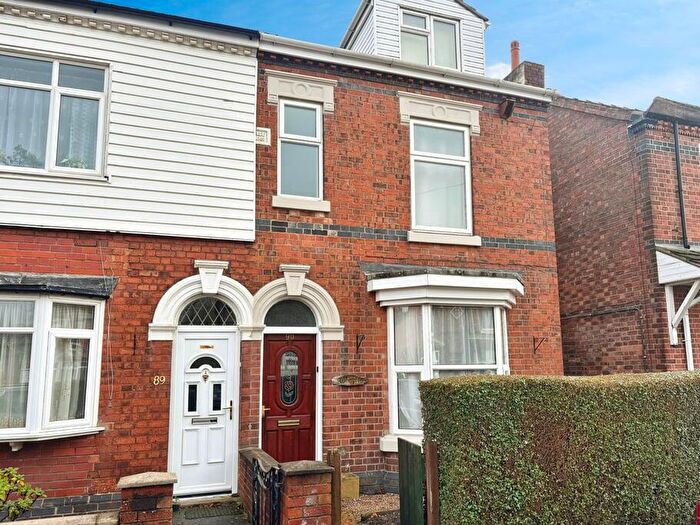
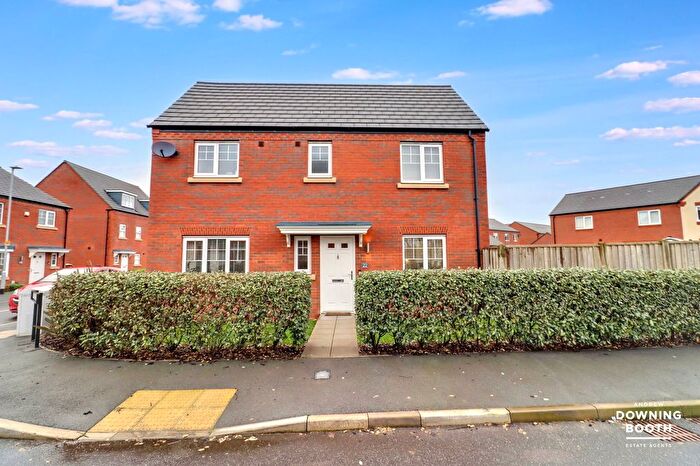
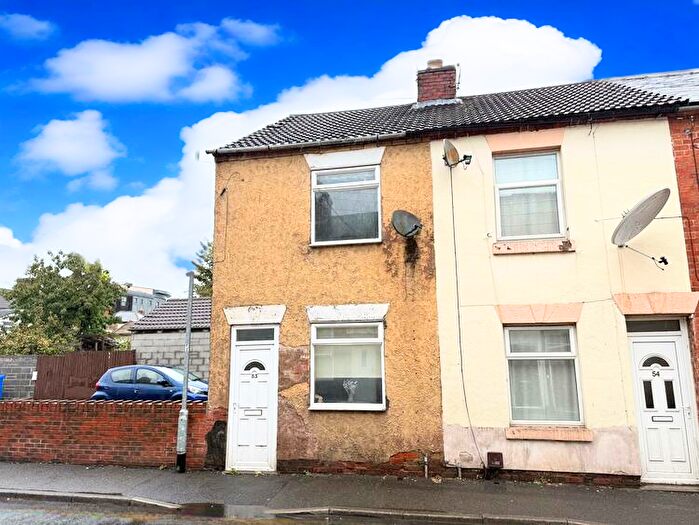
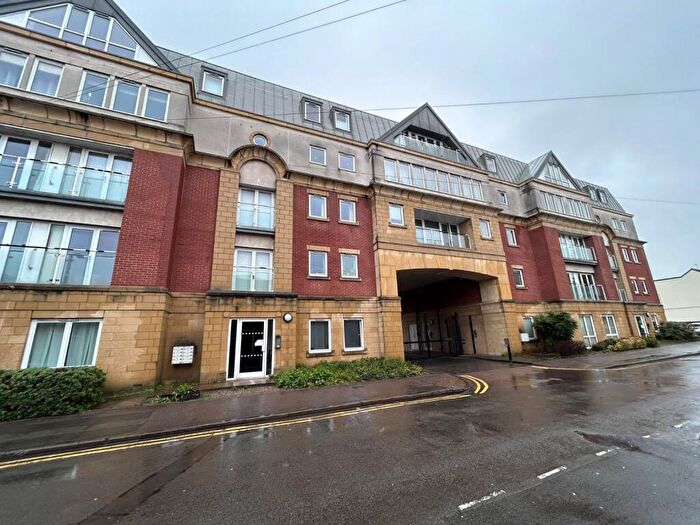
Houses for sale & to rent in Anglesey, Burton-on-trent
House Prices in Anglesey
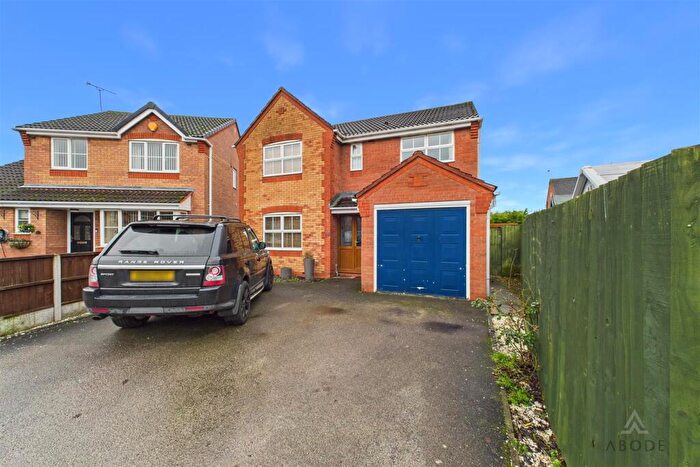
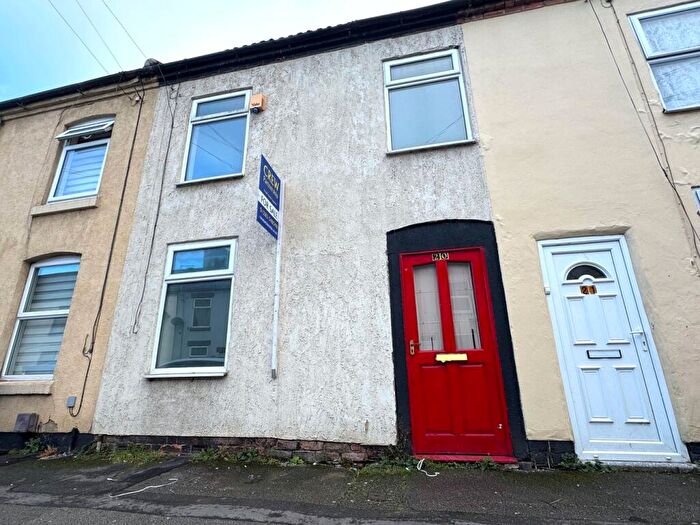
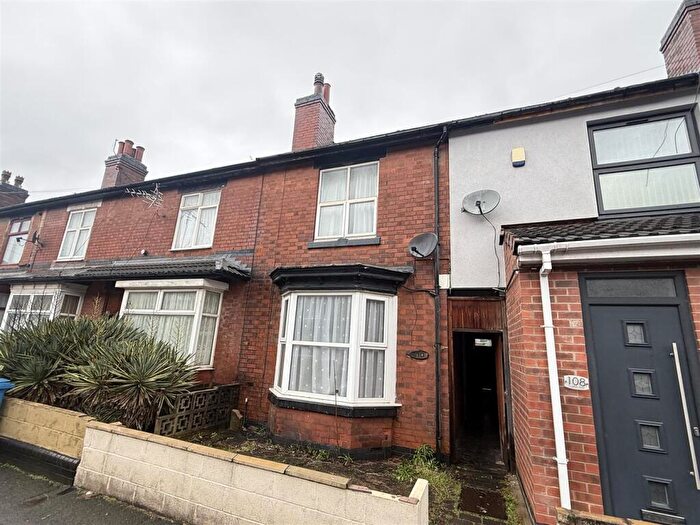
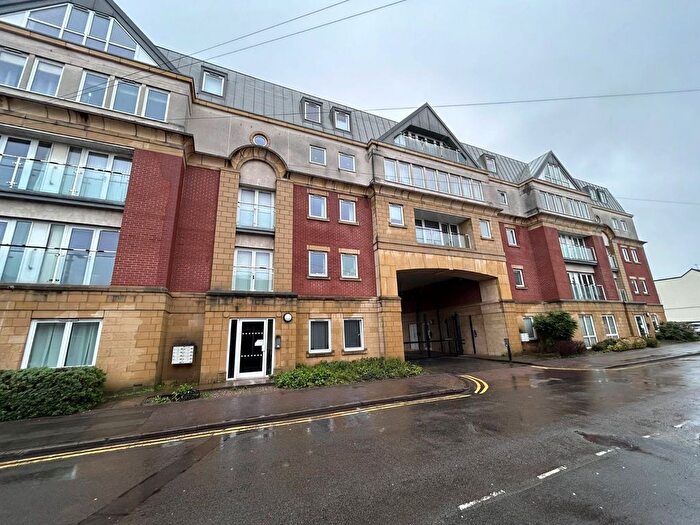
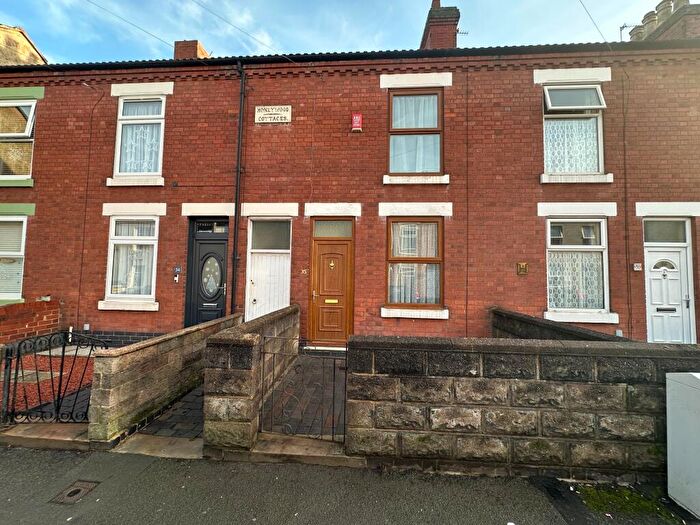
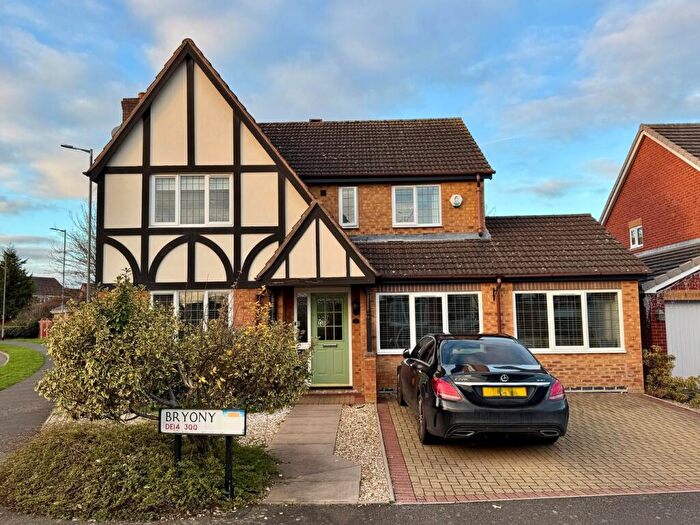
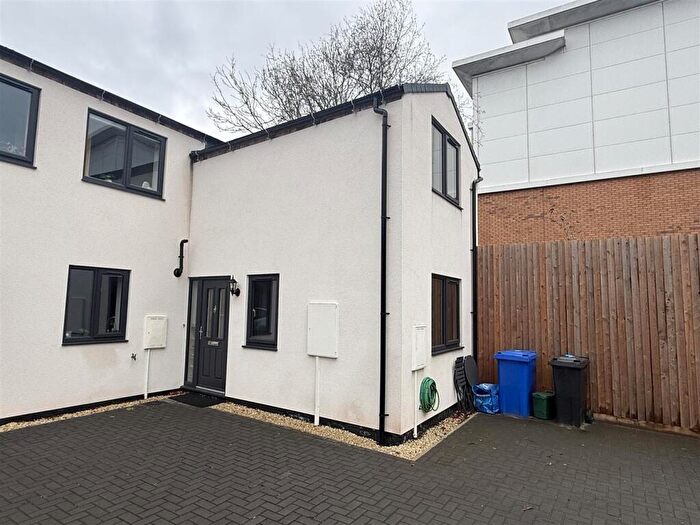
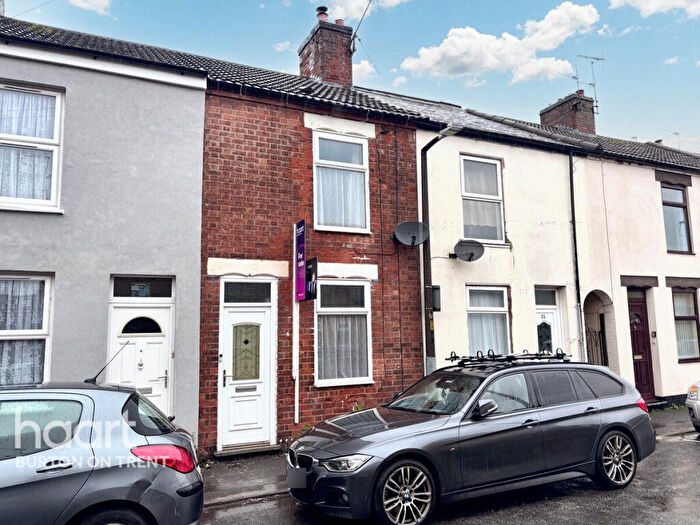
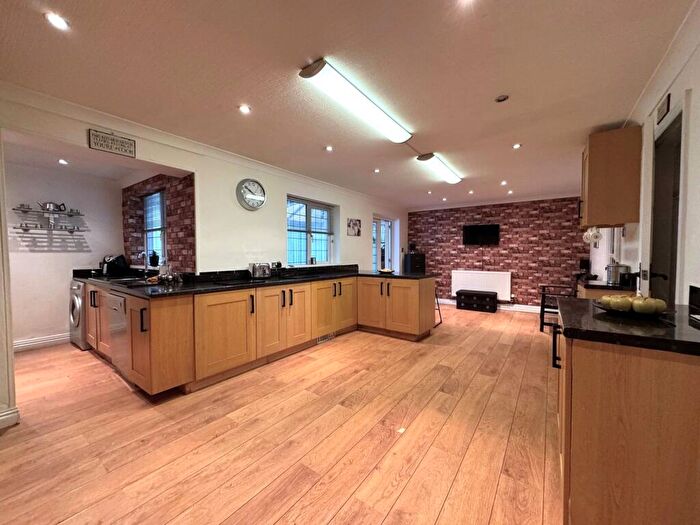
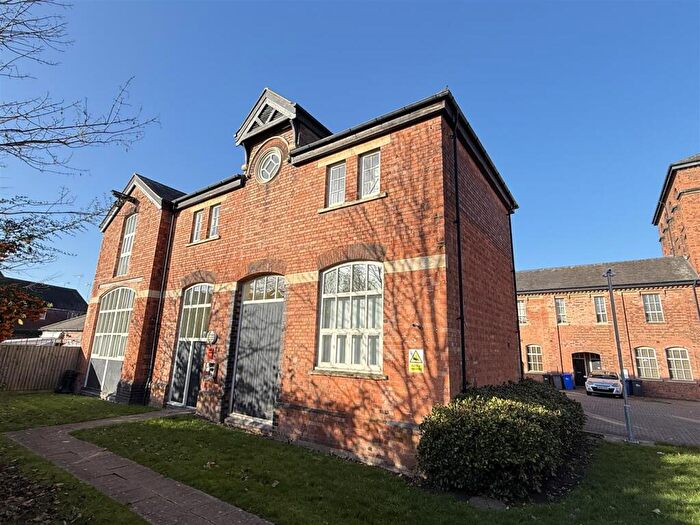
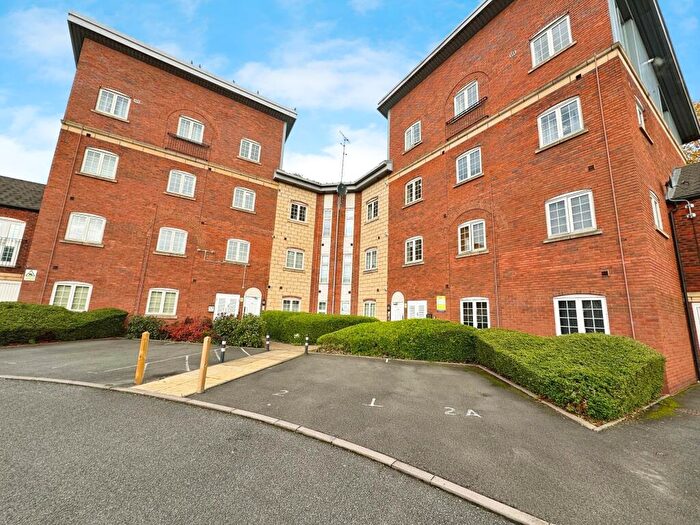
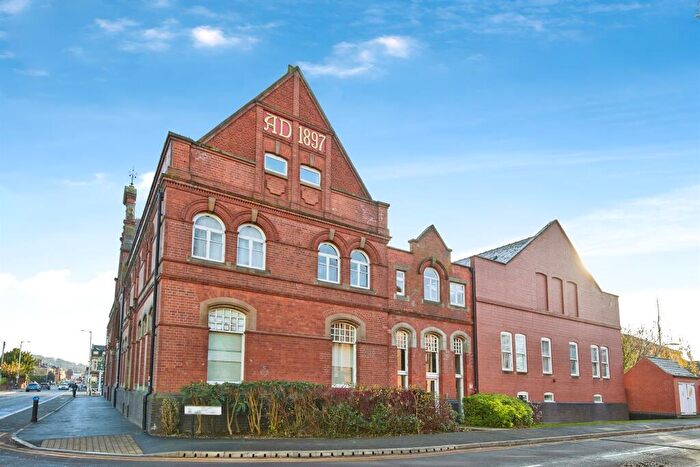
Properties in Anglesey have an average house price of £143,702.00 and had 299 Property Transactions within the last 3 years¹.
Anglesey is an area in Burton-on-trent, Staffordshire with 2,606 households², where the most expensive property was sold for £445,000.00.
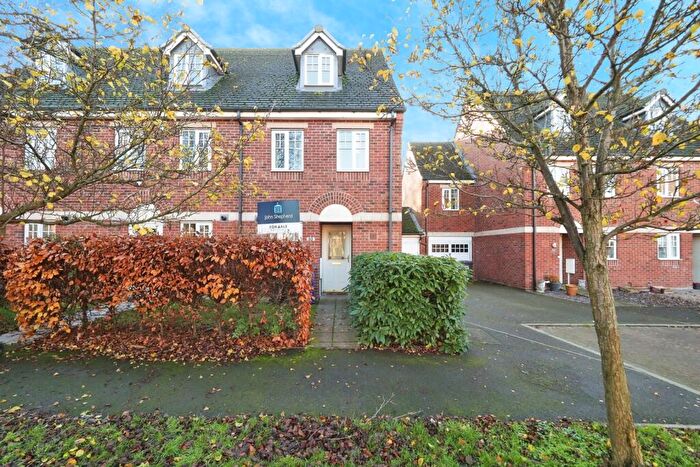
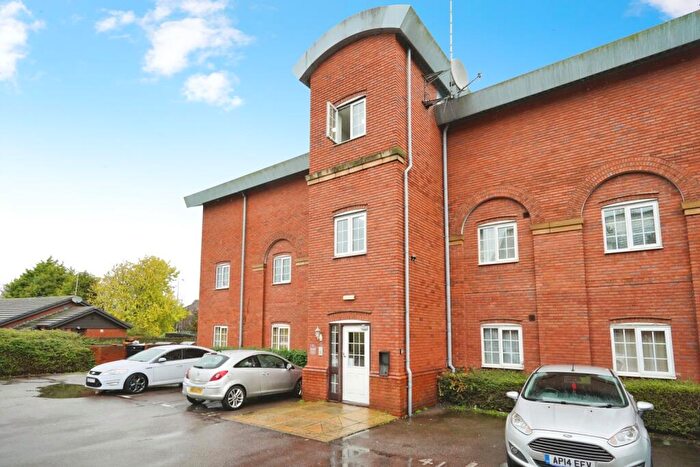
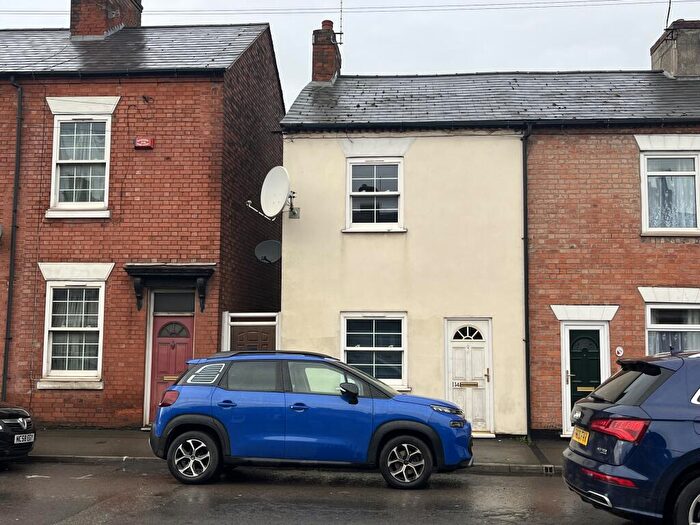
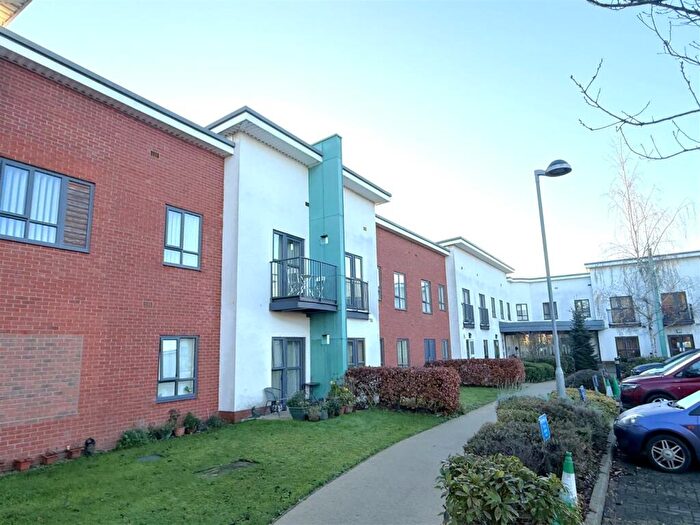
Properties for sale in Anglesey
Roads and Postcodes in Anglesey
Navigate through our locations to find the location of your next house in Anglesey, Burton-on-trent for sale or to rent.
| Streets | Postcodes |
|---|---|
| Acacia Lane | DE14 3UE |
| All Saints Croft | DE14 3EA |
| All Saints Road | DE14 3HL DE14 3LS DE14 3PJ DE14 3PL DE14 3LT |
| Alma Street | DE14 3LF |
| Anglesey Business Park | DE14 3LX |
| Anglesey Road | DE14 3NE DE14 3NF DE14 3NN DE14 3NP DE14 3NR DE14 3NS DE14 3NT DE14 3NW DE14 3PF DE14 3PP |
| Ash Street | DE14 3PX DE14 3PY |
| Bailey Street | DE14 3AN |
| Barton Street | DE14 3BE |
| Beech Street | DE14 3QA DE14 3QB |
| Blackpool Street | DE14 3AL DE14 3AR DE14 3AT DE14 3AU DE14 3AW |
| Branston Road | DE14 3BS DE14 3BT DE14 3BY DE14 3DB DE14 3DD DE14 3DQ DE14 3GP |
| Broadway Street | DE14 3NB DE14 3ND |
| Cambridge Street | DE14 3PQ |
| Caroline Court | DE14 3NG DE14 3NZ |
| Charlotte Court | DE14 3TW |
| Charrington Way | DE14 3BG DE14 3BU |
| Clarence Street | DE14 3LG |
| Crown Industrial Estate | DE14 3NX DE14 3PA |
| Dove Close | DE14 3UF |
| Evershed Way | DE14 3LU DE14 3LY |
| Harrow Drive | DE14 3AY |
| Heathley Mews | DE14 3FD |
| Jerrisons Place | DE14 3UB |
| King Street | DE14 3AE DE14 3AF DE14 3AG DE14 3BB |
| Leicester Street | DE14 3BA |
| Napier Street | DE14 3LL DE14 3LN |
| Oak Street | DE14 3PS DE14 3PT DE14 3PU |
| Osprey Drive | DE14 3UA |
| Oxford Street | DE14 3PG |
| Queen Street | DE14 3LR DE14 3LW |
| Queensbridge | DE14 3AD |
| Rose Cottage Close | DE14 3AS |
| Rose Cottage Gardens | DE14 3AQ |
| Rugby Close | DE14 3AX |
| South Broadway Street | DE14 3LZ DE14 3NA |
| South Oak Street | DE14 3PH |
| South Uxbridge Street | DE14 3LD |
| St Matthews Street | DE14 3DT |
| The Mews | DE14 3DF |
| Tiger Court | DE14 3PR |
| Trent Street | DE14 3AP |
| Uxbridge Street | DE14 3JU DE14 3JX DE14 3JY DE14 3LA DE14 3LB |
| Village Mews | DE14 3BF |
| Walker Street | DE14 3PZ |
| Watson Street | DE14 3AH |
| Winchester Drive | DE14 3AZ |
| Wood Street | DE14 3BD |
Transport near Anglesey
- FAQ
- Price Paid By Year
- Property Type Price
Frequently asked questions about Anglesey
What is the average price for a property for sale in Anglesey?
The average price for a property for sale in Anglesey is £143,702. This amount is 41% lower than the average price in Burton-on-trent. There are 1,227 property listings for sale in Anglesey.
What streets have the most expensive properties for sale in Anglesey?
The streets with the most expensive properties for sale in Anglesey are Acacia Lane at an average of £327,023, Dove Close at an average of £315,000 and Osprey Drive at an average of £275,300.
What streets have the most affordable properties for sale in Anglesey?
The streets with the most affordable properties for sale in Anglesey are South Oak Street at an average of £80,000, Queen Street at an average of £95,222 and Napier Street at an average of £95,450.
Which train stations are available in or near Anglesey?
Some of the train stations available in or near Anglesey are Burton-On-Trent, Tutbury and Hatton and Willington.
Property Price Paid in Anglesey by Year
The average sold property price by year was:
| Year | Average Sold Price | Price Change |
Sold Properties
|
|---|---|---|---|
| 2025 | £146,524 | -7% |
68 Properties |
| 2024 | £156,431 | 17% |
114 Properties |
| 2023 | £129,660 | -11% |
117 Properties |
| 2022 | £144,189 | 8% |
117 Properties |
| 2021 | £133,121 | -2% |
101 Properties |
| 2020 | £136,207 | 16% |
92 Properties |
| 2019 | £113,829 | 8% |
113 Properties |
| 2018 | £104,741 | -1% |
105 Properties |
| 2017 | £105,465 | -3% |
97 Properties |
| 2016 | £108,222 | 11% |
112 Properties |
| 2015 | £96,500 | 8% |
98 Properties |
| 2014 | £89,180 | -2% |
86 Properties |
| 2013 | £90,860 | 11% |
69 Properties |
| 2012 | £81,089 | 1% |
55 Properties |
| 2011 | £79,999 | -13% |
57 Properties |
| 2010 | £90,241 | 13% |
45 Properties |
| 2009 | £78,799 | -29% |
61 Properties |
| 2008 | £101,784 | -7% |
112 Properties |
| 2007 | £109,379 | 4% |
220 Properties |
| 2006 | £104,594 | 8% |
271 Properties |
| 2005 | £96,432 | 27% |
184 Properties |
| 2004 | £70,516 | 19% |
162 Properties |
| 2003 | £56,917 | 30% |
164 Properties |
| 2002 | £39,941 | 21% |
168 Properties |
| 2001 | £31,728 | 2% |
149 Properties |
| 2000 | £31,051 | 9% |
151 Properties |
| 1999 | £28,376 | 4% |
115 Properties |
| 1998 | £27,174 | 7% |
107 Properties |
| 1997 | £25,342 | 6% |
124 Properties |
| 1996 | £23,695 | -1% |
97 Properties |
| 1995 | £23,927 | - |
88 Properties |
Property Price per Property Type in Anglesey
Here you can find historic sold price data in order to help with your property search.
The average Property Paid Price for specific property types in the last three years are:
| Property Type | Average Sold Price | Sold Properties |
|---|---|---|
| Semi Detached House | £198,824.00 | 40 Semi Detached Houses |
| Detached House | £339,026.00 | 18 Detached Houses |
| Terraced House | £121,541.00 | 218 Terraced Houses |
| Flat | £105,027.00 | 23 Flats |

