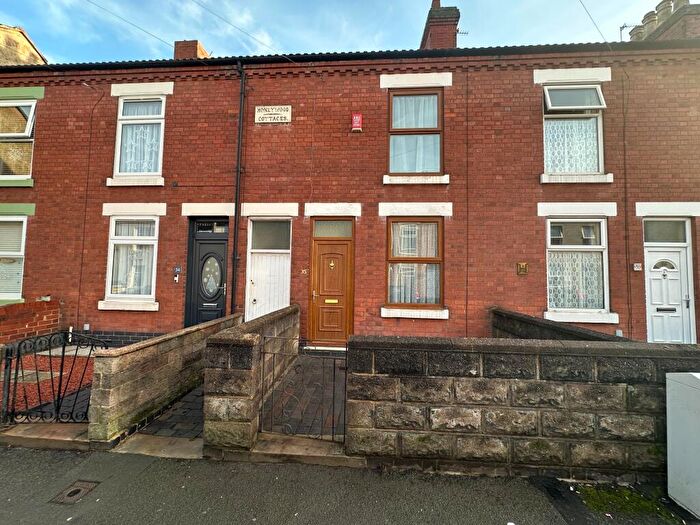
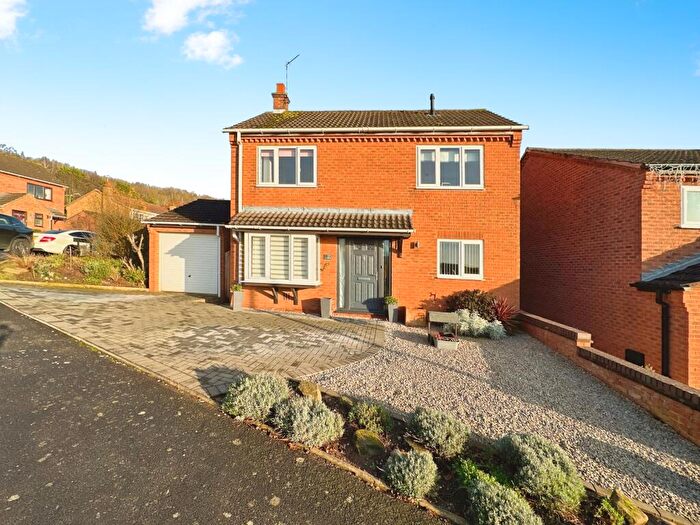
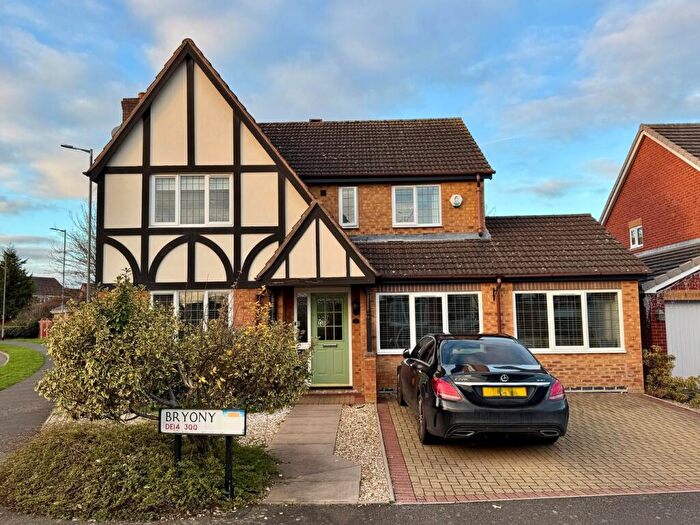
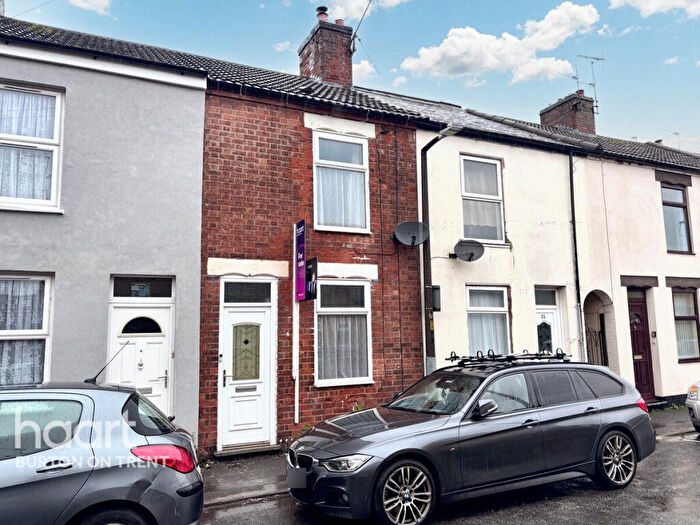
Houses for sale & to rent in Burton, Burton-on-trent


House Prices in Burton

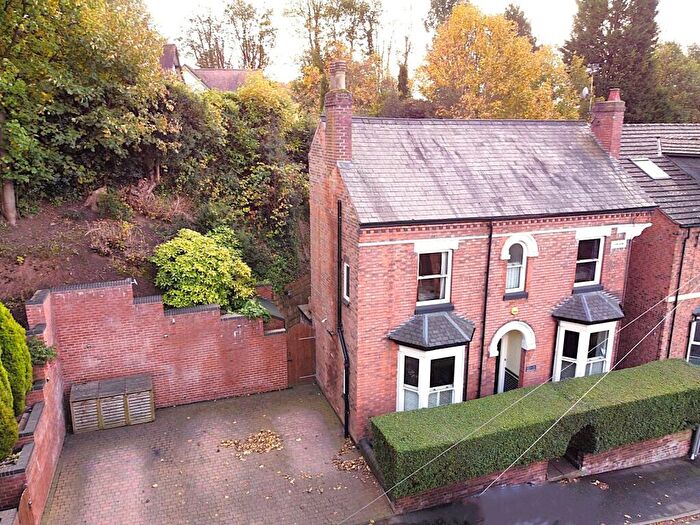
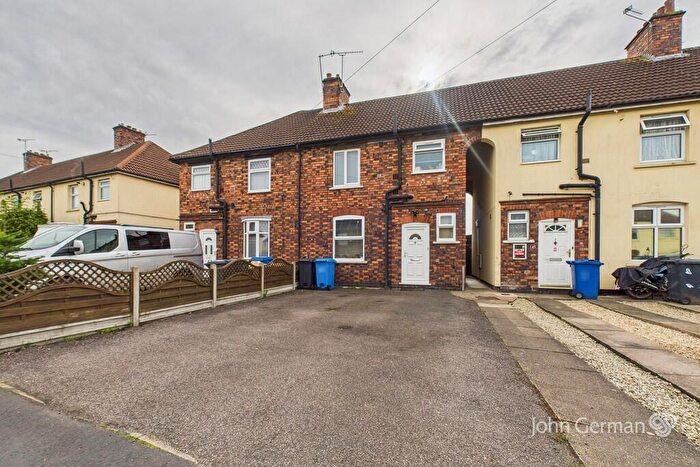
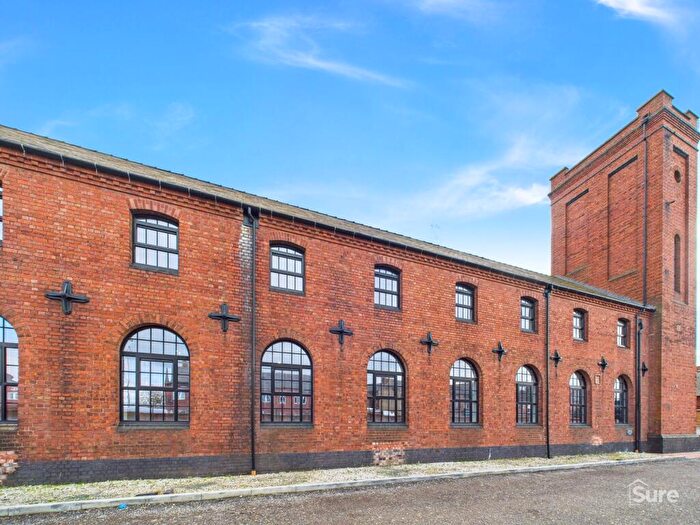
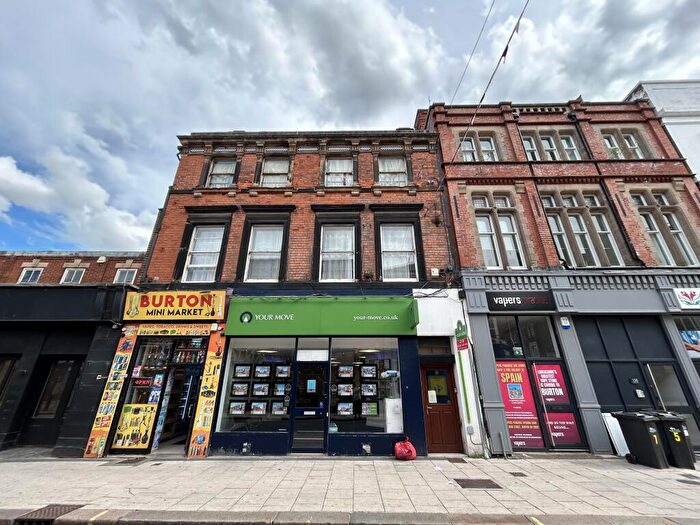
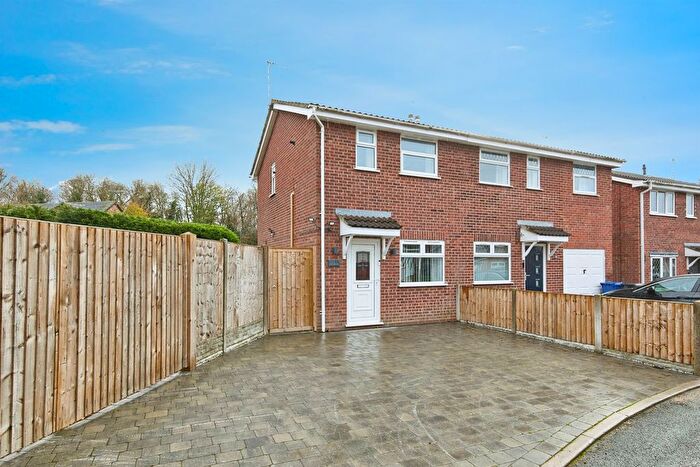
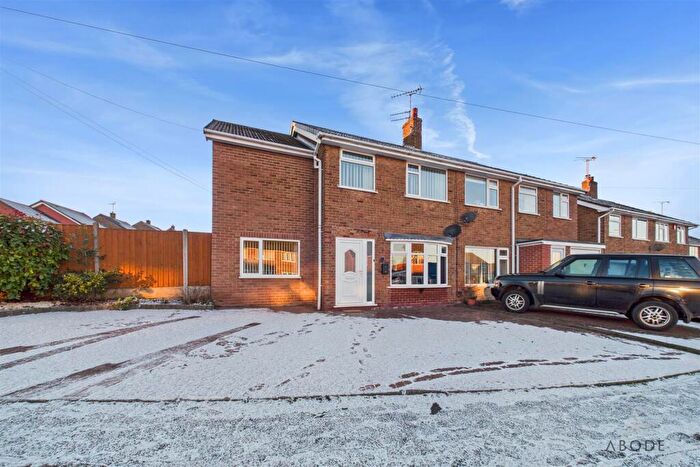
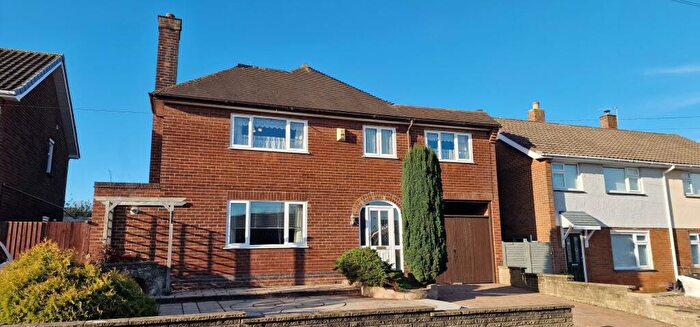
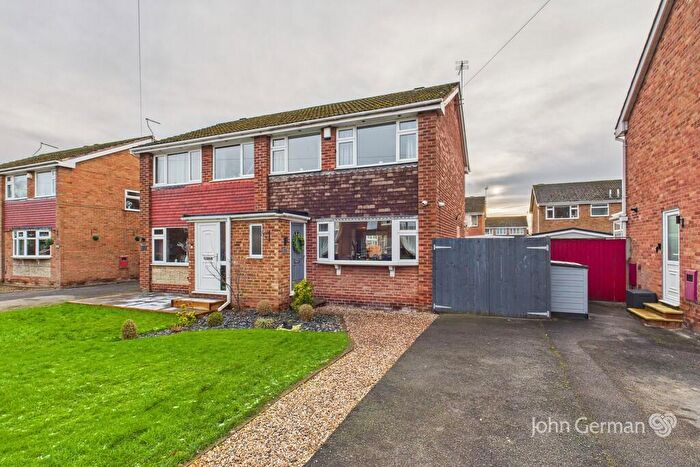
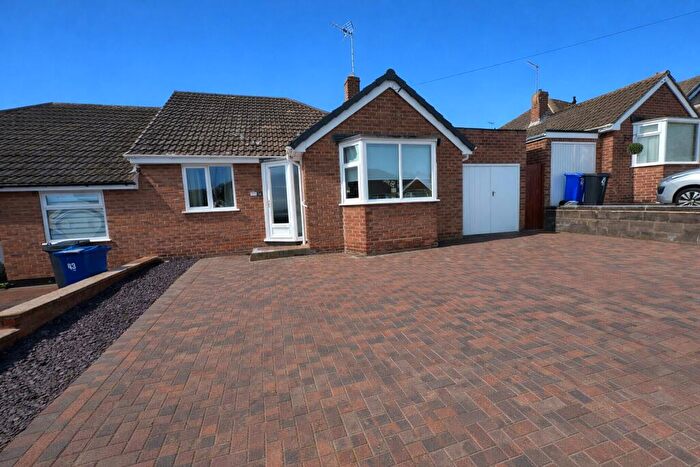
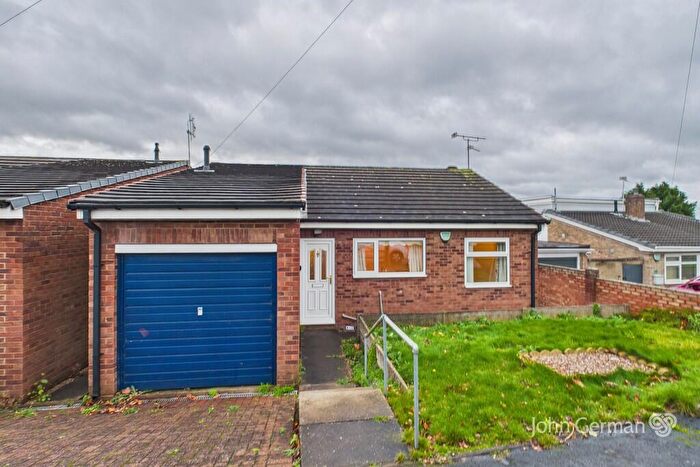
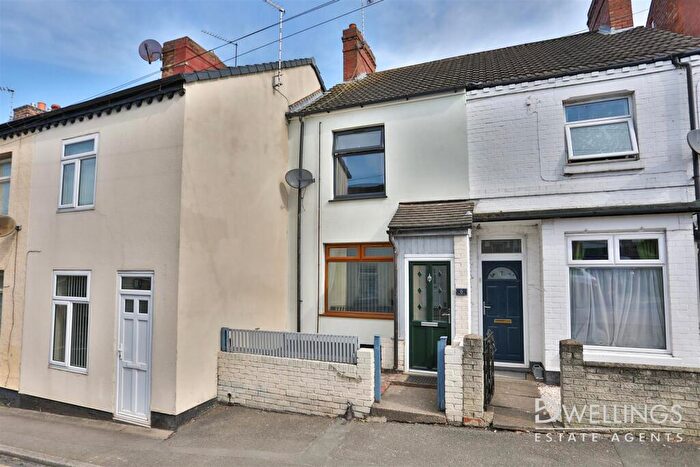
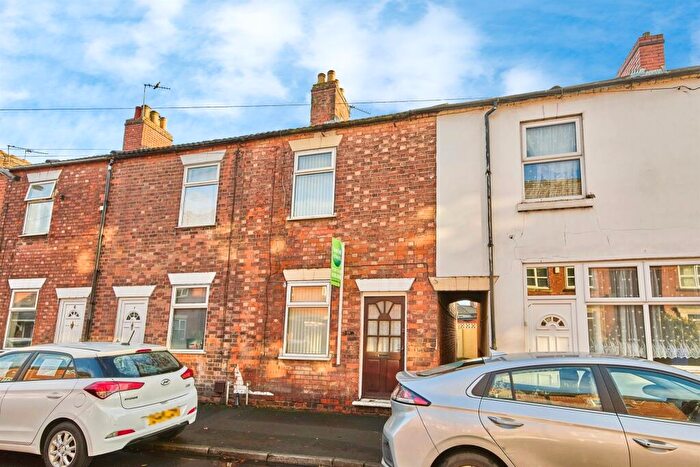
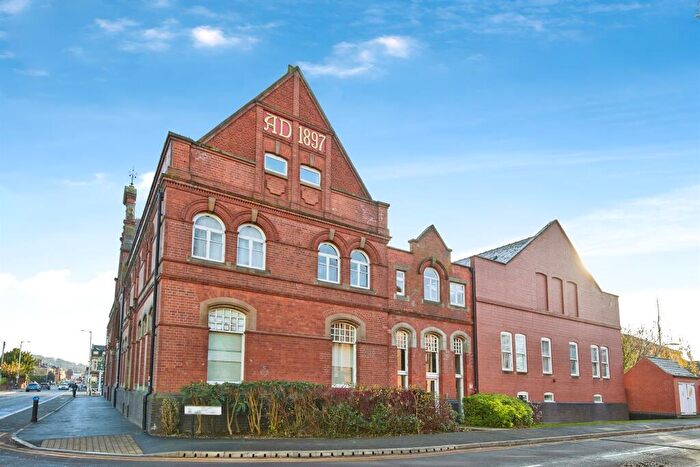
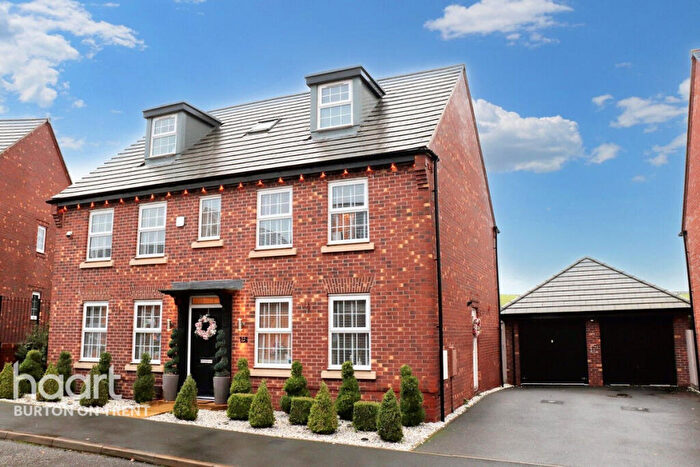
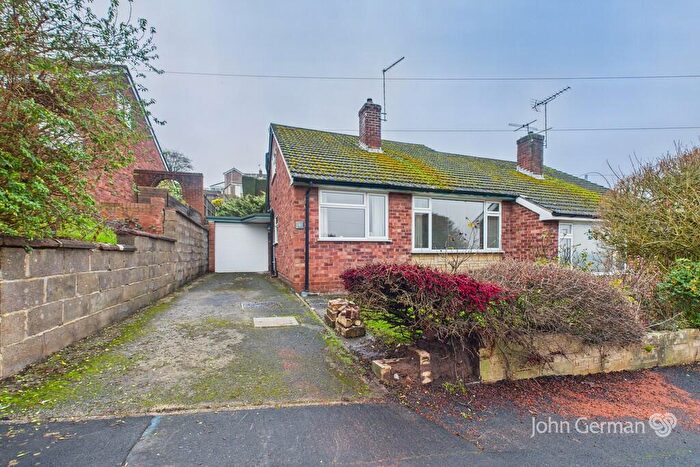
Properties in Burton have an average house price of £161,628.00 and had 390 Property Transactions within the last 3 years¹.
Burton is an area in Burton-on-trent, Staffordshire with 1,771 households², where the most expensive property was sold for £550,000.00.


Properties for sale in Burton

icon

Be the first to know about new property listings

Save this search to be notified as soon as new listings are available.


Roads and Postcodes in Burton

Navigate through our locations to find the location of your next house in Burton, Burton-on-trent for sale or to rent.

Streets Postcodes
A P S Industrial Park DE14 1PL
Abbey Arcade DE14 1HQ
Anderstaff Industrial Estate DE14 1QH
Blythfield DE14 1TU
Bond Street DE14 3RZ
Bramling Cross Road DE14 1DH
Branston Road DE14 3BP
Bridge Street DE14 1SY
Burton Enterprise Park DE14 1QG
Burton Place DE14 1BU
Canal Street DE14 3TB
Cascade Close DE14 1DX
Catherine Court DE14 3TJ
Caxton Court DE14 3SH
Churnet Court DE14 1TX
Clarke Industrial Estate DE14 1QT
Coopers Square DE14 1DF DE14 1DG
Cross Street DE14 1EF DE14 1EG DE14 1EP
Dale Street DE14 3TE DE14 3TG
Dame Paulet Walk DE14 1DQ
Derby Road DE14 1RF
Derwent Close DE14 1TS
Derwent Park DE14 1QA
Duke Street DE14 1EA DE14 1EB
Electric Street DE14 1RE DE14 1RQ
Evershed Way DE14 3LH
Falcon Close DE14 1BB DE14 1SG
Femwork Industrial Estate DE14 1QE
Finings Court DE14 3TZ
Fleet Street DE14 3RS
Friars Walk DE14 1HS
George Street DE14 1DP
Glensyl Way DE14 1LX
Golding Crescent DE14 1SQ
Gough Side DE14 1AP
Granary Wharf Business Park DE14 1DU
Grants Yard DE14 1BD DE14 1BW DE14 1BY
Green Street DE14 3RY DE14 3RT
Guild Street DE14 1NB DE14 1NA
H C M Industrial Estate DE14 1QR
Hawkins Lane DE14 1PT DE14 1PX DE14 1AE DE14 1EJ
Hay Wharf Road DE14 1AB
Hazelwell Avenue DE14 1PU
High Street DE14 1HU DE14 1LD DE14 1LJ DE14 1AH DE14 1HN DE14 1HX DE14 1JA DE14 1JE DE14 1JF DE14 1JG DE14 1JN DE14 1JP DE14 1JS DE14 1JW DE14 1JY DE14 1JZ DE14 1LL DE14 1TL
Hopwood Lane DE14 1ST
Horninglow Street DE14 1DJ DE14 1NG DE14 1PG DE14 1PJ DE14 1NJ DE14 1NR DE14 1NT DE14 1PA DE14 1PH DE14 1PN
James Court DE14 3ST
James Street DE14 3SB DE14 3SS
Lichfield Street DE14 3RH DE14 3QZ DE14 3RD DE14 3RE DE14 3RL
Manor Croft DE14 1HJ
Manor Industrial Estate DE14 1QX
Market Place DE14 1HA DE14 1HB
Meadow Lane DE13 0DB
Meadow Road DE14 1TD
Middleway Park DE14 1NQ
Milton Street DE14 1ED DE14 1EE
Moor Street DE14 3SU DE14 3SZ DE14 3SX DE14 3SY
Moseley Street DE14 1DW
Mosley Street DE14 1DR DE14 1DS DE14 1ER
New Street DE14 3QW DE14 3QY DE14 3QN DE14 3SL DE14 3SN
Northside Business Park DE14 1DB
Octagon Centre DE14 3QJ DE14 3TN
Orchard Park DE14 3TU
Orchard Street DE14 3SJ
Ordish Court DE14 3SP
Ordish Street DE14 3SA
Osprey Drive DE14 3RQ
Paget Street DE14 3TQ
Park Mews DE14 3AJ
Park Street DE14 3SE DE14 3FR DE14 3SW
Pembroke Way DE14 1PY
Perle Road DE14 1DN
Riverside Gardens DE14 1RA
Riverside Park DE14 1RJ DE14 1RL
Robinsons Walk DE14 1DT
Russell Street DE14 1EN
Salt Walk DE14 1AJ
Severn Drive DE14 1TT
Shannon Approach DE14 1AQ
Sheffield Street DE14 3LE DE14 3QT
Sidings Industrial Estate DE14 1SB
Sovereign Business Park DE14 1PD
St Modwens Walk DE14 1HL
St Peters Bridge DE14 3RJ
St Peters Retail Park DE14 3BL
Stanley Street DE14 1DY
Station Street DE14 1AN DE14 1BH DE14 1BN DE14 1BT DE14 1AU DE14 1AX DE14 1BG DE14 1BJ DE14 1BS DE14 1BX DE14 1DL DE14 1DZ DE14 1SZ
Station Street Business Centre DE14 1AZ
Swan Walk DE14 1DD
The Abbey DE14 3RW
The Maltings DE14 1SE
The Willows DE14 3TT
Trent Industrial Estate DE14 1QY
Trinity Square DE14 1BL
Underhill Walk DE14 1DE
Union Street DE14 1AA
Uxbridge Street DE14 3JR DE14 3JS
Wetmore Lane DE14 1RH
Wetmore Road DE14 1QS DE14 1QZ DE14 1RB DE14 1RD DE14 1SN DE14 1SP DE14 1LS DE14 1QN DE14 1SH DE14 1SJ DE14 1SL DE14 1SS DE14 1SW DE14 1TR
Wetmore Road Industrial Estate DE14 1QL
Wharf Road DE14 1PZ
Windsor Industrial Estate DE14 1QF
Wood Court DE14 3DX
Wood Street DE14 3AA DE14 3AB
Worthington Way DE14 1BQ
Wyllie Mews DE14 1BF
DE13 0YL DE13 7LB DE13 7ZU DE13 8YS DE14 1HH DE14 1QB DE14 1XA DE14 1ZT DE14 2BW DE14 2WU DE14 2XE DE14 2ZB DE14 3HG DE14 3WB DE14 3ZT DE14 9BD DE14 9BR DE14 9DT DE14 9ED DE14 9EX DE14 9FQ DE14 9GU DE14 9HE DE14 9HP DE14 9HW DE14 9HZ DE14 9JG DE14 9JN DE14 9JP DE14 9JX DE14 9LF DE14 9LN DE14 9LQ DE14 9LT DE14 9LY DE14 9ND DE14 9NF DE14 9NG DE14 9NH DE14 9NJ DE14 9NL DE14 9NN DE14 9NP DE14 9NQ DE14 9NR DE14 9NS DE14 9NT DE14 9NU DE15 0XD DE15 0YX

Transport near Burton

Frequently asked questions about Burton


What is the average price for a property for sale in Burton?

The average price for a property for sale in Burton is £161,628. This amount is 32% lower than the average price in Burton-on-trent. There are 4,759 property listings for sale in Burton.


What streets have the most expensive properties for sale in Burton?

The streets with the most expensive properties for sale in Burton are Hopwood Lane at an average of £340,000, Osprey Drive at an average of £248,876 and Perle Road at an average of £240,233.


What streets have the most affordable properties for sale in Burton?

The streets with the most affordable properties for sale in Burton are Catherine Court at an average of £72,750, New Street at an average of £75,000 and Green Street at an average of £84,916.


Which train stations are available in or near Burton?

Some of the train stations available in or near Burton are Burton-On-Trent, Willington and Tutbury and Hatton.


Property Price Paid in Burton by Year

The average sold property price by year was:

Year Average Sold Price Price Change
Sold Properties icon
2024 £157,782
icon
7%
28 Properties
2023 £146,294
icon
-21%
110 Properties
2022 £177,350
icon
11%
144 Properties
2021 £157,280
icon
1%
108 Properties
2020 £155,646
icon
23%
83 Properties
2019 £120,603
icon
-4%
66 Properties
2018 £125,882
icon
-19%
83 Properties
2017 £149,221
icon
-4%
104 Properties
2016 £155,086
icon
10%
107 Properties
2015 £139,999
icon
33%
78 Properties
2014 £94,071
icon
-5%
47 Properties
2013 £98,736
icon
-1%
34 Properties
2012 £100,155
icon
3%
34 Properties
2011 £96,652
icon
-3%
37 Properties
2010 £99,415
icon
-2%
57 Properties
2009 £101,634
icon
-4%
40 Properties
2008 £105,637
icon
-8%
58 Properties
2007 £113,738
icon
-2%
143 Properties
2006 £116,127
icon
8%
148 Properties
2005 £106,881
icon
2%
167 Properties
2004 £105,238
icon
3%
171 Properties
2003 £101,915
icon
33%
161 Properties
2002 £68,377
icon
37%
113 Properties
2001 £43,378
icon
26%
65 Properties
2000 £32,264
icon
-10%
55 Properties
1999 £35,592
icon
-3%
57 Properties
1998 £36,799
icon
24%
55 Properties
1997 £28,087
icon
1%
38 Properties
1996 £27,725
icon
-4%
36 Properties
1995 £28,911
-
44 Properties
Source: Land Registry

Property Price per Property Type in Burton

Here you can find historic sold price data in order to help with your property search.

The average Property Paid Price for specific property types in the last three years are:

Property Type Average Sold Price Sold Properties
Flat £117,725.00 103 Flats
Semi Detached House £189,838.00 71 Semi Detached Houses
Terraced House £144,425.00 176 Terraced Houses
Detached House £300,298.00 40 Detached Houses
Source: Land Registry