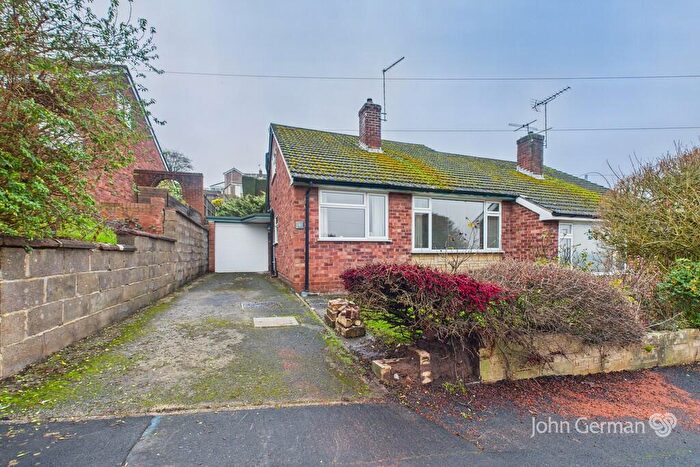
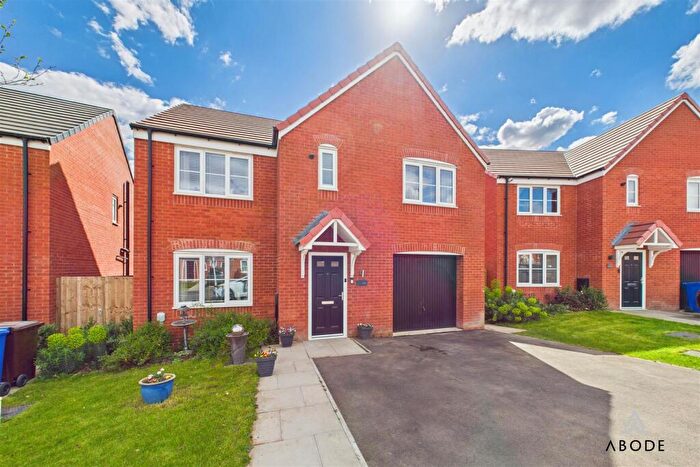
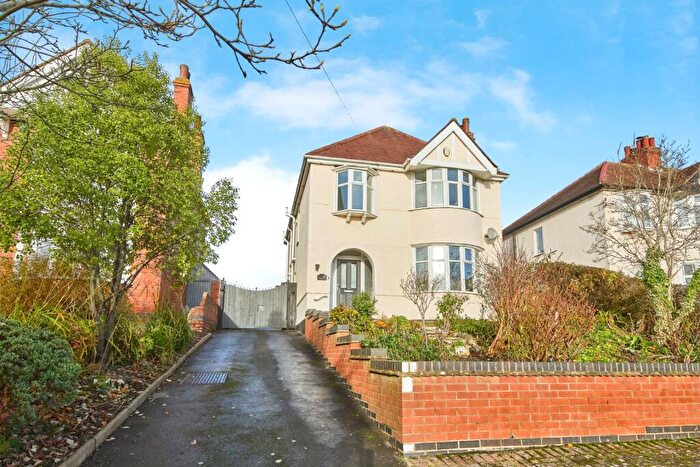
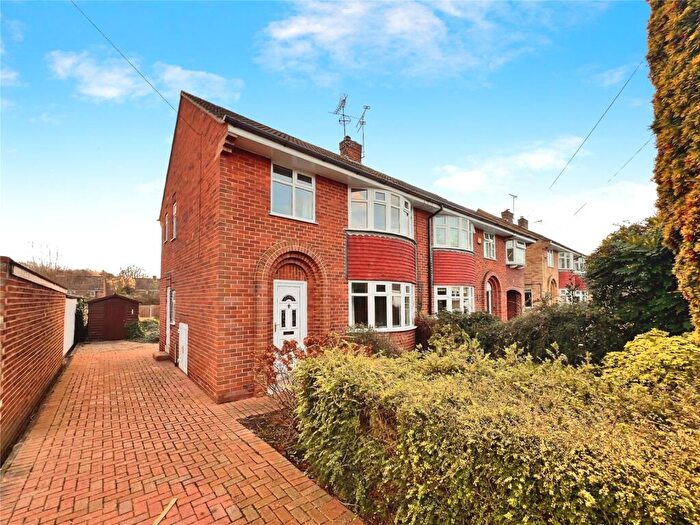
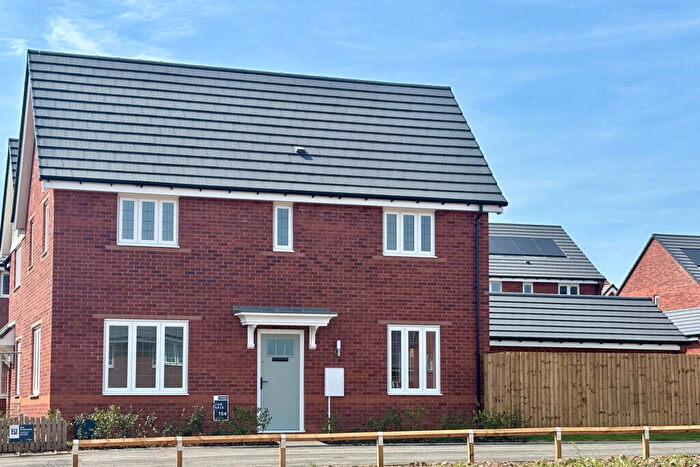
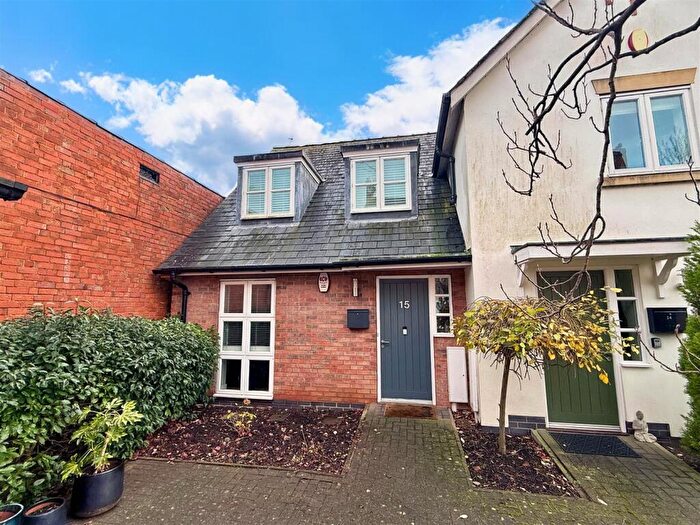
Houses for sale & to rent in Tutbury And Outwoods, Burton-on-trent
House Prices in Tutbury And Outwoods
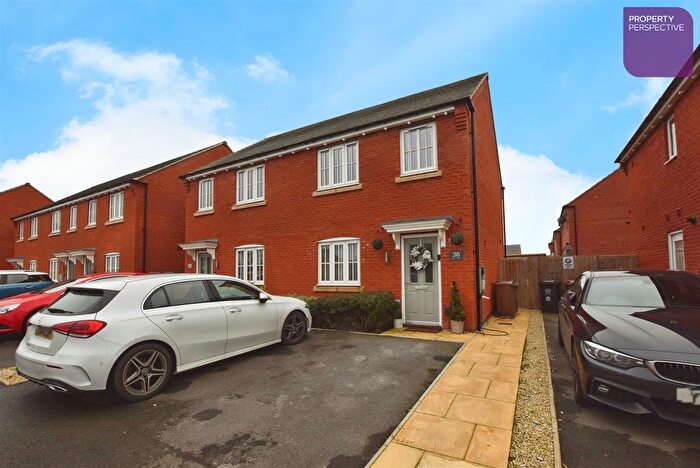
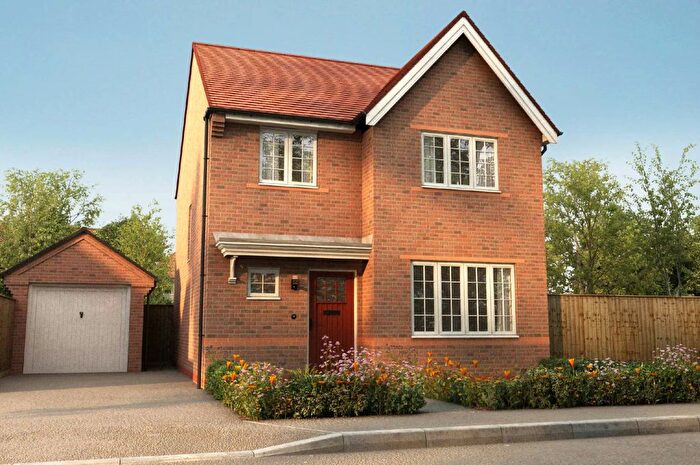
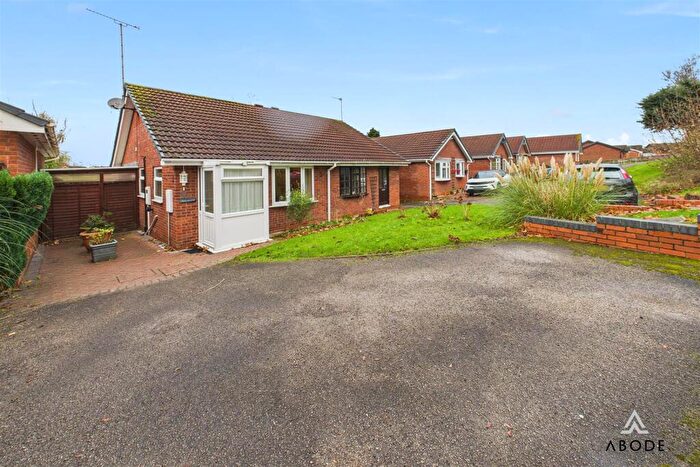
Properties in Tutbury And Outwoods have an average house price of £323,190.00 and had 459 Property Transactions within the last 3 years¹.
Tutbury And Outwoods is an area in Burton-on-trent, Staffordshire with 2,534 households², where the most expensive property was sold for £2,700,000.00.
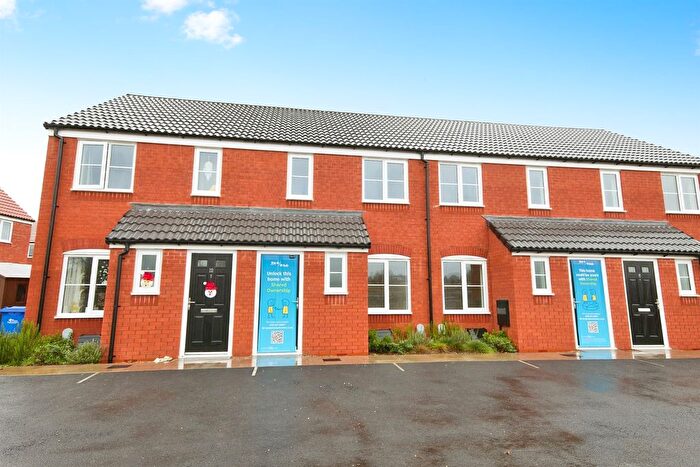
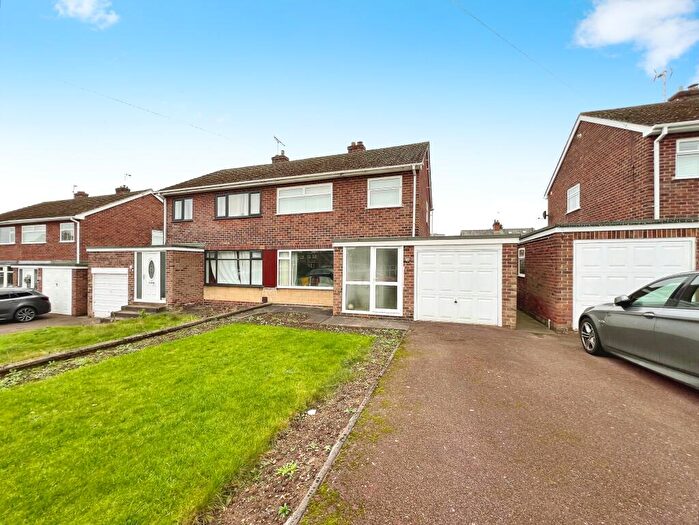
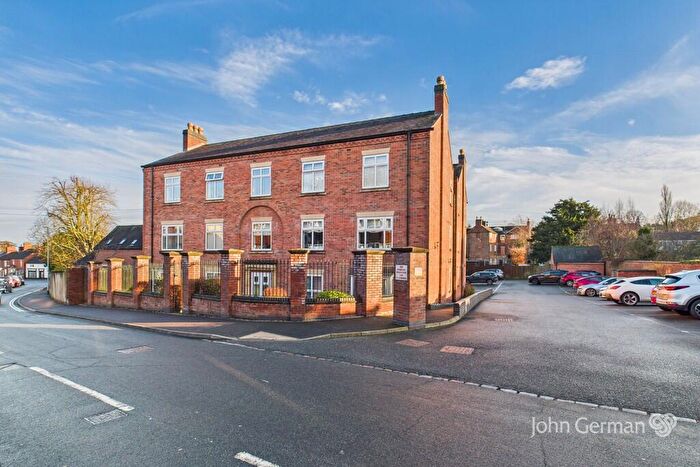
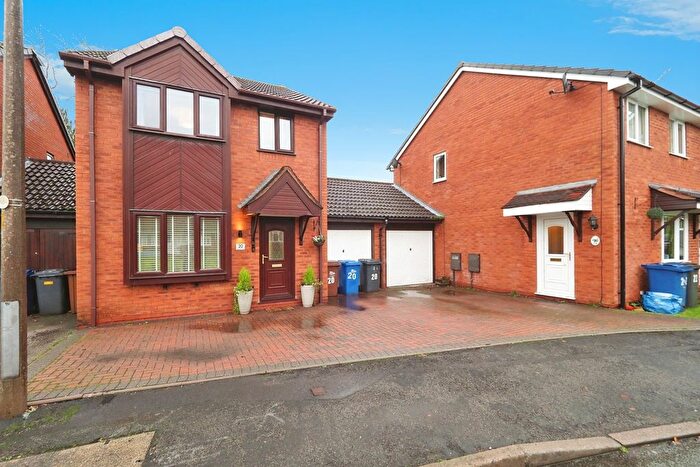
Properties for sale in Tutbury And Outwoods
Roads and Postcodes in Tutbury And Outwoods
Navigate through our locations to find the location of your next house in Tutbury And Outwoods, Burton-on-trent for sale or to rent.
| Streets | Postcodes |
|---|---|
| Abbot Road | DE13 9FX |
| Anslow Park Cottages | DE13 9QJ |
| Anslow Road | DE13 8TX DE13 9PJ |
| Ash Close | DE14 2BT |
| Babbington Close | DE13 9HX |
| Beam Close | DE13 0AH |
| Beam Hill Road | DE13 0AD DE13 0AE |
| Beamhill Road | DE13 9QN DE13 9QP DE13 9QW |
| Bell House Lane | DE13 9PA |
| Belmot Road | DE13 9HJ DE13 9NL DE13 9PH |
| Blackthorn Avenue | DE13 0UB |
| Bluebell Way | DE13 9FG DE13 9LJ DE13 9LL |
| Boundary Close | DE13 0PG |
| Bourne Close | DE13 9LH |
| Branston Road | DE13 9FF |
| Bridge Street | DE13 9LZ |
| Burton Road | DE13 9PB DE13 9HN |
| Burton Street | DE13 9DH DE13 9NR |
| Bushton Lane | DE13 9HH DE13 9QL |
| Castle Hayes Lane | DE13 9HL |
| Castle Point Business Park | DE13 9BA DE13 9DX |
| Castle Street | DE13 9JF |
| Castlegate | DE13 9NT |
| Chapel Lane | DE13 9QA |
| Chatsworth Drive | DE13 9NS |
| Chestnut Close | DE14 2FX |
| Church Street | DE13 9JE DE13 9JB |
| Close Bank | DE13 9HD |
| Cornmill Lane | DE13 9HA DE13 9HB |
| Cromwell Close | DE13 9HZ |
| Dove View | DE13 9NW |
| Duke Street | DE13 9NE DE13 9NU |
| Fauld | DE13 9GZ DE13 9GR DE13 9GW |
| Fauld Lane | DE13 9GU DE13 9GX DE13 9HS |
| Ferrers Avenue | DE13 9JJ DE13 9JP DE13 9JR |
| Field Lane | DE13 0AA DE13 0NJ DE13 0NN |
| Fishpond Lane | DE13 9NB DE13 9ND |
| Forest Edge Way | DE13 0PQ |
| Foxglove Close | DE13 9PR |
| Furrows Drive | DE13 0RH |
| Green Lane | DE13 9NN |
| Green Valley Drive | DE13 0QS |
| Hanbury Road | DE13 9QT |
| Harehedge Lane | DE13 0AS |
| Hawthorn Avenue | DE14 2FW |
| Hawthorn Grove | DE13 9AW |
| Hayfield Drive | DE13 9FQ |
| Hazel Close | DE13 0UD |
| Heather Close | DE13 9PP |
| Henhurst Hill | DE13 9SX |
| High Street | DE13 9LP DE13 9LS DE13 9LR DE13 9LT |
| Hillcrest | DE13 9JD |
| Hillside | DE13 9JG |
| Holly Road | DE13 9NX |
| Holts Lane | DE13 9LE DE13 9LF DE13 9LG |
| Honeysuckle Avenue | DE13 9NY |
| Hopley Road | DE13 9PY DE13 9PZ |
| Iron Walls Lane | DE13 9NH |
| Jubilee Cottages | DE13 9QQ |
| Kitling Greaves Lane | DE13 0PB |
| Laburnum Grove | DE13 9GY |
| Lancaster Drive | DE13 9JT |
| Laurel Cottages | DE13 9QF |
| Lavender Way | DE13 9LN |
| Leyfields Farm Mews | DE13 9UD |
| Little Bridge | DE13 9LW |
| Long Hedge Lane | DE13 9QR |
| Lount Lane | DE13 9QS |
| Lower High Street | DE13 9LU |
| Lower Outwoods Road | DE13 0QU DE13 0QX |
| Ludgate Street | DE13 9BW DE13 9NG DE13 9NQ |
| Magnolia Close | DE13 9NZ |
| Main Road | DE13 9QD DE13 9QE DE13 9QG DE13 9QX |
| Maple Drive | DE13 0SN |
| Monk Street | DE13 9NA |
| Nankirks Lane | DE13 9QB |
| Newborough Road | DE13 9PS |
| Norman Road | DE13 9JA DE13 9JZ |
| Oak Road | DE13 0QW |
| Outwoods Lane | DE13 0AB DE13 9UB DE13 9QU |
| Owens Bank | DE13 9HP |
| Park Lane | DE13 9JH DE13 9JQ |
| Pegg Court | DE13 9PT |
| Pine Grove | DE14 2FT |
| Pinfold Close | DE13 9NJ |
| Poplar Gardens | DE13 0UE |
| Poppy Close | DE13 9PN |
| Portway Drive | DE13 9HU |
| Primrose Drive | DE13 9LQ |
| Priory Close | DE13 9JS |
| Queens Rise | DE13 9LA |
| Redhill Lane | DE13 9JN DE13 9JW |
| Reservoir Road | DE14 2FS |
| Rhino Business Park | DE13 9HY |
| Ridge End Drive | DE13 0RW |
| Rolleston Park | DE13 9HQ |
| Rolleston Road | DE13 0LD |
| Rough Hayes | DE13 9PX |
| Rushton Close | DE13 9LD |
| Sherholt Road | DE13 9FJ |
| Silk Mill Lane | DE13 9DU |
| Spinney Close | DE13 9HW |
| St Georges Road | DE13 0QT |
| St Margarets | DE13 0QH |
| The Balk | DE13 9NP |
| The Close | DE13 9JL |
| The Paddocks | DE13 9QY |
| The Park Pale | DE13 9LB |
| The Sycamores | DE13 9NF |
| Tudor Court | DE13 9DL |
| Tudor Gardens | DE13 9PL |
| Tulip Road | DE13 9LX |
| Tutbury Road | DE13 0AJ DE13 0AL DE13 0NY DE13 0NZ DE13 9PQ DE13 0AN |
| Wakefield Avenue | DE13 9JU DE13 9JX DE13 9JY |
| Walton Villas | DE13 9QH |
| Willow Street | DE14 2BQ |
| Wilson Way | DE13 0TZ |
| DE13 9FH |
Transport near Tutbury And Outwoods
-
Tutbury and Hatton Station
-
Burton-On-Trent Station
-
Willington Station
-
Uttoxeter Station
-
Peartree Station
- FAQ
- Price Paid By Year
- Property Type Price
Frequently asked questions about Tutbury And Outwoods
What is the average price for a property for sale in Tutbury And Outwoods?
The average price for a property for sale in Tutbury And Outwoods is £323,190. This amount is 34% higher than the average price in Burton-on-trent. There are 2,251 property listings for sale in Tutbury And Outwoods.
What streets have the most expensive properties for sale in Tutbury And Outwoods?
The streets with the most expensive properties for sale in Tutbury And Outwoods are Bushton Lane at an average of £985,000, Bell House Lane at an average of £925,000 and Furrows Drive at an average of £542,500.
What streets have the most affordable properties for sale in Tutbury And Outwoods?
The streets with the most affordable properties for sale in Tutbury And Outwoods are St Georges Road at an average of £139,937, Bridge Street at an average of £155,300 and Queens Rise at an average of £168,375.
Which train stations are available in or near Tutbury And Outwoods?
Some of the train stations available in or near Tutbury And Outwoods are Tutbury and Hatton, Burton-On-Trent and Willington.
Property Price Paid in Tutbury And Outwoods by Year
The average sold property price by year was:
| Year | Average Sold Price | Price Change |
Sold Properties
|
|---|---|---|---|
| 2025 | £327,182 | -0,3% |
79 Properties |
| 2024 | £328,179 | -1% |
118 Properties |
| 2023 | £331,767 | 6% |
103 Properties |
| 2022 | £311,949 | 2% |
159 Properties |
| 2021 | £307,258 | 10% |
210 Properties |
| 2020 | £276,823 | -0,2% |
180 Properties |
| 2019 | £277,427 | 10% |
209 Properties |
| 2018 | £249,793 | -0,2% |
212 Properties |
| 2017 | £250,338 | 5% |
148 Properties |
| 2016 | £237,842 | 2% |
175 Properties |
| 2015 | £233,593 | 17% |
171 Properties |
| 2014 | £193,910 | -5% |
133 Properties |
| 2013 | £203,769 | -10% |
123 Properties |
| 2012 | £225,041 | 24% |
96 Properties |
| 2011 | £171,276 | -19% |
63 Properties |
| 2010 | £203,886 | 8% |
66 Properties |
| 2009 | £186,904 | -7% |
70 Properties |
| 2008 | £199,561 | -12% |
68 Properties |
| 2007 | £223,640 | 13% |
150 Properties |
| 2006 | £194,282 | 9% |
134 Properties |
| 2005 | £176,273 | 5% |
100 Properties |
| 2004 | £167,977 | 9% |
117 Properties |
| 2003 | £153,622 | 10% |
122 Properties |
| 2002 | £137,758 | 18% |
186 Properties |
| 2001 | £113,538 | 30% |
176 Properties |
| 2000 | £79,478 | 9% |
108 Properties |
| 1999 | £72,322 | -10% |
102 Properties |
| 1998 | £79,368 | 20% |
103 Properties |
| 1997 | £63,276 | 5% |
116 Properties |
| 1996 | £59,936 | 4% |
76 Properties |
| 1995 | £57,609 | - |
66 Properties |
Property Price per Property Type in Tutbury And Outwoods
Here you can find historic sold price data in order to help with your property search.
The average Property Paid Price for specific property types in the last three years are:
| Property Type | Average Sold Price | Sold Properties |
|---|---|---|
| Flat | £170,455.00 | 20 Flats |
| Semi Detached House | £253,962.00 | 101 Semi Detached Houses |
| Detached House | £408,849.00 | 251 Detached Houses |
| Terraced House | £191,540.00 | 87 Terraced Houses |

