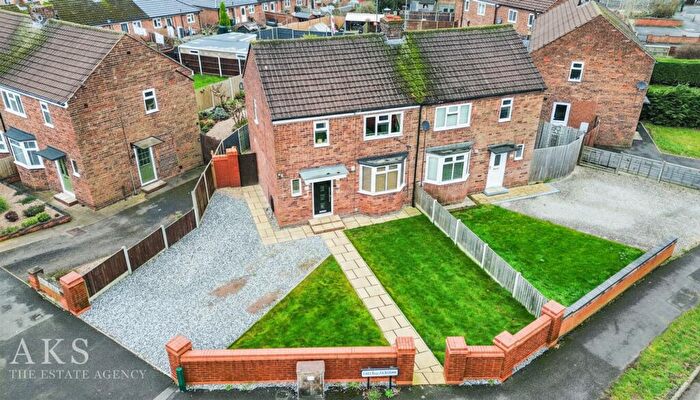
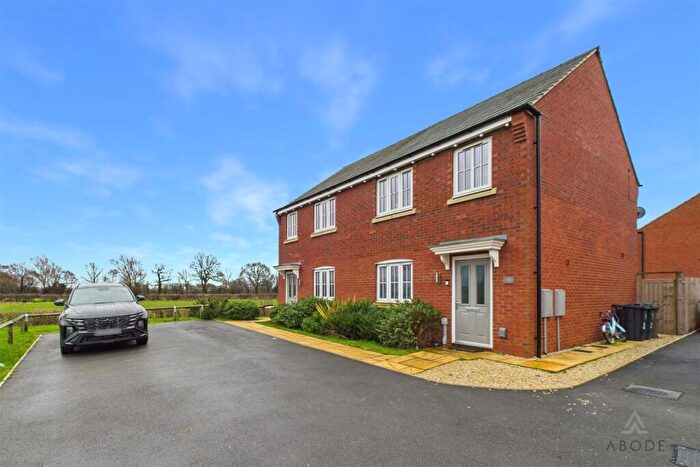
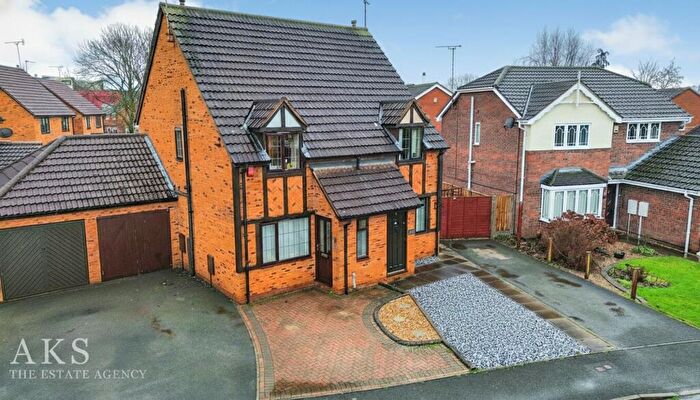
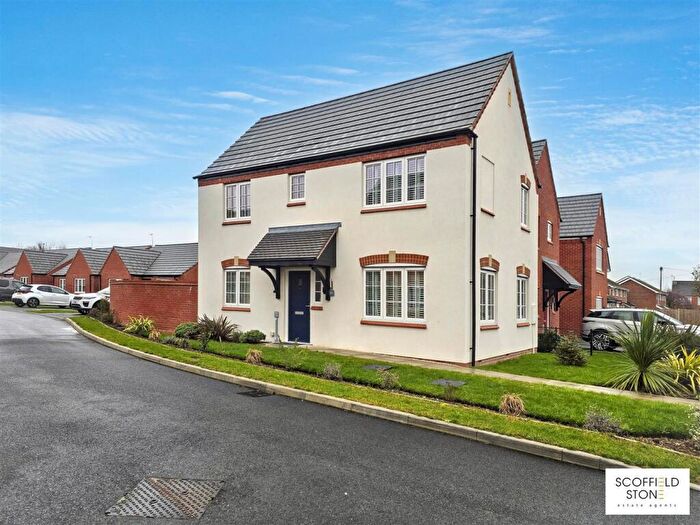
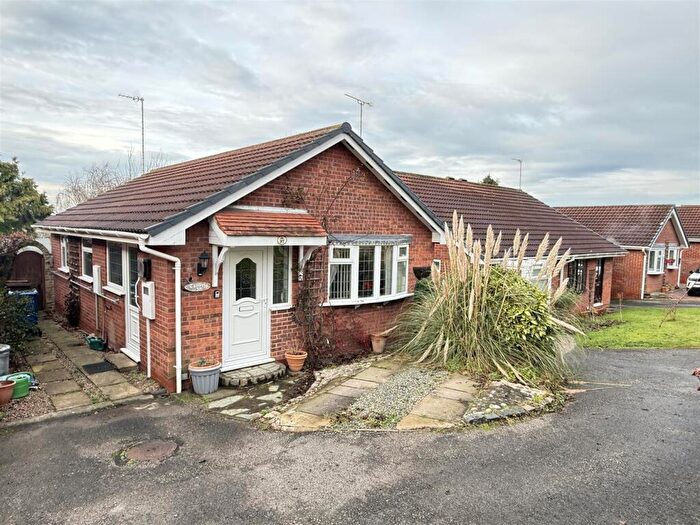
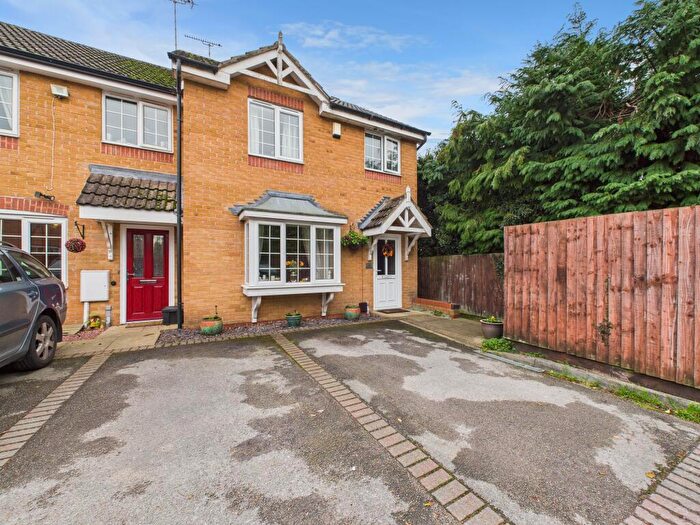
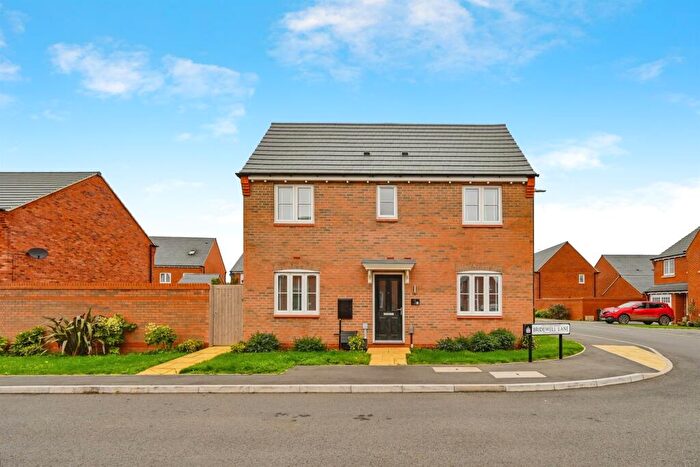
Houses for sale & to rent in Hatton, Derby
House Prices in Hatton
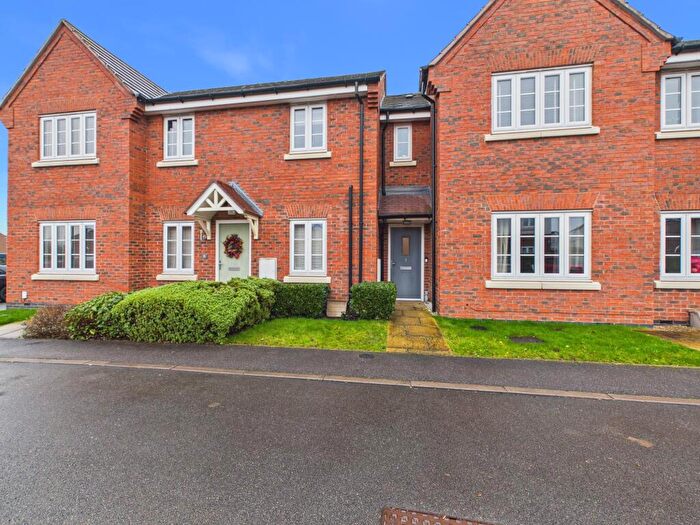
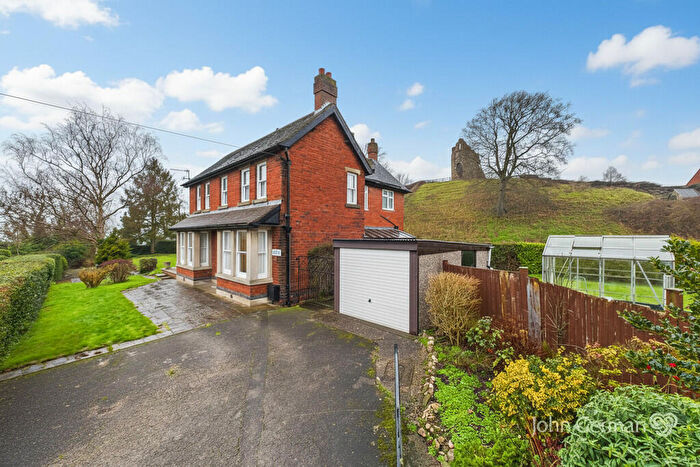
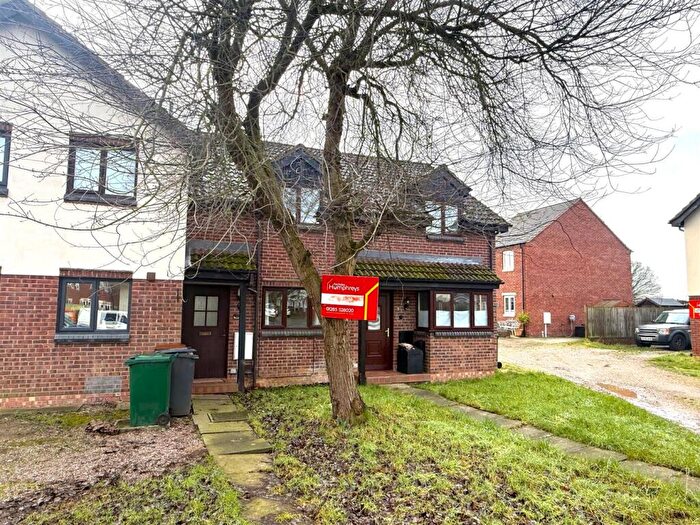
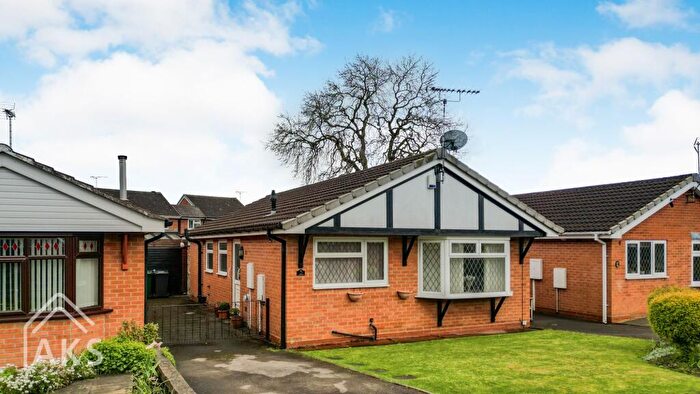
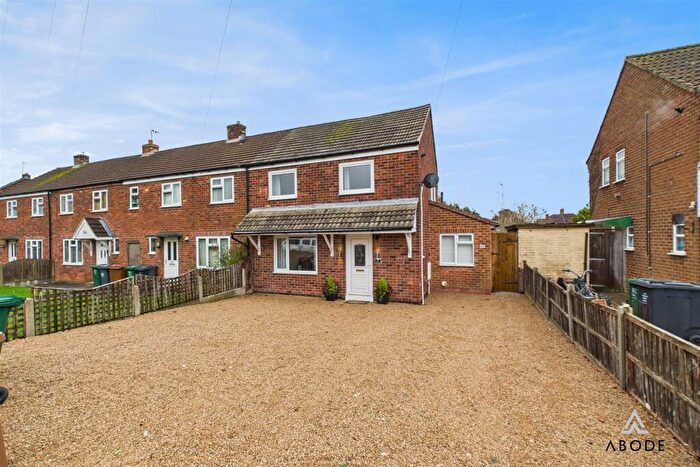
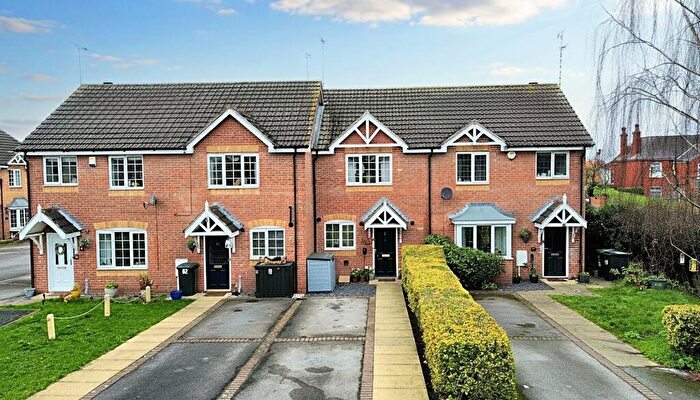
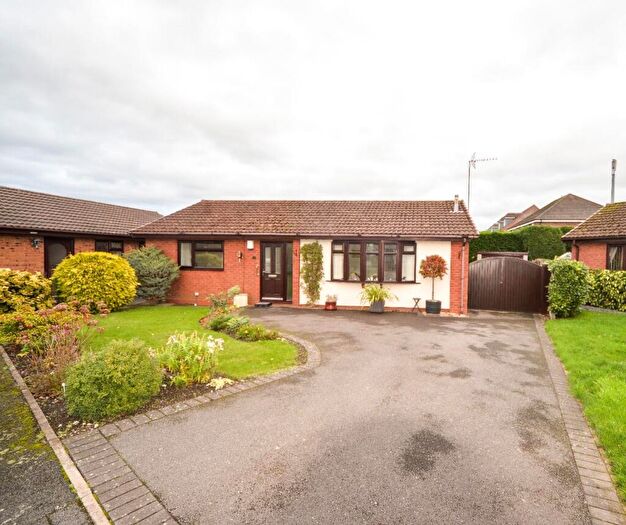
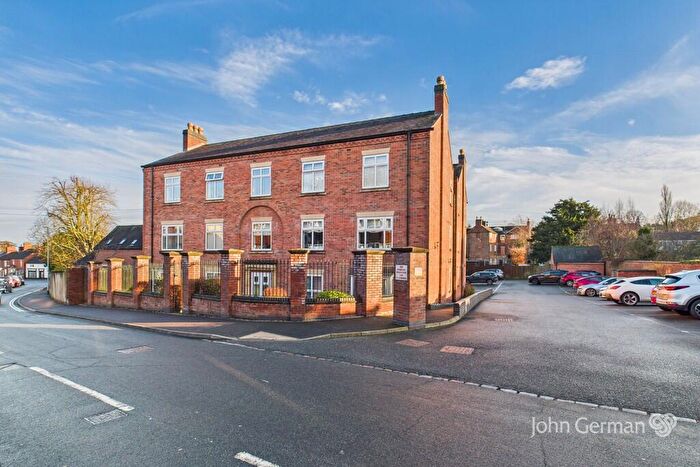
Properties in Hatton have an average house price of £202,042.00 and had 98 Property Transactions within the last 3 years¹.
Hatton is an area in Derby, Derbyshire with 1,096 households², where the most expensive property was sold for £372,500.00.
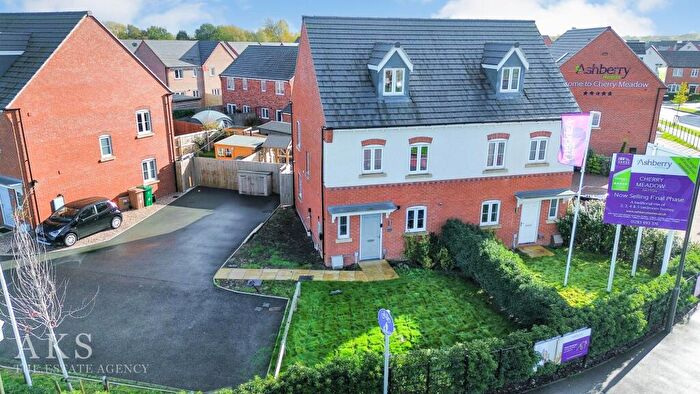
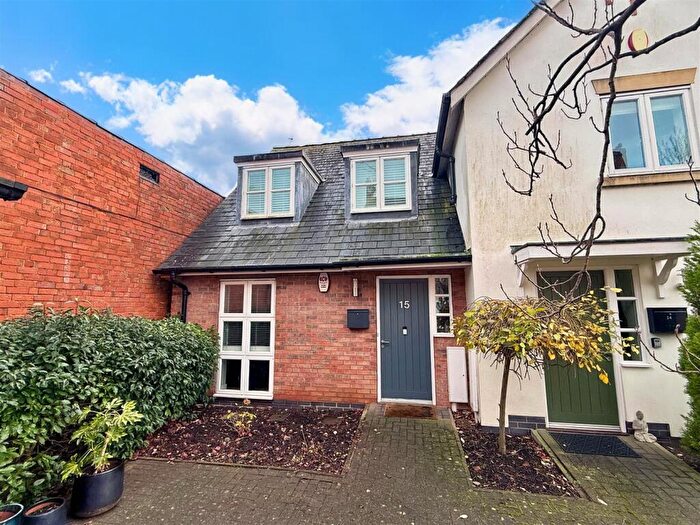
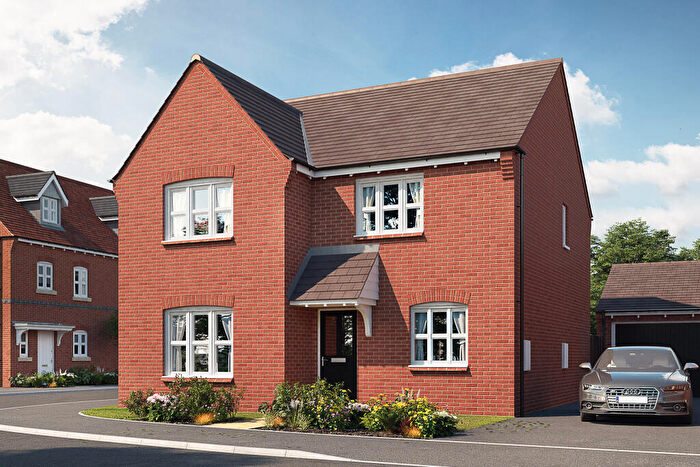
Properties for sale in Hatton
Roads and Postcodes in Hatton
Navigate through our locations to find the location of your next house in Hatton, Derby for sale or to rent.
| Streets | Postcodes |
|---|---|
| Albany Gardens | DE65 5RJ |
| Appletree Road | DE65 5EF |
| Balmoral Way | DE65 5RG |
| Barnwell Road | DE65 5SD |
| Birch Grove | DE65 5EG |
| Blossom Walk | DE65 5QS |
| Bradshaw Meadow | DE65 5QA |
| Bramley Court | DE65 5QT |
| Bridewell Lane | DE65 5RP |
| Brook Close | DE65 5EW |
| Carlton Lane | DE65 5RH |
| Castle View | DE65 5QL |
| Church Avenue | DE65 5DP |
| Church Mews | DE65 5QG |
| Claremont Lane | DE65 5RR |
| Clarence Drive | DE65 5RY |
| Clayton Gardens | DE65 5EB |
| Coopers Croft | DE65 5QE |
| Crosby Drive | DE65 5RE |
| Dove Place | DE65 5AB |
| Dove Side | DE65 5DZ |
| Eaton Close | DE65 5ED |
| Field Avenue | DE65 5EQ DE65 5ER |
| Flax Croft | DE65 5QJ |
| Foston Close | DE65 5ES |
| Frogmore Lane | DE65 5SA |
| Granville Close | DE65 5EU |
| Hanbury Avenue | DE65 5HG |
| Hassall Road | DE65 5HL |
| Hatfield Lane | DE65 5RF |
| Heathway | DE65 5EN DE65 5EP |
| Highgrove Gardens | DE65 5RS |
| Holme Close | DE65 5EE |
| Hoon Road | DE65 5DQ |
| Jinny Close | DE65 5EZ |
| Kensington Drive | DE65 5RU |
| Ley Croft | DE65 5QD |
| Lime Grove | DE65 5EY |
| Marston Old Lane | DE65 5DY |
| Mercia Close | DE65 5DR |
| Oakwood Close | DE65 5QN |
| Peters Court | DE65 5JG |
| Richmond Crescent | DE65 5SB |
| Rogers Court | DE65 5JU |
| Russet Close | DE65 5QR |
| Ryeflatts Lane | DE65 5ET |
| Sandringham Close | DE65 5RQ |
| Scropton Old Road | DE65 5DX |
| Scropton Road | DE65 5DS |
| Station Road | DE65 5DU DE65 5DW DE65 5EH DE65 5EJ DE65 5EL |
| The Hayes | DE65 5QB |
| The Shieling | DE65 5QF |
| Windsor Avenue | DE65 5RN |
| Woodmans Croft | DE65 5QQ |
| Wren Close | DE65 5RL |
| Yew Tree Court | DE65 5QH |
| Yew Tree Road | DE65 5EX |
| DE65 5WH DE65 9AB DE65 9BN DE65 9BR DE65 9DJ DE65 9DX DE65 9DY DE65 9DZ DE65 9EA DE65 9EB DE65 9EG DE65 9EL DE65 9EP DE65 9ES |
Transport near Hatton
-
Tutbury and Hatton Station
-
Burton-On-Trent Station
-
Willington Station
-
Uttoxeter Station
-
Peartree Station
-
Derby Station
- FAQ
- Price Paid By Year
- Property Type Price
Frequently asked questions about Hatton
What is the average price for a property for sale in Hatton?
The average price for a property for sale in Hatton is £202,042. This amount is 35% lower than the average price in Derby. There are 329 property listings for sale in Hatton.
What streets have the most expensive properties for sale in Hatton?
The streets with the most expensive properties for sale in Hatton are Church Avenue at an average of £372,500, Granville Close at an average of £350,000 and The Hayes at an average of £325,000.
What streets have the most affordable properties for sale in Hatton?
The streets with the most affordable properties for sale in Hatton are Ley Croft at an average of £136,500, Dove Place at an average of £145,375 and Blossom Walk at an average of £150,000.
Which train stations are available in or near Hatton?
Some of the train stations available in or near Hatton are Tutbury and Hatton, Burton-On-Trent and Willington.
Property Price Paid in Hatton by Year
The average sold property price by year was:
| Year | Average Sold Price | Price Change |
Sold Properties
|
|---|---|---|---|
| 2025 | £200,268 | -1% |
25 Properties |
| 2024 | £202,545 | -0,1% |
43 Properties |
| 2023 | £202,800 | 1% |
30 Properties |
| 2022 | £201,200 | 9% |
46 Properties |
| 2021 | £183,165 | 1% |
70 Properties |
| 2020 | £181,709 | 7% |
52 Properties |
| 2019 | £168,247 | 13% |
48 Properties |
| 2018 | £146,795 | -7% |
56 Properties |
| 2017 | £157,194 | -5% |
43 Properties |
| 2016 | £164,394 | 12% |
55 Properties |
| 2015 | £143,947 | -3% |
61 Properties |
| 2014 | £147,862 | 9% |
78 Properties |
| 2013 | £134,655 | -0,4% |
43 Properties |
| 2012 | £135,235 | 3% |
38 Properties |
| 2011 | £131,849 | 8% |
30 Properties |
| 2010 | £121,716 | -0,1% |
33 Properties |
| 2009 | £121,873 | -6% |
32 Properties |
| 2008 | £129,360 | -3% |
25 Properties |
| 2007 | £133,366 | -11% |
69 Properties |
| 2006 | £147,391 | 10% |
76 Properties |
| 2005 | £132,720 | 17% |
70 Properties |
| 2004 | £109,597 | 10% |
73 Properties |
| 2003 | £98,366 | 22% |
69 Properties |
| 2002 | £76,765 | 15% |
80 Properties |
| 2001 | £65,205 | 10% |
118 Properties |
| 2000 | £58,734 | 12% |
48 Properties |
| 1999 | £51,942 | 12% |
71 Properties |
| 1998 | £45,717 | -9% |
64 Properties |
| 1997 | £49,619 | 7% |
102 Properties |
| 1996 | £46,068 | 4% |
127 Properties |
| 1995 | £44,184 | - |
49 Properties |
Property Price per Property Type in Hatton
Here you can find historic sold price data in order to help with your property search.
The average Property Paid Price for specific property types in the last three years are:
| Property Type | Average Sold Price | Sold Properties |
|---|---|---|
| Semi Detached House | £207,259.00 | 26 Semi Detached Houses |
| Detached House | £264,653.00 | 26 Detached Houses |
| Terraced House | £167,689.00 | 39 Terraced Houses |
| Flat | £141,500.00 | 7 Flats |

