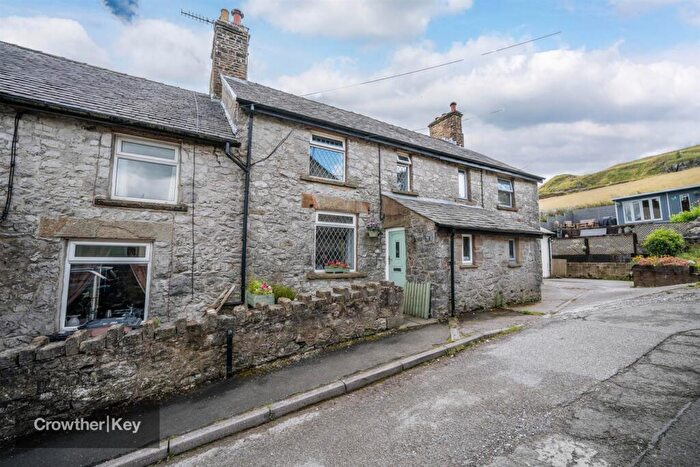
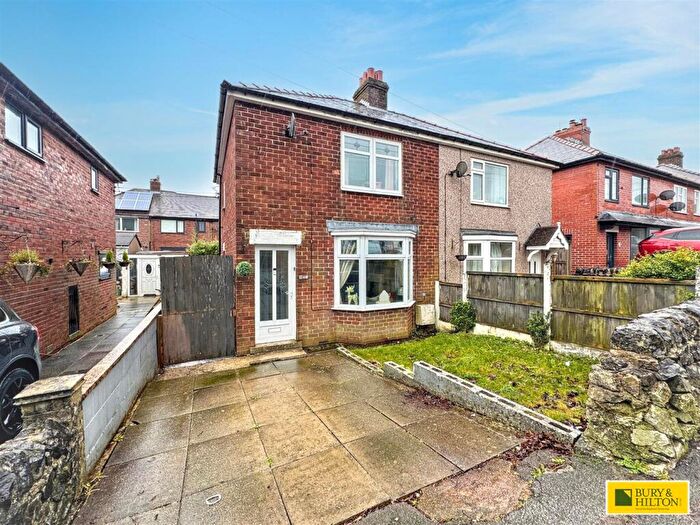
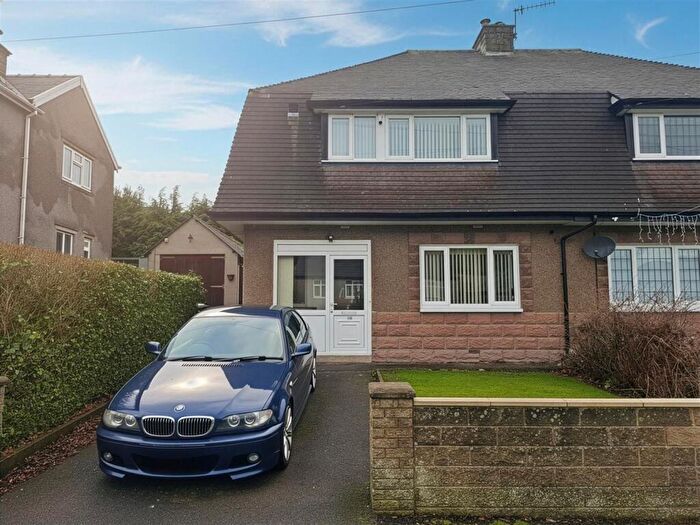
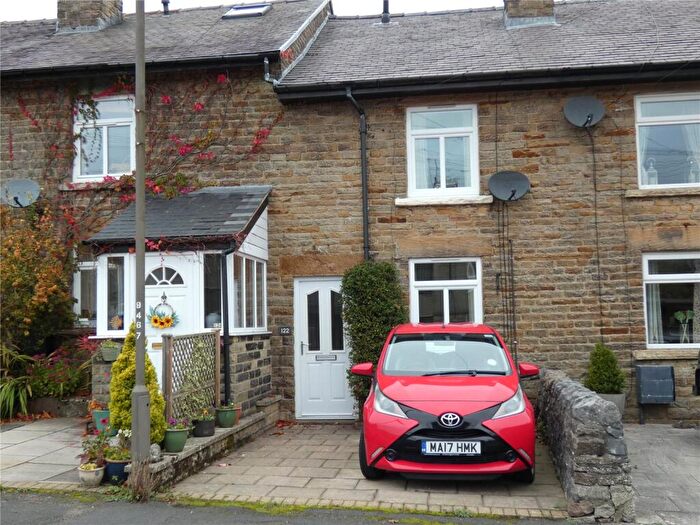
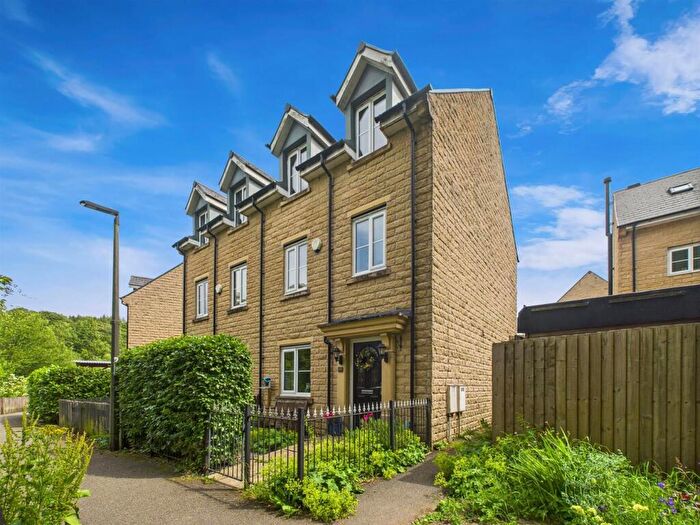
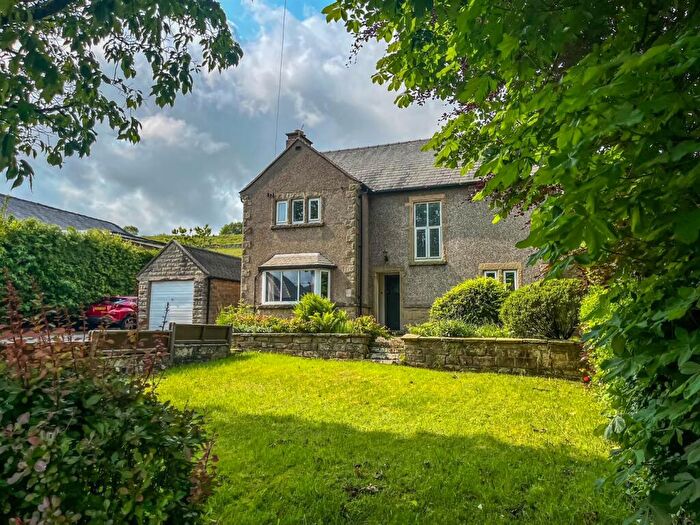
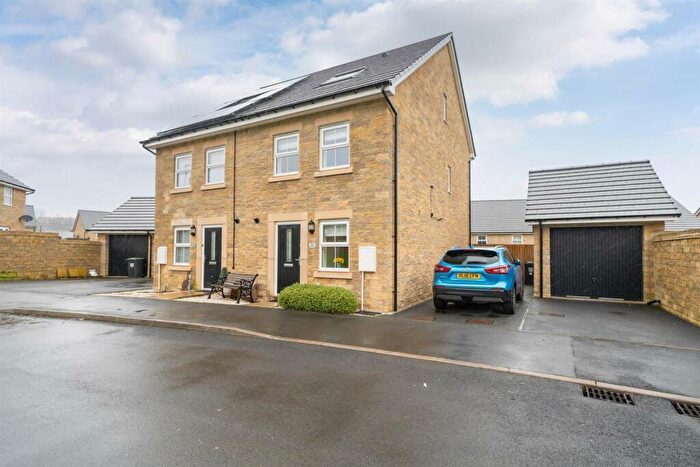
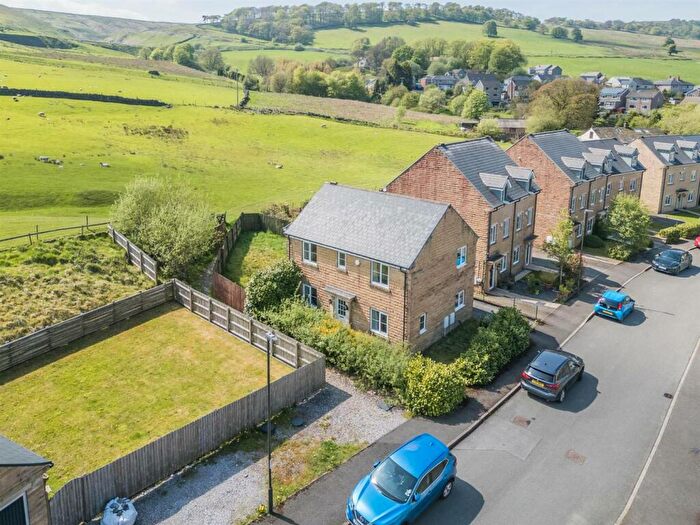
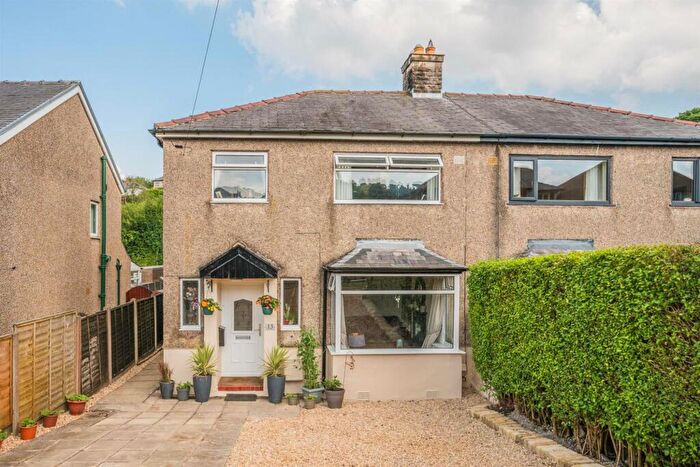
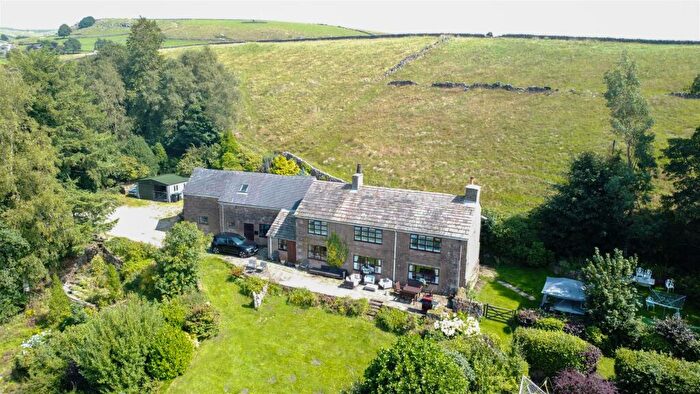
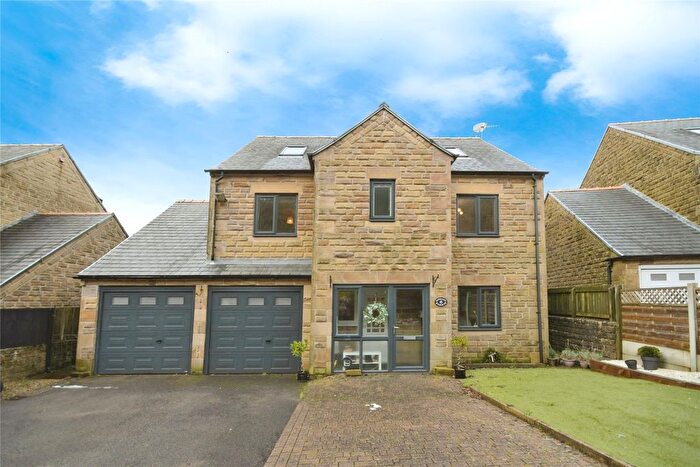
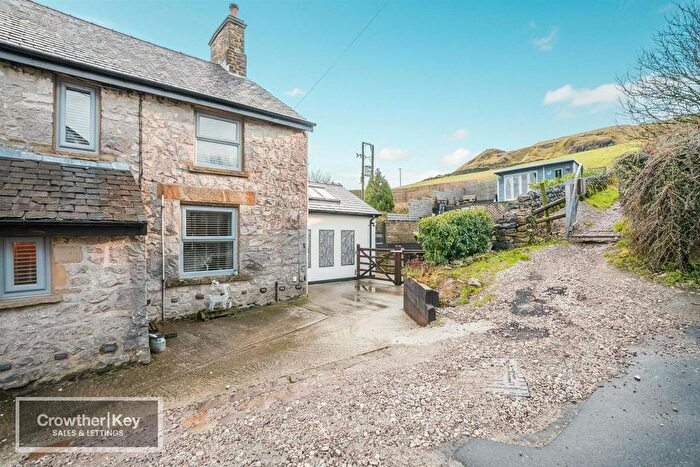
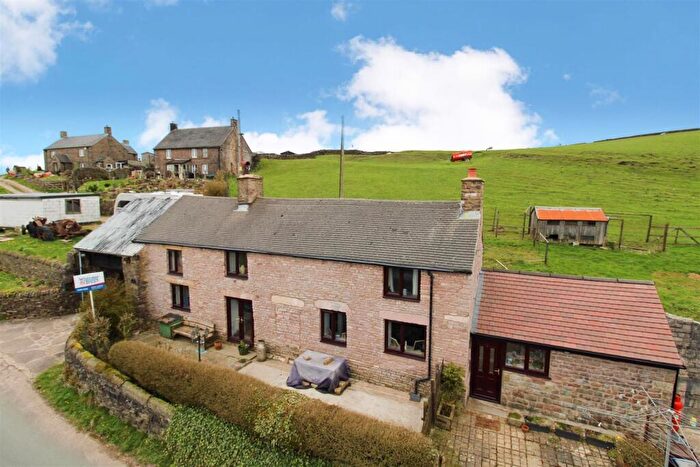
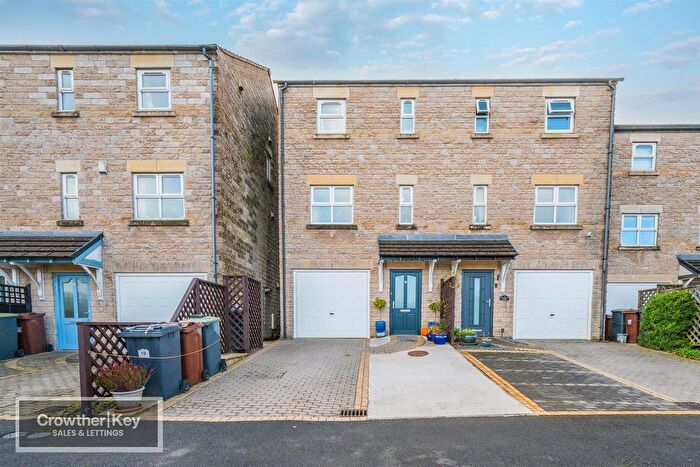
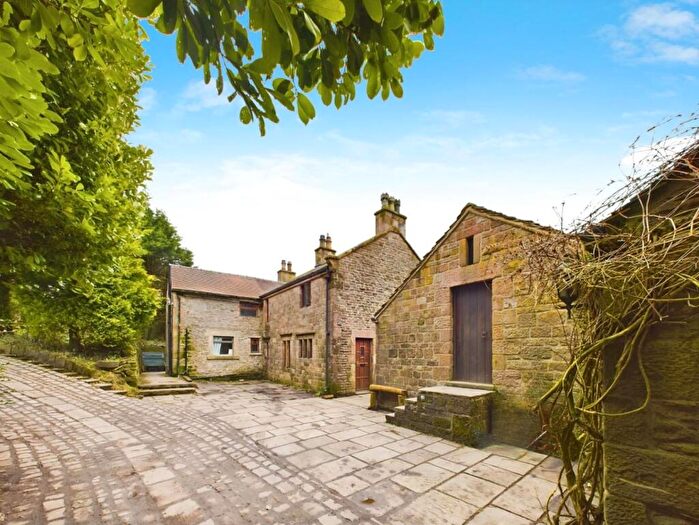
Houses for sale & to rent in Dane, Buxton
House Prices in Dane
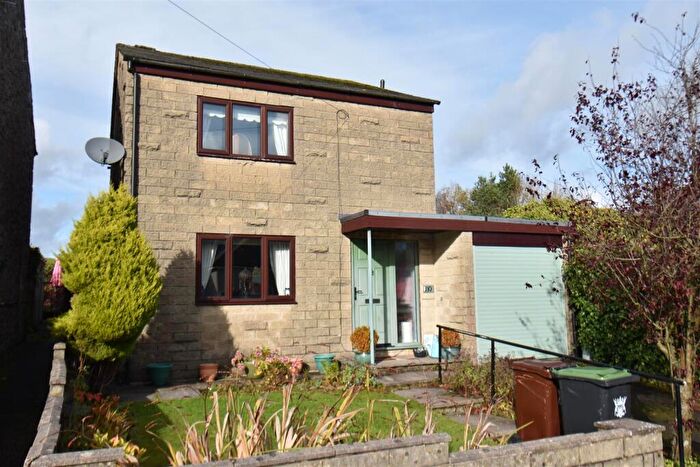
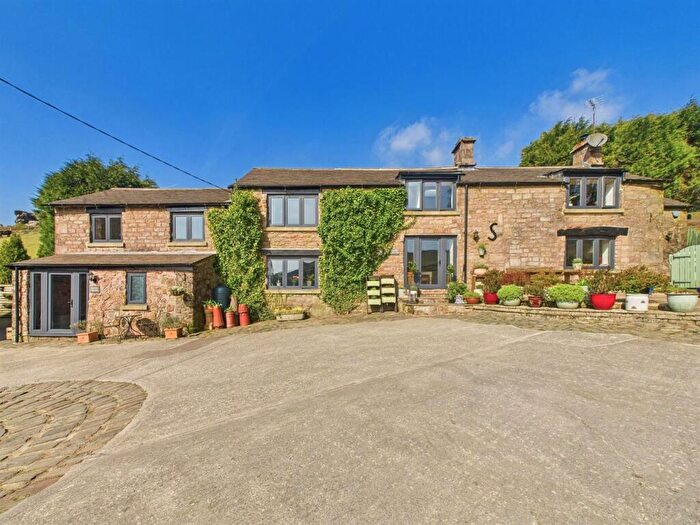
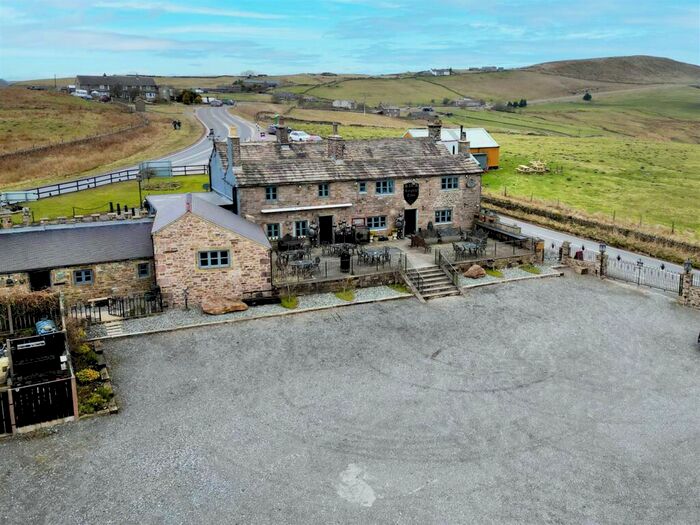
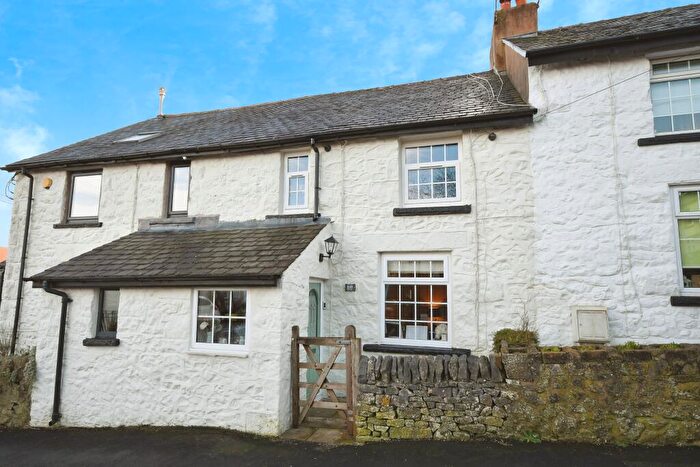
Properties in Dane have an average house price of £439,750.00 and had 10 Property Transactions within the last 3 years¹.
Dane is an area in Buxton, Staffordshire with 188 households², where the most expensive property was sold for £725,000.00.
Properties for sale in Dane
Previously listed properties in Dane
Roads and Postcodes in Dane
Navigate through our locations to find the location of your next house in Dane, Buxton for sale or to rent.
| Streets | Postcodes |
|---|---|
| Barrow Moor | SK17 0QP SK17 0QT |
| Hardingsbooth | SK17 0QW |
| Marnshaw Head | SK17 0QR |
| Marnshaw Lane | SK17 0BH |
| New Road | SK17 0TN |
| SK17 0QS SK17 0QY SK17 0RF SK17 0RG SK17 0RH SK17 0SJ SK17 0SL SK17 0SN SK17 0SR SK17 0SS SK17 0SU SK17 0SW SK17 0SX SK17 0SZ SK17 0TA SK17 0TF SK17 0TG SK17 0TH SK17 0TL SK17 0TQ SK17 0QN SK17 0QU SK17 0QX SK17 0RA SK17 0RB SK17 0RD SK17 0RE SK17 0RQ SK17 0SH SK17 0SP SK17 0SQ SK17 0ST SK17 0SY SK17 0TB SK17 0TD SK17 0TE SK17 0BJ SK17 0BL |
Transport near Dane
-
Buxton Station
-
Dove Holes Station
-
Chapel-En-Le-Frith Station
-
Macclesfield Station
-
Whaley Bridge Station
- FAQ
- Price Paid By Year
- Property Type Price
Frequently asked questions about Dane
What is the average price for a property for sale in Dane?
The average price for a property for sale in Dane is £439,750. This amount is 8% higher than the average price in Buxton. There are 115 property listings for sale in Dane.
Which train stations are available in or near Dane?
Some of the train stations available in or near Dane are Buxton, Dove Holes and Chapel-En-Le-Frith.
Property Price Paid in Dane by Year
The average sold property price by year was:
| Year | Average Sold Price | Price Change |
Sold Properties
|
|---|---|---|---|
| 2025 | £405,000 | -5% |
3 Properties |
| 2024 | £424,166 | -13% |
3 Properties |
| 2023 | £477,500 | 12% |
4 Properties |
| 2022 | £420,625 | 1% |
4 Properties |
| 2021 | £417,500 | 18% |
1 Property |
| 2020 | £342,283 | -22% |
3 Properties |
| 2019 | £417,833 | 16% |
6 Properties |
| 2018 | £350,500 | -67% |
4 Properties |
| 2017 | £585,000 | 60% |
1 Property |
| 2016 | £232,500 | -32% |
2 Properties |
| 2015 | £306,250 | 22% |
4 Properties |
| 2014 | £237,500 | -41% |
4 Properties |
| 2013 | £335,000 | 16% |
2 Properties |
| 2012 | £281,650 | 12% |
3 Properties |
| 2010 | £247,900 | -27% |
5 Properties |
| 2009 | £315,000 | 38% |
1 Property |
| 2008 | £195,000 | 11% |
1 Property |
| 2007 | £173,000 | -66% |
1 Property |
| 2006 | £287,235 | -36% |
3 Properties |
| 2005 | £390,000 | 3% |
1 Property |
| 2004 | £377,500 | 46% |
4 Properties |
| 2003 | £204,983 | 0,1% |
3 Properties |
| 2002 | £204,857 | -5% |
7 Properties |
| 2001 | £215,000 | 42% |
1 Property |
| 1999 | £125,750 | 46% |
4 Properties |
| 1998 | £67,500 | -41% |
2 Properties |
| 1997 | £94,875 | 3% |
4 Properties |
| 1996 | £91,850 | 42% |
1 Property |
| 1995 | £53,666 | - |
3 Properties |
Property Price per Property Type in Dane
Here you can find historic sold price data in order to help with your property search.
The average Property Paid Price for specific property types in the last three years are:
| Property Type | Average Sold Price | Sold Properties |
|---|---|---|
| Detached House | £439,750.00 | 10 Detached Houses |

