
Houses for sale in Burbage, Buxton
House Prices in Burbage
Properties in Burbage have an average house price of £323k and had 128 Property Transactions within the last 3 years¹.
Burbage is an area in Buxton, Derbyshire with 1,050 households², where the most expensive property was sold for £975k.
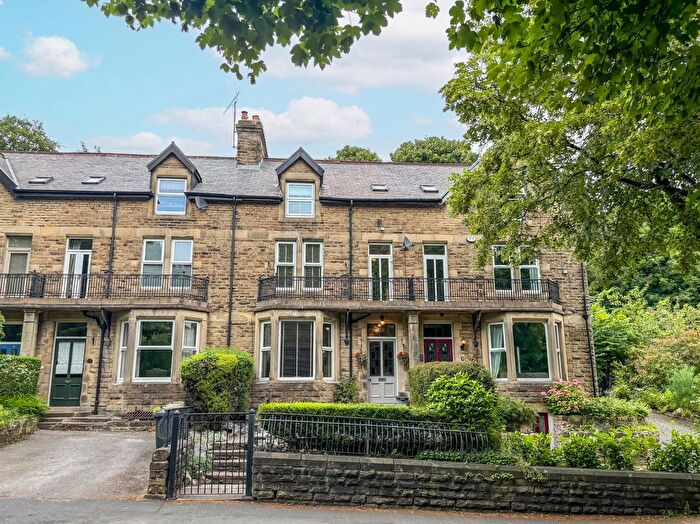
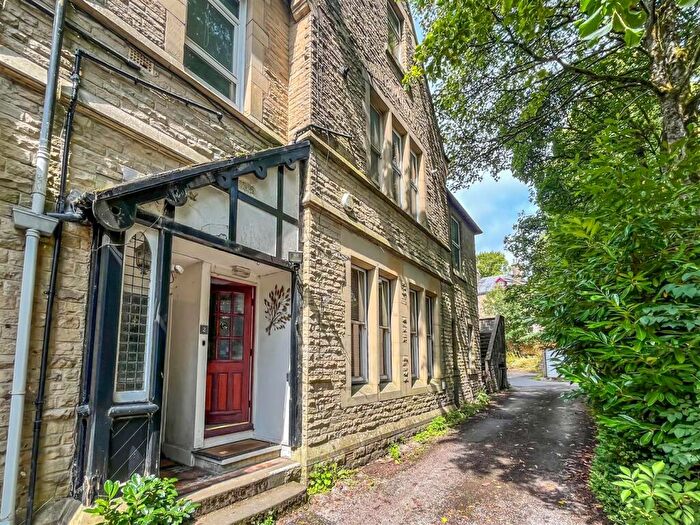
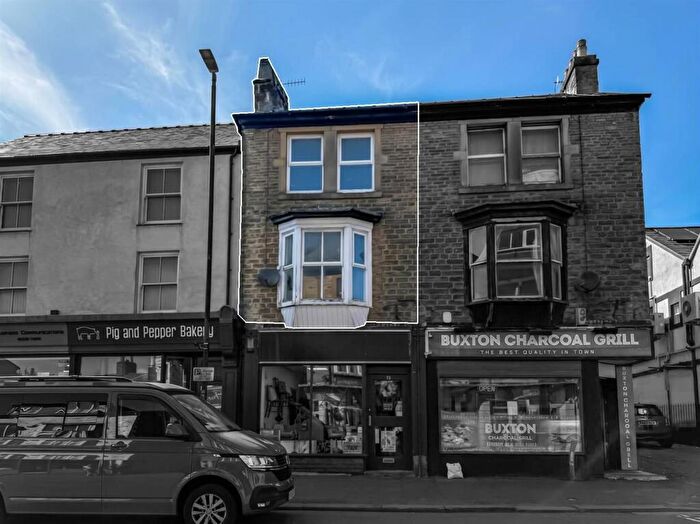
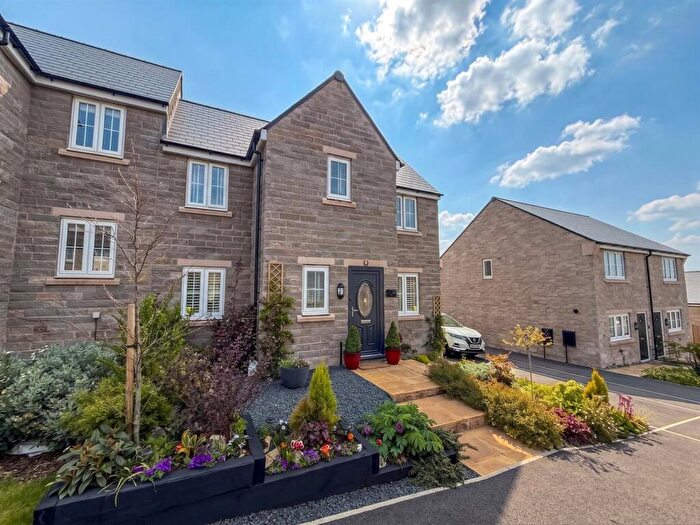
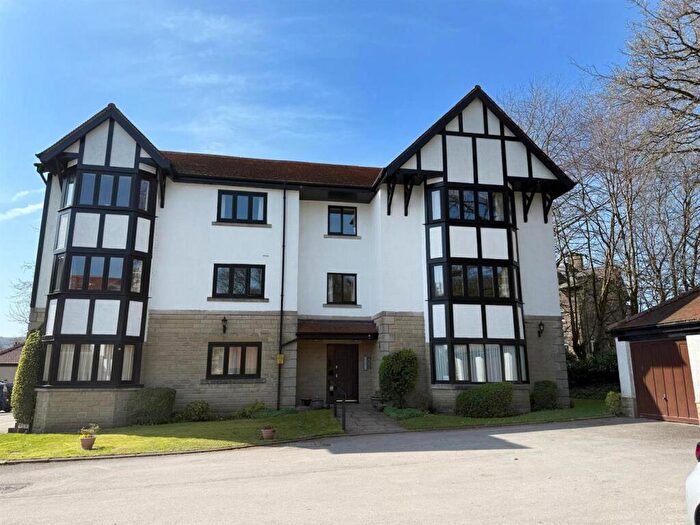
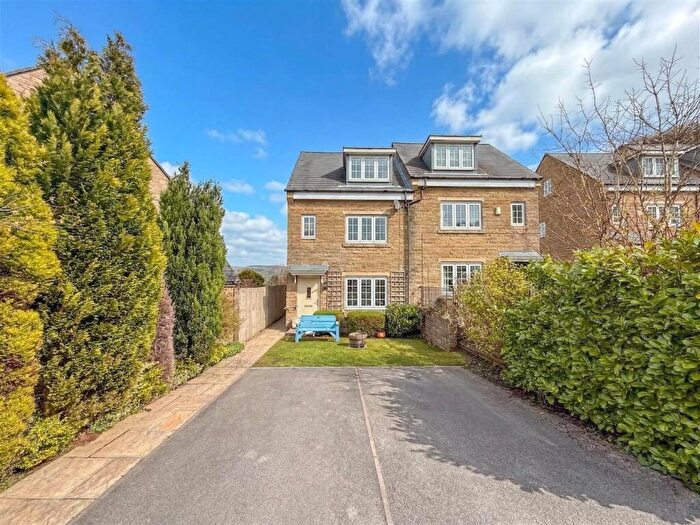
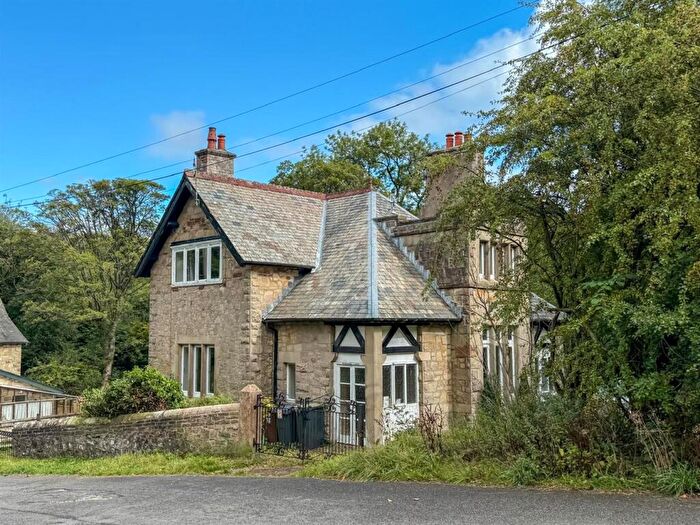
Properties for sale in Burbage
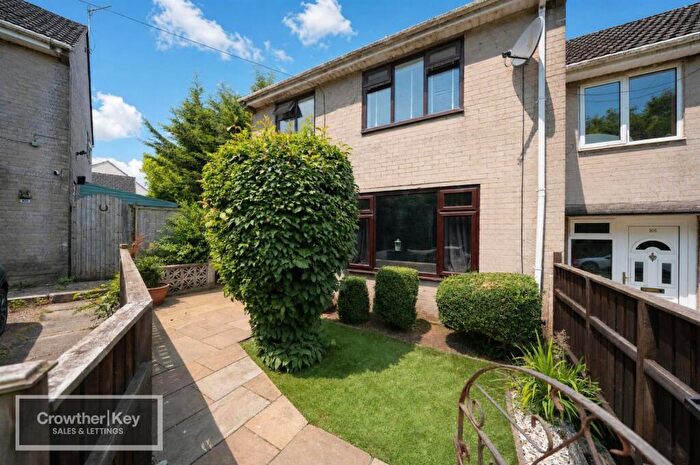
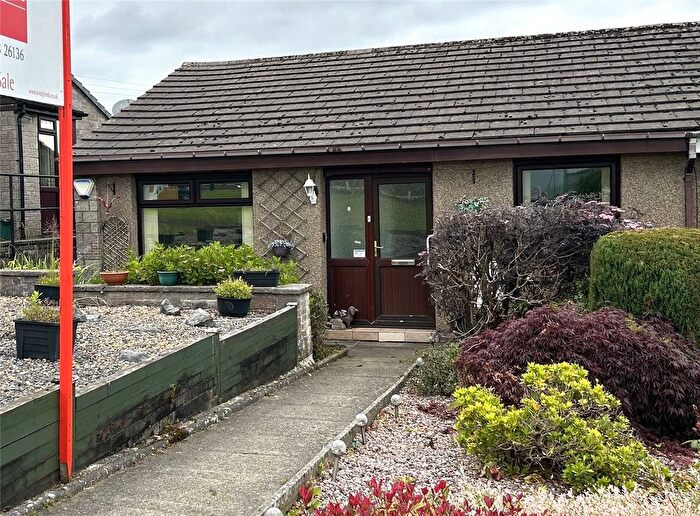
![]()
If you are looking to sell your house, let it out, or receive a property valuation, an expert can help you.
Click the button below to get started.

Roads and Postcodes in Burbage
Navigate through our locations to find the location of your next house in Burbage, Buxton for sale or to rent.
| Streets | Postcodes |
|---|---|
| Anncroft Road | SK17 6UA |
| Arbor Grove | SK17 9AF |
| Bishops Lane | SK17 6UN SK17 6UP SK17 6UW |
| Brandside | SK17 0RR SK17 0SD SK17 0SE SK17 0SF SK17 0SG |
| Brierlow Road | SK17 9SY SK17 9PT |
| Brookside Grove | SK17 6XS |
| Burbage Hall Mews | SK17 9GE |
| Burbage Heights | SK17 6YU |
| Burbage Way | SK17 9GB |
| Carr Road | SK17 6DS SK17 6WF |
| Cavendish Avenue | SK17 9AE |
| Duke Street | SK17 9AB |
| Green Lane | SK17 9DB SK17 9DE SK17 9DG |
| Harpur Hill | SK17 9JN SK17 9NL |
| Harpur Hill Business Park | SK17 9US |
| Harpur Hill Industrial Estate | SK17 9JL |
| Heath View | SK17 9PU |
| Heathfield Nook Road | SK17 9SA |
| Hill Top Cottages | SK17 0TJ |
| Holmfield | SK17 9DF |
| Kennett Grove | SK17 6XT |
| Leek Road | SK17 6UD SK17 6UE SK17 6UF SK17 6UQ |
| Level Lane | SK17 6TU |
| Macclesfield Old Road | SK17 6TS SK17 6TT SK17 6TX SK17 6TY SK17 6TZ SK17 6UB |
| Macclesfield Road | SK17 9AA SK17 9AD SK17 9AG |
| Manchester Road | SK17 6SX |
| Matcham Way | SK17 6WG |
| New Cottages | SK17 6UJ |
| Nursery Lane | SK17 6UL |
| Otterhole Close | SK17 6BL SK17 6DX |
| Paxton Place | SK17 6WE |
| Peak View | SK17 9QB |
| Riverside Court | SK17 6DT |
| Sandy Lane | SK17 6GJ |
| Springdale | SK17 6DW |
| St Johns Road | SK17 6TP SK17 6UR SK17 6UT SK17 6UU |
| Stable Lane | SK17 6UG |
| Sterndale Moor | SK17 9QA |
| Sunnyfields | SK17 9PX |
| Terret Grove | SK17 6XU |
| Turner Road | SK17 6WH |
| Wyatville Avenue | SK17 6WJ |
| Wyelands Close | SK17 6UX |
| SK17 0EL SK17 9QD SK17 9QF SK17 9FY SK17 0RP SK17 6UH SK17 9QE |
Property price trends in Burbage
According to the latest Land Registry data, the average home in Burbage sold for £411,666 in 2026. That figure comes from 1,473 sales logged over the past 31 years.
Prices have continued to climb over the last three years. Compared with 2023, when the typical sale came in around £313,103, that's a rise of roughly 31.5%.
Looking back five years, average prices are up about 44.4% since 2021, a gain of around £126,638 in cash terms.
Zoom out to the past decade for the fuller picture. Back in 2016, homes here averaged £255,200, so the typical sold price has climbed about 61.3% since then, roughly 4.9% a year. Stretch the view to fifteen years and that annual pace eases back to about 3.8%.
Frequently asked questions about Burbage
What is the average price for a property for sale in Burbage?
The average price for a property for sale in Burbage is £323,188. This amount is 14% higher than the average price in Buxton. There are 2,848 property listings for sale in Burbage.
What streets have the most expensive properties for sale in Burbage?
The streets with the most expensive properties for sale in Burbage are Bishops Lane at an average of £975,000, Brandside at an average of £628,333 and Burbage Way at an average of £595,000.
What streets have the most affordable properties for sale in Burbage?
The streets with the most affordable properties for sale in Burbage are Heathfield Nook Road at an average of £187,500, Matcham Way at an average of £194,375 and Sterndale Moor at an average of £207,666.
Which train stations are available in or near Burbage?
Some of the train stations available in or near Burbage are Buxton, Dove Holes and Chapel-En-Le-Frith.
Property Price Paid in Burbage by Year
The average sold property price by year was:
| Year | Average Sold Price | Price Change |
Sold Properties
|
|---|---|---|---|
| 2026 | £411,666 | 23% |
3 Properties |
| 2025 | £317,224 | -4% |
31 Properties |
| 2024 | £329,471 | 5% |
53 Properties |
| 2023 | £313,103 | -4% |
41 Properties |
| 2022 | £326,007 | 13% |
49 Properties |
| 2021 | £285,028 | 8% |
59 Properties |
| 2020 | £262,375 | 4% |
41 Properties |
| 2019 | £250,616 | -6% |
51 Properties |
| 2018 | £266,544 | 4% |
51 Properties |
| 2017 | £256,130 | 0,4% |
42 Properties |
Property Price per Property Type in Burbage
Here you can find historic sold price data in order to help with your property search.
The average Property Paid Price for specific property types in the last three years are:
| Property Type | Average Sold Price | Sold Properties |
|---|---|---|
| Semi Detached House | £307,307.00 | 51 Semi Detached Houses |
| Detached House | £479,548.00 | 31 Detached Houses |
| Terraced House | £249,796.00 | 32 Terraced Houses |
| Flat | £202,571.00 | 14 Flats |
