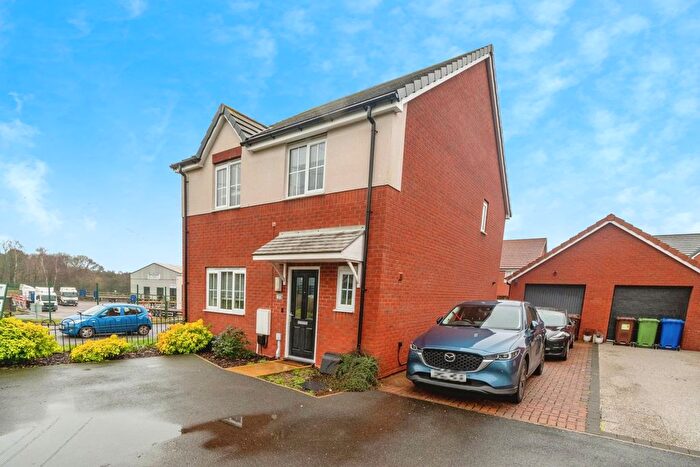
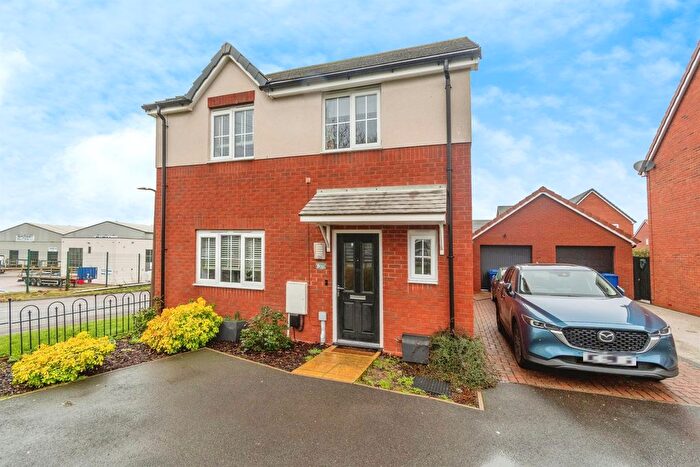
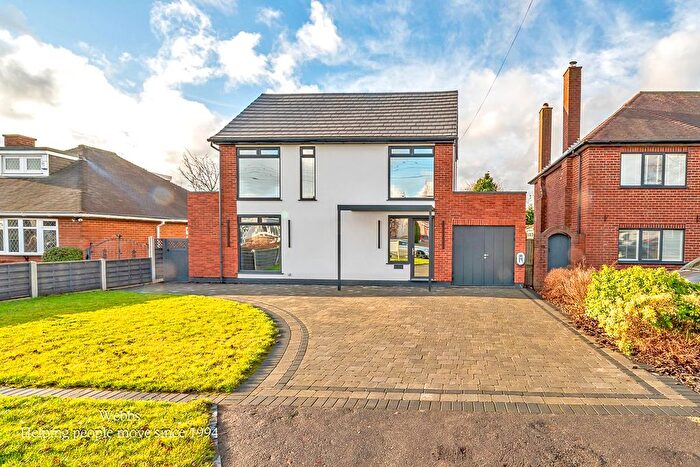
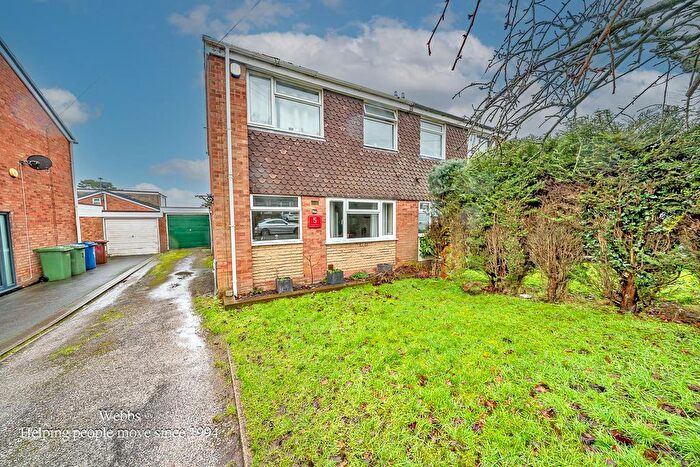
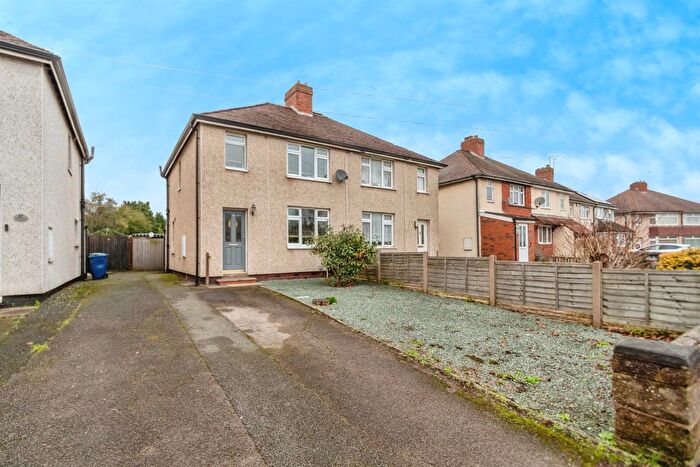
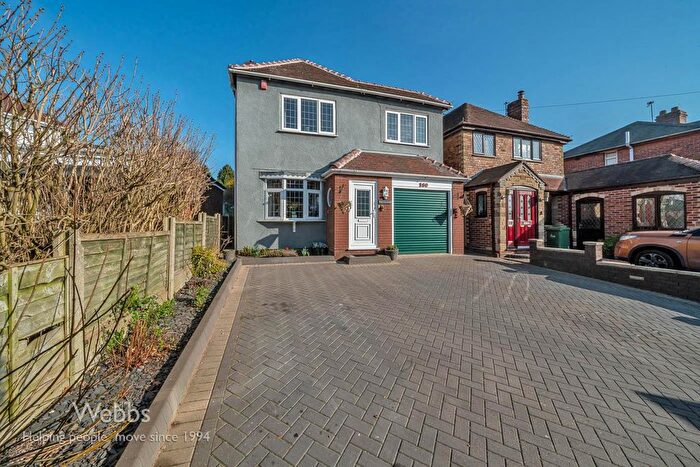
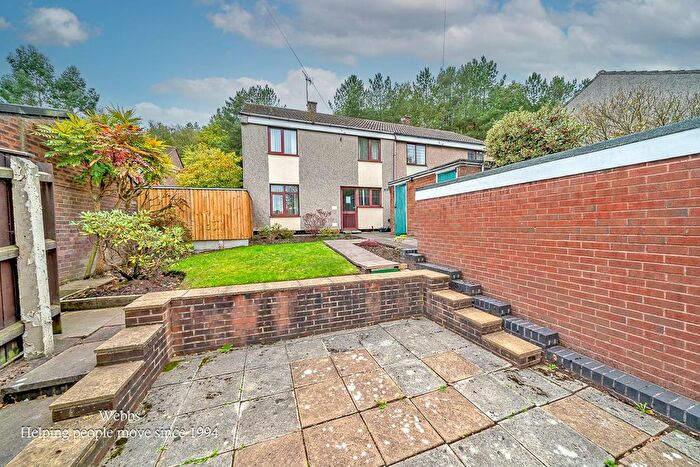
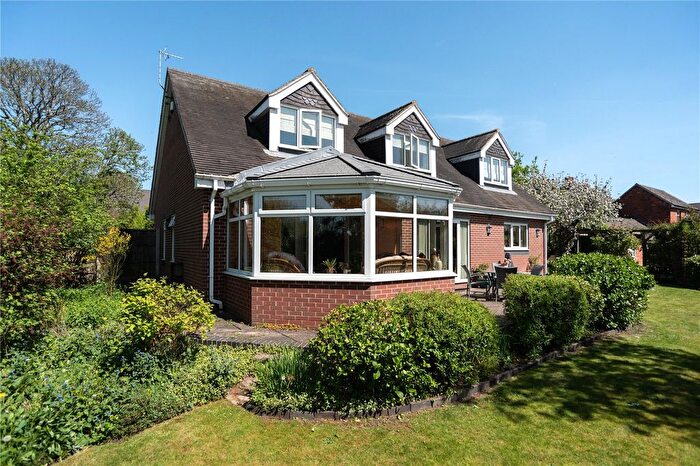
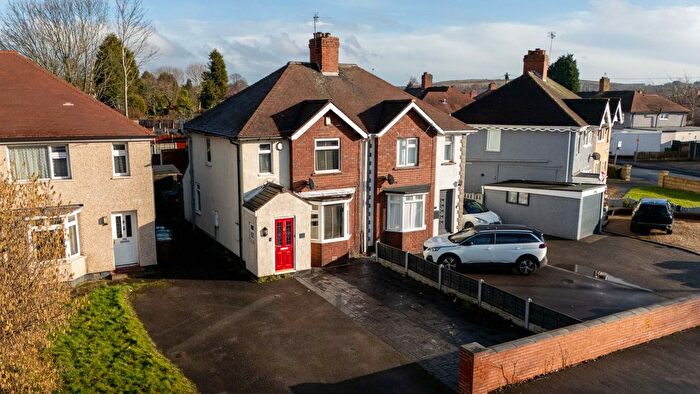
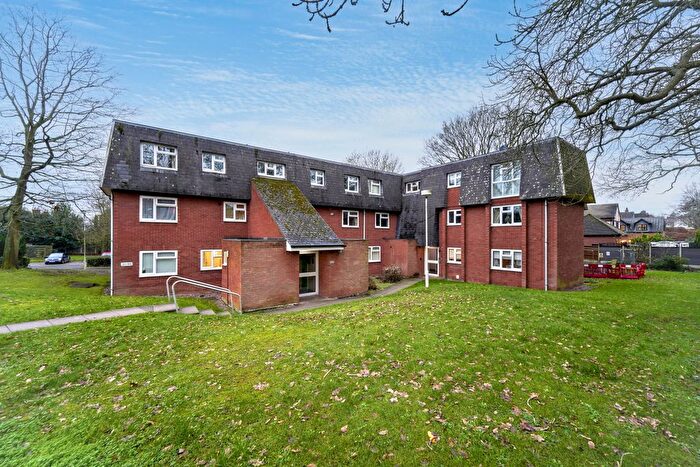
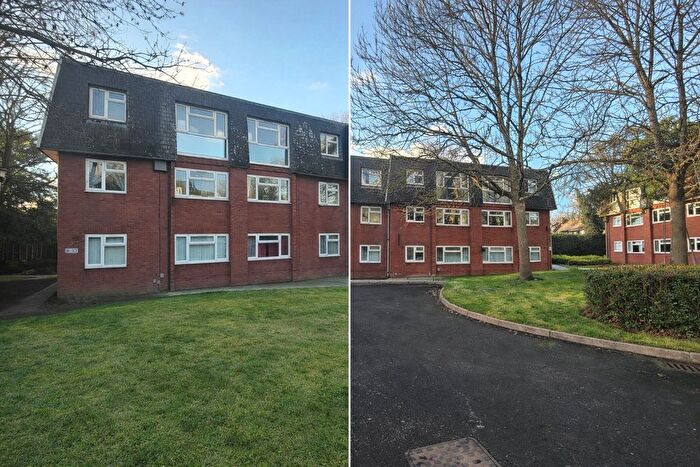
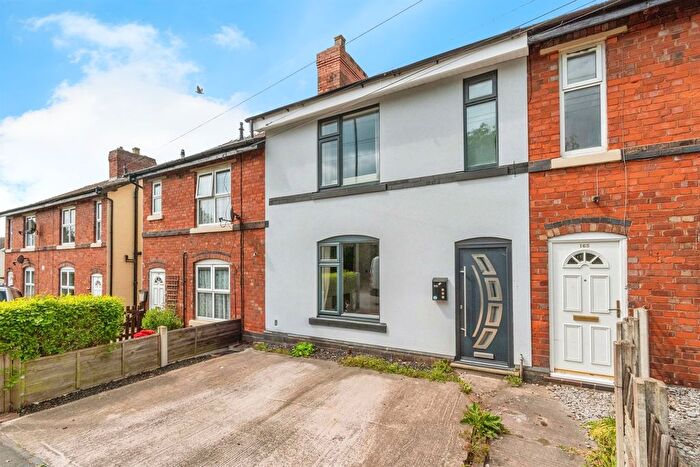
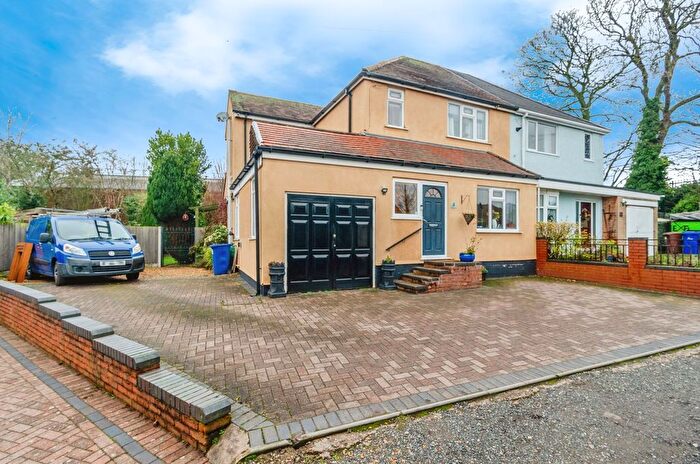
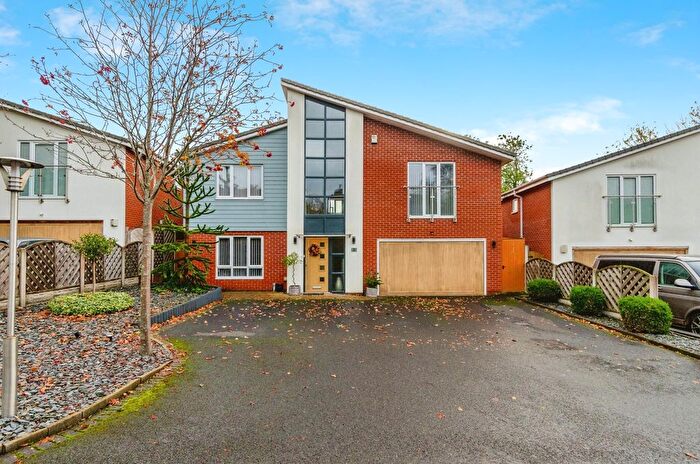
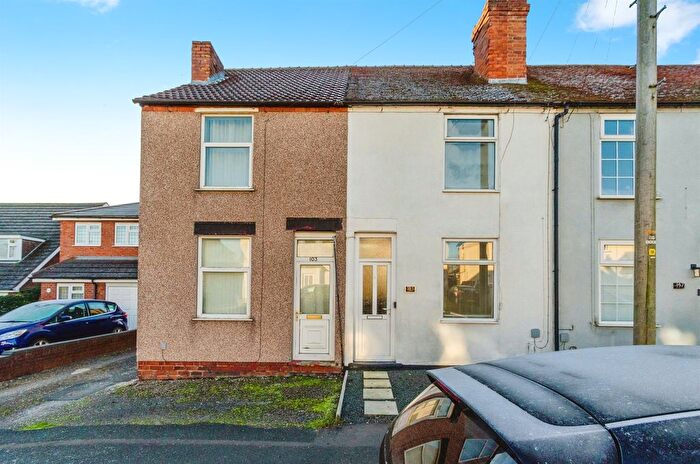
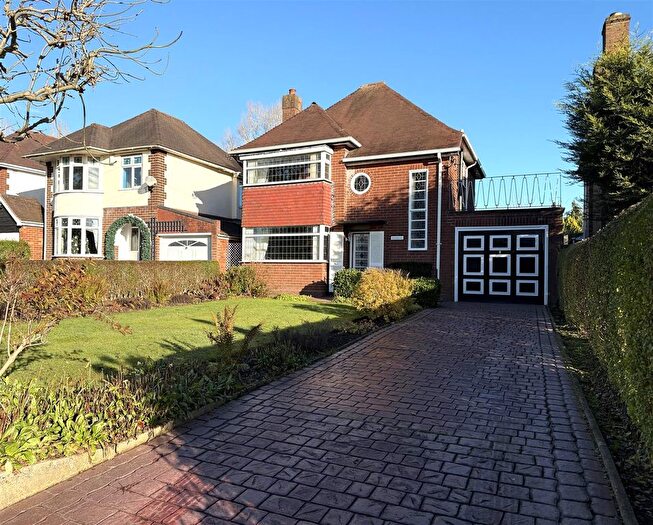
Houses for sale & to rent in Cannock West, Cannock
House Prices in Cannock West
Properties in Cannock West have an average house price of £316,463.00 and had 253 Property Transactions within the last 3 years¹.
Cannock West is an area in Cannock, Staffordshire with 3,046 households², where the most expensive property was sold for £985,000.00.
Properties for sale in Cannock West
Previously listed properties in Cannock West
Roads and Postcodes in Cannock West
Navigate through our locations to find the location of your next house in Cannock West, Cannock for sale or to rent.
| Streets | Postcodes |
|---|---|
| Adamson Close | WS11 1TJ |
| Allport Road | WS11 1DY |
| Allport Street | WS11 1JZ |
| Alton Grove | WS11 1NW |
| Baltic Close | WS11 5SD |
| Barnswood Close | WS11 1QQ |
| Beech Tree Lane | WS11 1AY WS11 1AZ WS11 1AQ |
| Beecroft Court | WS11 1JW WS11 1LA WS11 1BQ WS11 1FB |
| Beecroft Road | WS11 1BG WS11 1JP WS11 1JR WS11 1JU WS11 1LE WS12 9SA WS12 9SB WS12 9SD WS12 9SE WS12 9SF WS12 9SG WS12 9SH WS12 9SJ WS12 9SL WS12 9SN WS12 9SP WS12 9SQ WS12 9SR WS12 9SS WS12 9ST WS12 9SU WS12 9ZZ |
| Belmont Avenue | WS11 1JQ |
| Bideford Way | WS11 1QA WS11 1QD WS11 1NP WS11 1QB |
| Birch Avenue | WS11 1ER |
| Bishop Close | WS11 4AJ |
| Boyden Close | WS11 1TH |
| Brunswick Road | WS11 5SF WS11 5XY |
| Burnham Green | WS11 1QH |
| Calving Hill | WS11 1JS |
| Cannock Road | WS11 5BU |
| Cardinal Way | WS11 4AW |
| Chaseley Avenue | WS11 1JG |
| Chaseley Croft | WS11 1HU |
| Chenet Way | WS11 5RR |
| Church Street | WS11 1DS WS11 1DQ |
| Coniston Way | WS11 1DT |
| Dartmouth Avenue | WS11 1EJ WS11 1EQ |
| Dartmouth Mews | WS11 1NX |
| Dartmouth Road | WS11 1HD WS11 1HF |
| Dorchester Road | WS11 1QF |
| Downes Way | WS11 1JF |
| Dursley Drive | WS11 1TN |
| Elms Drive | WS11 1ES |
| Exeter Road | WS11 1QE |
| Falcon Close | WS11 1JE |
| Ferndell Close | WS11 1HR |
| Field Street | WS11 5QP |
| Foxes Rake | WS11 5UD |
| Georgian Place | WS11 5SQ |
| Gorsey Lane | WS11 1EX WS11 1EY |
| Gowland Drive | WS11 1TG |
| Grainger Court | WS11 5SA WS11 5UE |
| Greenfields | WS11 1JY |
| Gresham Road | WS11 5BT |
| Hamelin Street | WS11 5SE |
| Hanover Place | WS11 5SG |
| Hatherton Croft | WS11 1LD |
| Hatherton Hollow | WS11 1GU |
| Hatherton Road | WS11 1HG WS11 1HH WS11 1HL WS11 1HQ |
| Hatton Road | WS11 1NN |
| Hazelwood Grove | WS11 1ED |
| Heathfield Croft | WS11 1RG |
| Hednesford Road | WS11 6BP WS11 6BS WS11 6UW WS11 1JT |
| High Green | WS11 1BE WS11 1BH WS11 1BJ WS11 1BN |
| Holder Drive | WS11 1TL |
| Ivy Close | WS11 1UZ |
| Keeling Drive | WS11 1TQ |
| Kilmorie Road | WS11 1HZ |
| Lloyd Street | WS11 1HE |
| Longford Road | WS11 1NE WS11 1NF WS11 1NG WS11 1RJ |
| Lysander Way | WS11 5SH |
| Manor Avenue | WS11 1AA |
| Maple Crescent | WS11 1EW |
| Market Place | WS11 1BP |
| Meriden Close | WS11 1QG |
| Merlin Close | WS11 1JB |
| New Penkridge Road | WS11 1GW WS11 1HA WS11 1HN WS11 1HW WS11 1HB |
| Newhall Gardens Road | WS11 5EA |
| Newhall Street | WS11 1AB WS11 1AD |
| Nirvana Close | WS11 1HT |
| Oak Woods | WS11 1UY |
| Oaks Drive | WS11 1ET WS11 1EU |
| Old Fallow Road | WS11 5QL WS11 5QW |
| Old Penkridge Mews | WS11 1GA |
| Old Penkridge Road | WS11 1HX WS11 1HY |
| Orchard Avenue | WS11 1JD |
| Park Road | WS11 1JN WS11 1NZ |
| Pasture Gate | WS11 1JL |
| Pennine Drive | WS11 1JX |
| Phoenix Court | WS11 5DE |
| Poplar Lane | WS11 1NQ |
| Pye Green Road | WS11 5RY WS11 5RZ |
| Queen Street | WS11 1AE |
| Queens Square | WS11 1EA |
| Rokholt Crescent | WS11 1HS |
| Rowan Road | WS11 1JJ |
| Sandy Lane | WS11 1RD WS11 1RF WS11 1RN |
| Sherbrook Road | WS11 1HJ |
| Shirewood | WS11 1RA |
| Shoal Hill Close | WS11 1TW |
| Short Street | WS11 5QR |
| South Close | WS11 1EH |
| Southbourne Place | WS11 4SA |
| St James Road | WS11 1EL WS11 1EN |
| St Lukes Close | WS11 1BB |
| Stafford Road | WS11 4AF WS11 4AG WS11 4AH WS11 4AL WS11 1BF WS11 4AQ |
| Sunfield Road | WS11 1NJ |
| The Crescent | WS11 4AD |
| The Glade | WS11 1JH |
| The Green | WS11 1UE |
| The Willows | WS11 1EP |
| Thirlmere Close | WS11 1EF |
| Ullswater Place | WS11 1DX |
| Victoria Street | WS11 1AG |
| Wallace Court | WS11 5RX |
| Waveney Grove | WS11 1NL |
| Weaving Gardens | WS11 1DL |
| Wellington Drive | WS11 1PX |
| Windermere Place | WS11 1DU |
| WS11 0AX WS11 0WT WS11 0ZS WS11 1LR WS11 1XA WS11 8LL WS11 8ZJ WS11 9WL WS12 2ZG WS12 4GS WS12 9BH WS12 9BN WS12 9EA WS12 9EB WS12 9ES WS12 9FL WS12 9FU WS12 9FZ WS12 9GY WS12 9GZ WS12 9HA WS12 9HB WS12 9HF WS12 9HL WS12 9HP WS12 9HQ WS12 9HR WS12 9HS WS12 9GT WS12 9HU WS12 9HW WS12 9JB WS12 9JE WS12 9JG WS12 9JL WS12 9JN WS12 9JP |
Transport near Cannock West
- FAQ
- Price Paid By Year
- Property Type Price
Frequently asked questions about Cannock West
What is the average price for a property for sale in Cannock West?
The average price for a property for sale in Cannock West is £316,463. This amount is 36% higher than the average price in Cannock. There are 413 property listings for sale in Cannock West.
What streets have the most expensive properties for sale in Cannock West?
The streets with the most expensive properties for sale in Cannock West are Shirewood at an average of £912,500, Ferndell Close at an average of £599,950 and Holder Drive at an average of £548,600.
What streets have the most affordable properties for sale in Cannock West?
The streets with the most affordable properties for sale in Cannock West are Weaving Gardens at an average of £73,000, Old Penkridge Mews at an average of £101,475 and Park Road at an average of £176,250.
Which train stations are available in or near Cannock West?
Some of the train stations available in or near Cannock West are Cannock, Hednesford and Landywood.
Property Price Paid in Cannock West by Year
The average sold property price by year was:
| Year | Average Sold Price | Price Change |
Sold Properties
|
|---|---|---|---|
| 2025 | £345,485 | 8% |
69 Properties |
| 2024 | £319,463 | 9% |
98 Properties |
| 2023 | £289,758 | -2% |
86 Properties |
| 2022 | £295,982 | 12% |
104 Properties |
| 2021 | £261,061 | -5% |
132 Properties |
| 2020 | £273,188 | 17% |
106 Properties |
| 2019 | £227,643 | 6% |
118 Properties |
| 2018 | £215,099 | 7% |
104 Properties |
| 2017 | £200,339 | -8% |
113 Properties |
| 2016 | £217,182 | 6% |
114 Properties |
| 2015 | £204,672 | -6% |
144 Properties |
| 2014 | £217,260 | 12% |
132 Properties |
| 2013 | £190,376 | -6% |
80 Properties |
| 2012 | £201,294 | 6% |
61 Properties |
| 2011 | £189,789 | 12% |
78 Properties |
| 2010 | £167,389 | -6% |
67 Properties |
| 2009 | £177,976 | -9% |
63 Properties |
| 2008 | £194,792 | -6% |
81 Properties |
| 2007 | £205,915 | 6% |
139 Properties |
| 2006 | £193,143 | 1% |
138 Properties |
| 2005 | £191,566 | 18% |
104 Properties |
| 2004 | £157,522 | -3% |
101 Properties |
| 2003 | £162,128 | 28% |
103 Properties |
| 2002 | £116,523 | 14% |
162 Properties |
| 2001 | £99,836 | 19% |
118 Properties |
| 2000 | £81,089 | -2% |
107 Properties |
| 1999 | £83,060 | 13% |
122 Properties |
| 1998 | £72,455 | 5% |
133 Properties |
| 1997 | £68,743 | 1% |
123 Properties |
| 1996 | £68,157 | 5% |
120 Properties |
| 1995 | £64,601 | - |
77 Properties |
Property Price per Property Type in Cannock West
Here you can find historic sold price data in order to help with your property search.
The average Property Paid Price for specific property types in the last three years are:
| Property Type | Average Sold Price | Sold Properties |
|---|---|---|
| Flat | £147,400.00 | 20 Flats |
| Semi Detached House | £244,188.00 | 89 Semi Detached Houses |
| Detached House | £419,945.00 | 119 Detached Houses |
| Terraced House | £216,437.00 | 25 Terraced Houses |

