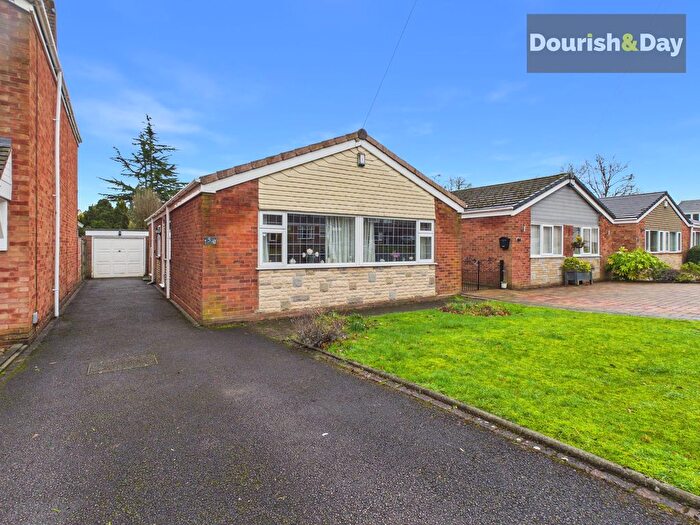
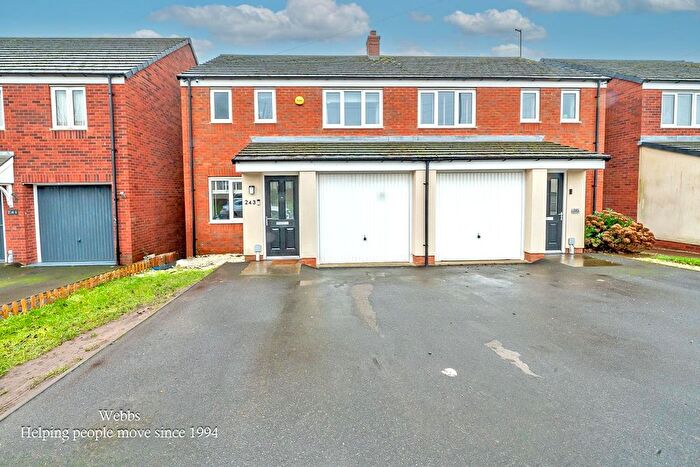
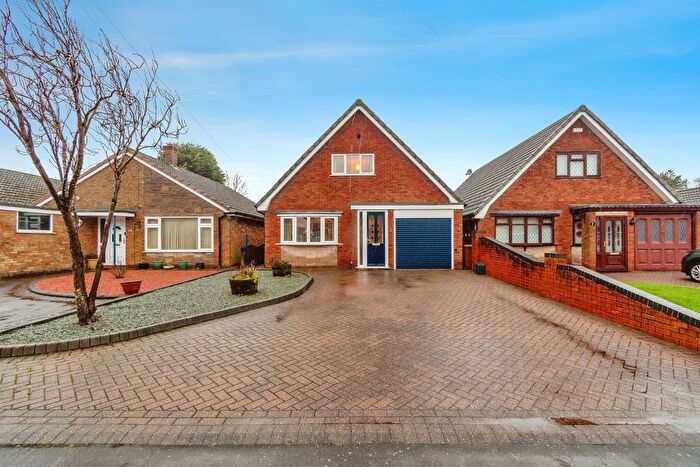
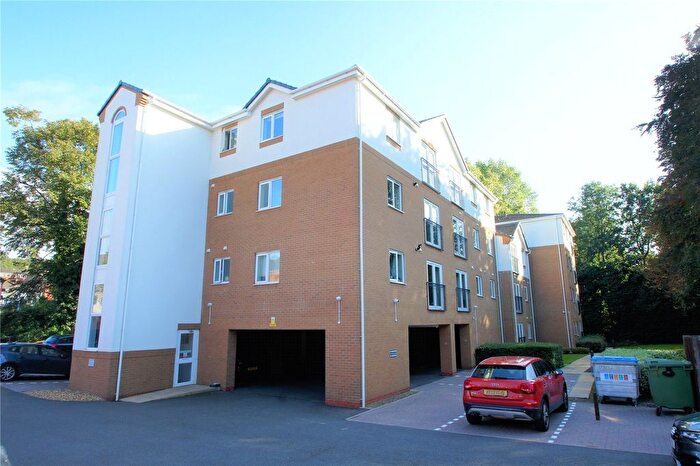
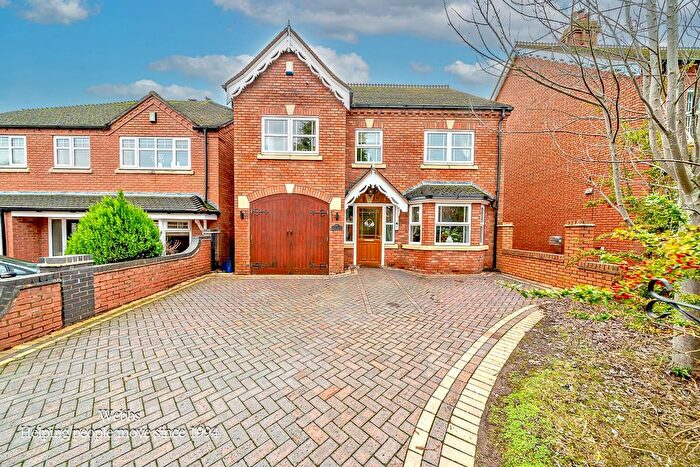
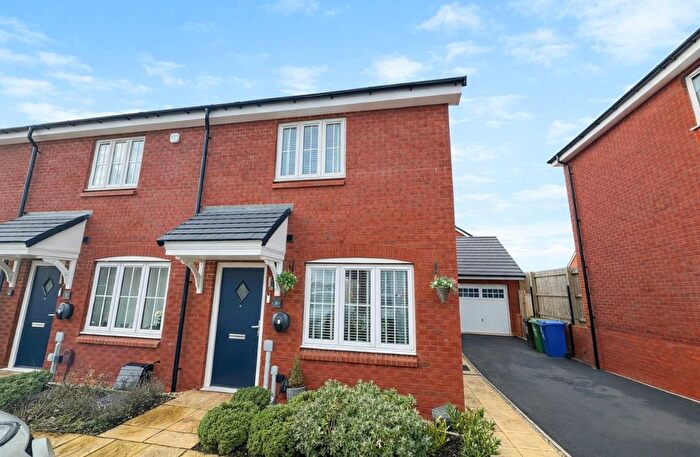
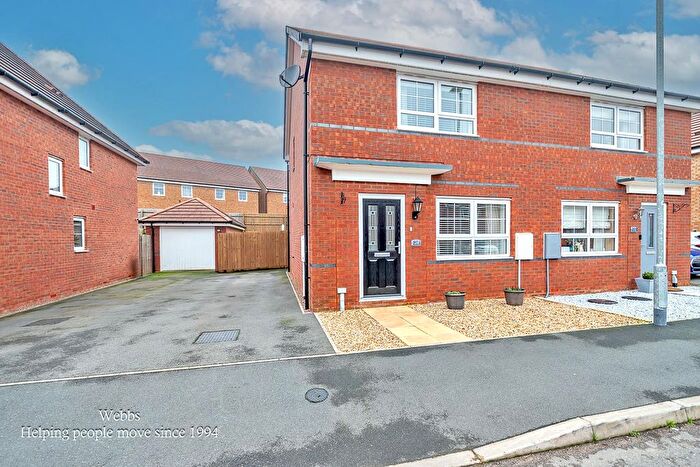
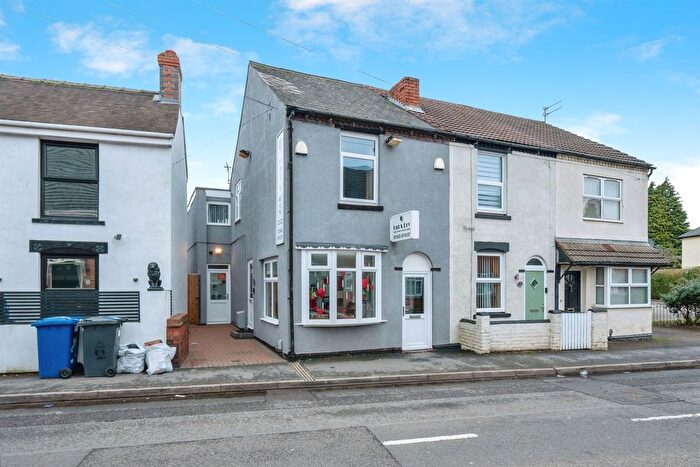
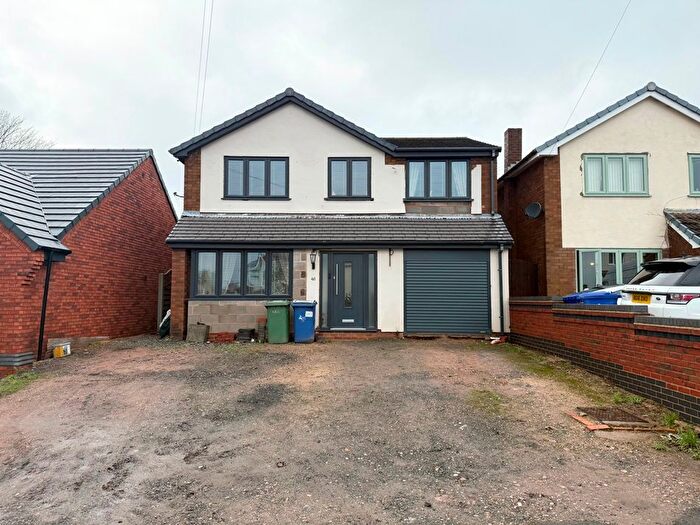
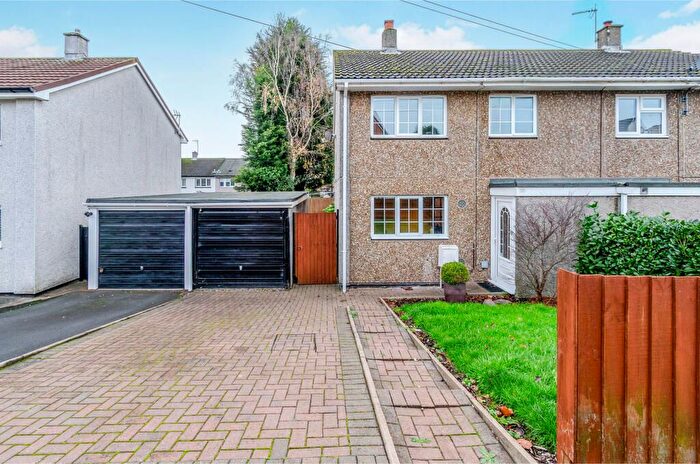
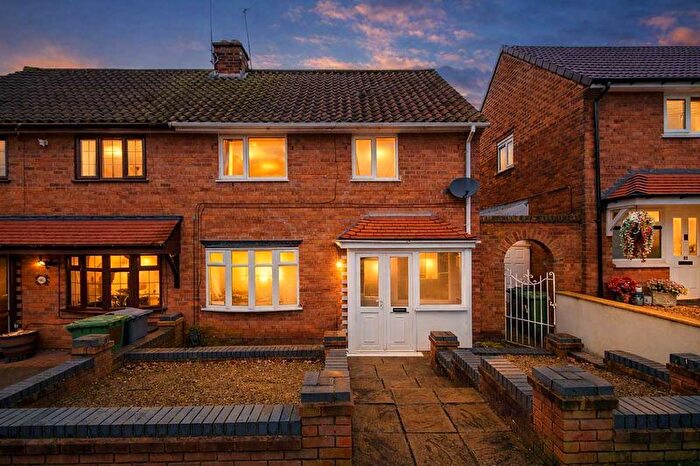
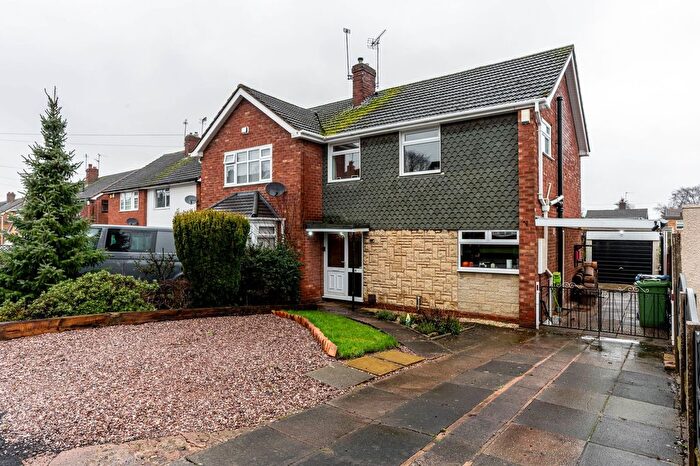
Houses for sale & to rent in Cannock, Staffordshire
House Prices in Cannock
Properties in Cannock have an average house price of £232,611.00 and had 3,006 Property Transactions within the last 3 years.¹
Cannock is an area in Staffordshire with 32,351 households², where the most expensive property was sold for £1,000,000.00.
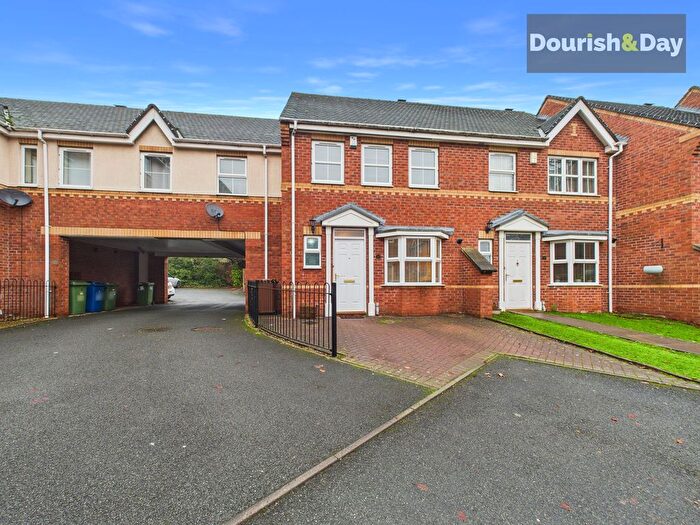
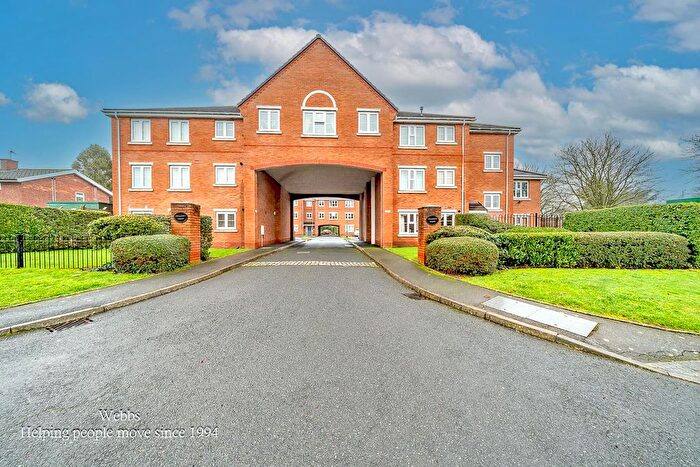
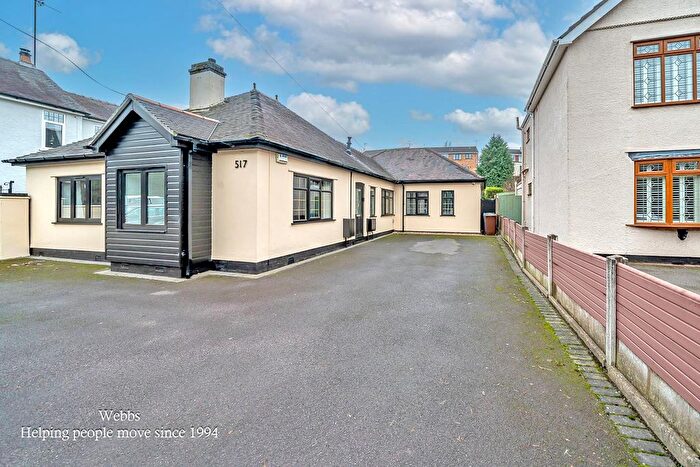
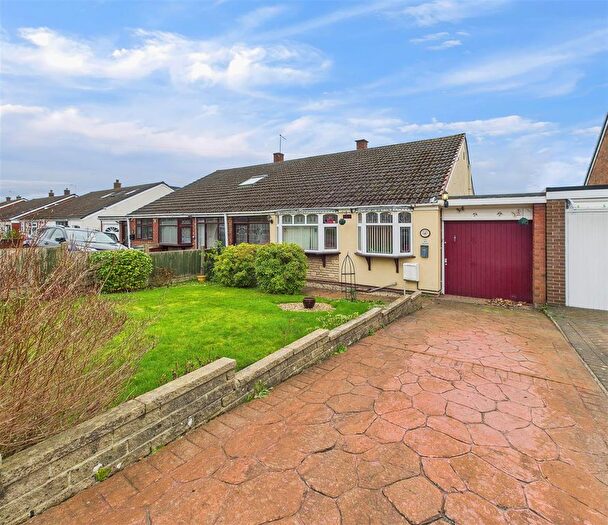
Properties for sale in Cannock
Neighbourhoods in Cannock
Navigate through our locations to find the location of your next house in Cannock, Staffordshire for sale or to rent.
- Cannock East
- Cannock North
- Cannock South
- Cannock West
- Cheslyn Hay North And Saredon
- Etching Hill And The Heath
- Great Wyrley Town
- Hawks Green
- Heath Hayes East And Wimblebury
- Hednesford Green Heath
- Hednesford North
- Hednesford South
- Huntington And Hatherton
- Milford
- Norton Canes
- Rawnsley
- Huntington & Hatherton
Transport in Cannock
Please see below transportation links in this area:
- FAQ
- Price Paid By Year
- Property Type Price
Frequently asked questions about Cannock
What is the average price for a property for sale in Cannock?
The average price for a property for sale in Cannock is £232,611. This amount is 11% lower than the average price in Staffordshire. There are 5,771 property listings for sale in Cannock.
What locations have the most expensive properties for sale in Cannock?
The locations with the most expensive properties for sale in Cannock are Cheslyn Hay North And Saredon at an average of £322,300, Cannock West at an average of £317,267 and Norton Canes at an average of £253,538.
What locations have the most affordable properties for sale in Cannock?
The locations with the most affordable properties for sale in Cannock are Cannock South at an average of £185,171, Cannock North at an average of £188,357 and Cannock East at an average of £197,396.
Which train stations are available in or near Cannock?
Some of the train stations available in or near Cannock are Cannock, Hednesford and Landywood.
Property Price Paid in Cannock by Year
The average sold property price by year was:
| Year | Average Sold Price | Price Change |
Sold Properties
|
|---|---|---|---|
| 2025 | £244,252 | 7% |
917 Properties |
| 2024 | £227,027 | -0,5% |
1,122 Properties |
| 2023 | £228,052 | 3% |
967 Properties |
| 2022 | £220,875 | 7% |
1,290 Properties |
| 2021 | £205,604 | 1% |
1,519 Properties |
| 2020 | £203,345 | 9% |
1,208 Properties |
| 2019 | £184,742 | 3% |
1,526 Properties |
| 2018 | £178,946 | 4% |
1,376 Properties |
| 2017 | £171,183 | 4% |
1,635 Properties |
| 2016 | £164,577 | 6% |
1,490 Properties |
| 2015 | £154,345 | 3% |
1,222 Properties |
| 2014 | £149,834 | 5% |
1,289 Properties |
| 2013 | £143,007 | 1% |
1,010 Properties |
| 2012 | £141,883 | 2% |
718 Properties |
| 2011 | £138,822 | 1% |
719 Properties |
| 2010 | £137,547 | 2% |
738 Properties |
| 2009 | £135,100 | -7% |
684 Properties |
| 2008 | £144,716 | -4% |
777 Properties |
| 2007 | £150,745 | 3% |
1,639 Properties |
| 2006 | £146,865 | 7% |
1,595 Properties |
| 2005 | £137,061 | 12% |
1,258 Properties |
| 2004 | £121,206 | 13% |
1,555 Properties |
| 2003 | £105,086 | 17% |
1,434 Properties |
| 2002 | £87,259 | 15% |
1,783 Properties |
| 2001 | £74,039 | 12% |
1,611 Properties |
| 2000 | £64,891 | 3% |
1,614 Properties |
| 1999 | £63,151 | 7% |
1,603 Properties |
| 1998 | £58,469 | 9% |
1,480 Properties |
| 1997 | £53,005 | 4% |
1,134 Properties |
| 1996 | £50,827 | 5% |
1,220 Properties |
| 1995 | £48,105 | - |
1,028 Properties |
Property Price per Property Type in Cannock
Here you can find historic sold price data in order to help with your property search.
The average Property Paid Price for specific property types in the last three years are:
| Property Type | Average Sold Price | Sold Properties |
|---|---|---|
| Semi Detached House | £208,428.00 | 1,397 Semi Detached Houses |
| Terraced House | £185,056.00 | 498 Terraced Houses |
| Detached House | £331,692.00 | 870 Detached Houses |
| Flat | £113,390.00 | 241 Flats |

