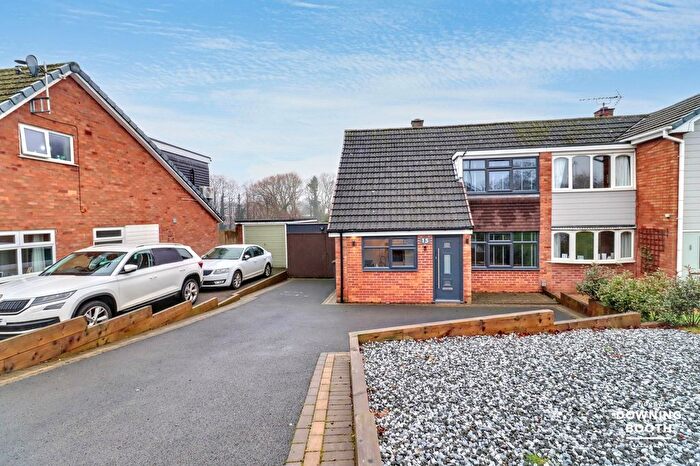
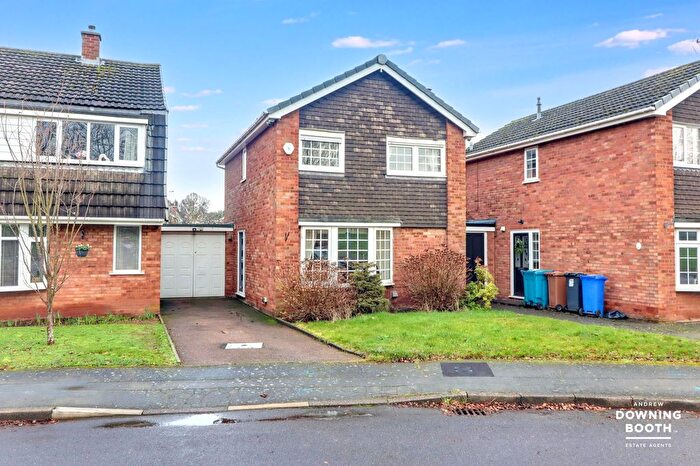
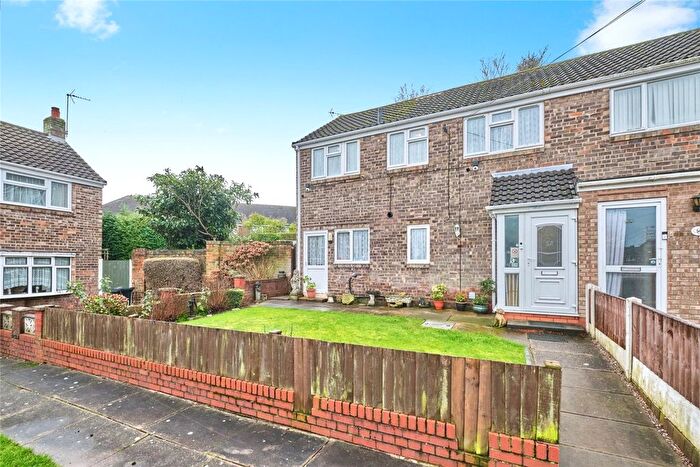
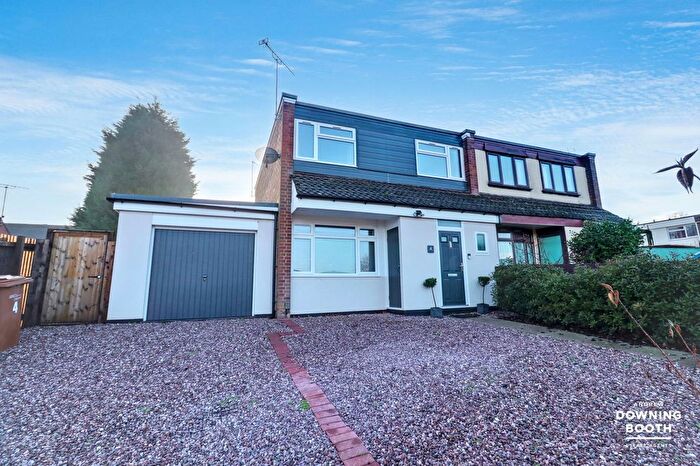
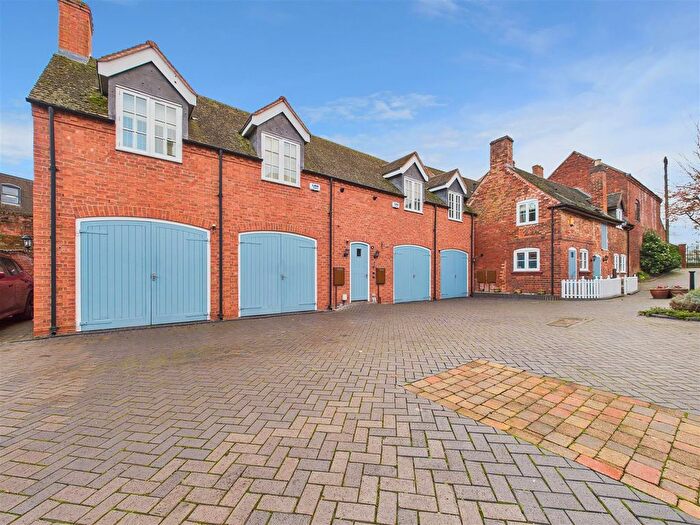
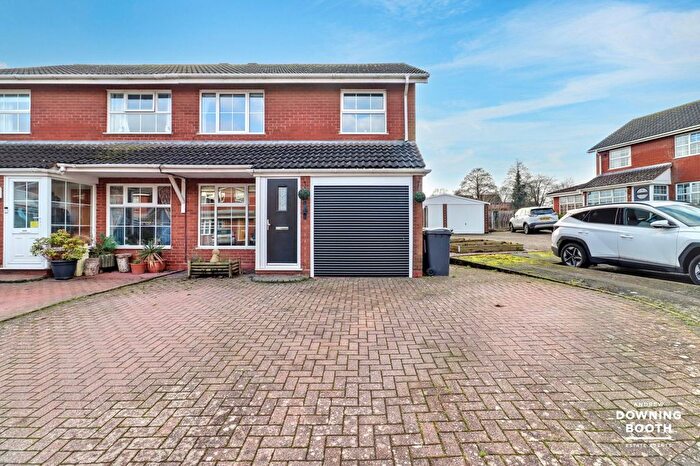
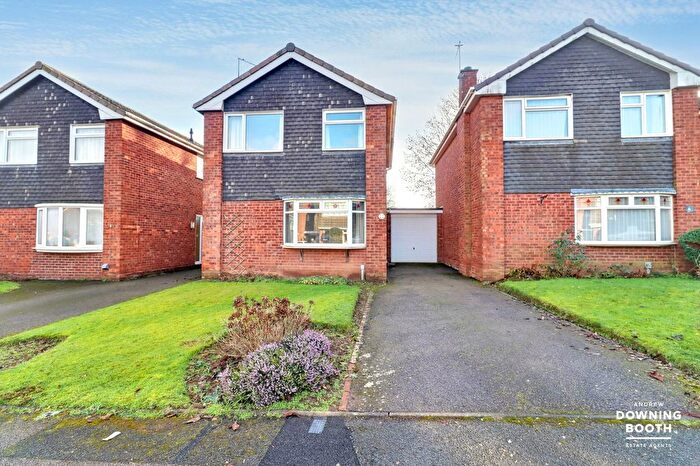
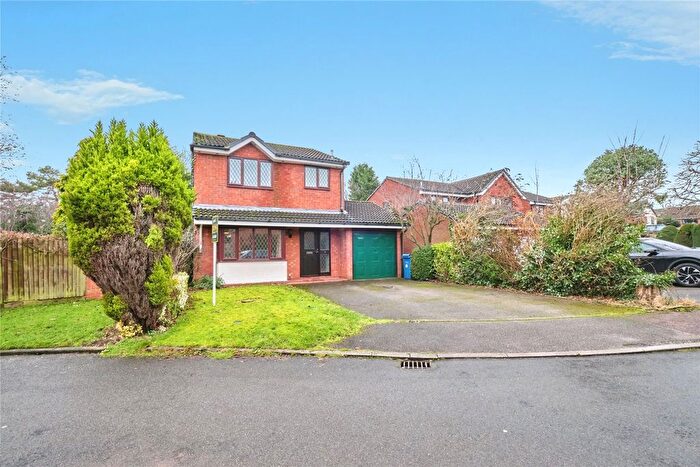
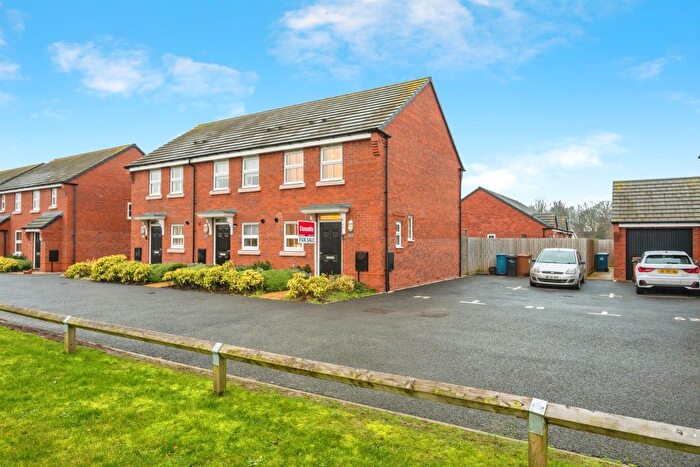
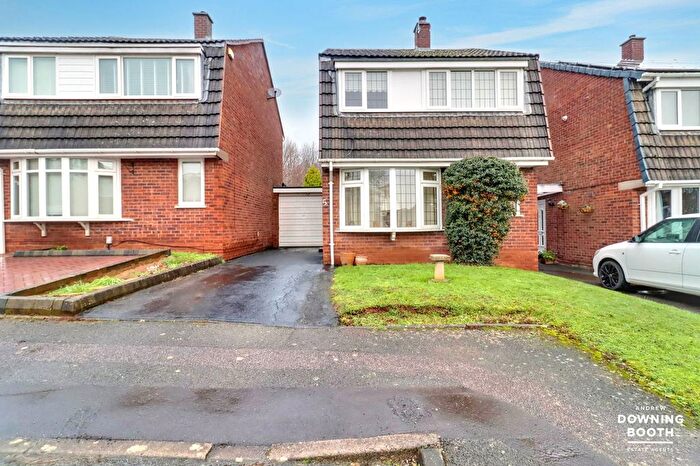
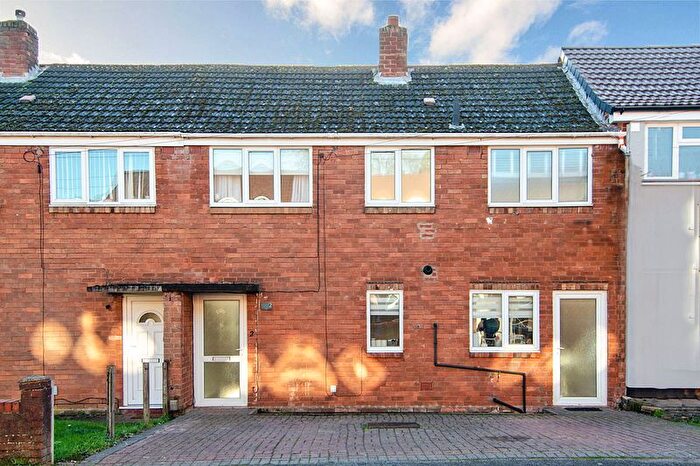
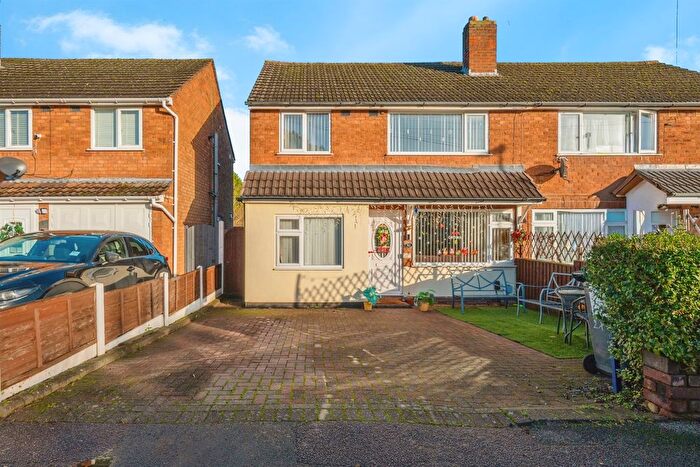
Houses for sale & to rent in Curborough, Lichfield
House Prices in Curborough
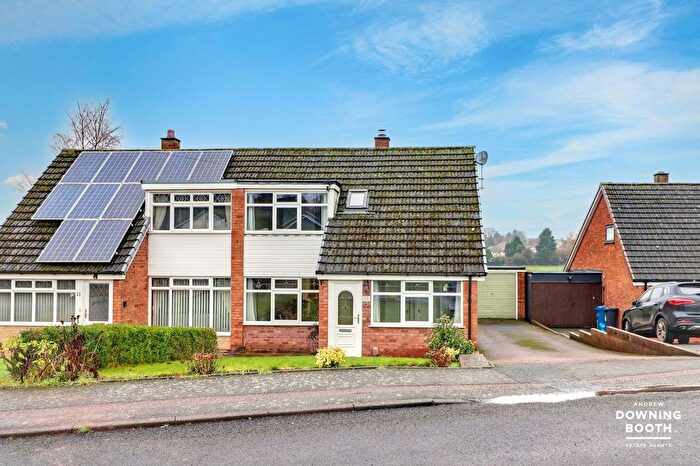
Properties in Curborough have an average house price of £305,015.00 and had 163 Property Transactions within the last 3 years¹.
Curborough is an area in Lichfield, Staffordshire with 2,083 households², where the most expensive property was sold for £1,200,000.00.
Properties for sale in Curborough
Previously listed properties in Curborough
Roads and Postcodes in Curborough
Navigate through our locations to find the location of your next house in Curborough, Lichfield for sale or to rent.
| Streets | Postcodes |
|---|---|
| Anglesey Road | WS13 7NU |
| Barn Close | WS13 7RP |
| Barratt Court | WS13 7SZ |
| Beecroft Avenue | WS13 7EZ |
| Bloomfield Crescent | WS13 7JL WS13 7JN WS13 7JR |
| Bulldog Lane | WS13 7LN |
| Cain Close | WS13 7TA |
| Curborough Road | WS13 7NG WS13 7NQ WS13 7NR WS13 7PN WS13 7PW WS13 7RB |
| Dimbles Hill | WS13 7NH |
| Dimbles Lane | WS13 7HL WS13 7JJ WS13 7HN WS13 7HT |
| Eastern Avenue | WS13 7SA WS13 7SG WS13 7SY |
| Elgar Close | WS13 7PL |
| Fallowfield | WS13 7RS |
| Field Road | WS13 7RU |
| Francis Road | WS13 7JX |
| Gaia Lane | WS13 7LR WS13 7LS |
| Gaiafields Road | WS13 7LT |
| Gaialands Crescent | WS13 7LU |
| Gaiastowe | WS13 7LY |
| Giles Road | WS13 7JU WS13 7JY |
| Gloucester Close | WS13 7SS |
| Handel Walk | WS13 7PQ |
| Harwood Road | WS13 7PP |
| Hawkins Close | WS13 7NZ |
| Hewitt Close | WS13 7JH |
| Jackson Road | WS13 7PR |
| Kilby Avenue | WS13 7TB |
| Leyfields | WS13 7NJ |
| Lincoln Close | WS13 7SW |
| Meadowbrook Road | WS13 7RL WS13 7RN WS13 7RW |
| Miller Close | WS13 7NF |
| Norwich Close | WS13 7SJ |
| Oakley Close | WS13 7PF |
| Paget Close | WS13 7PD |
| Ploughmans Walk | WS13 7RR |
| Pones Green | WS13 7NW |
| Ponesfield Road | WS13 7NL WS13 7NN |
| Purcell Avenue | WS13 7PG WS13 7PH WS13 7PJ |
| Reynolds Close | WS13 7NY |
| Ringway Industrial Estate | WS13 7SF |
| Salisbury Close | WS13 7SN |
| Samuel Close | WS13 7RZ |
| Shepherd Close | WS13 7RT |
| Simpson Road | WS13 7PS WS13 7PT |
| Southwark Close | WS13 7SH |
| St Annes Road | WS13 7RE |
| St Catherines Road | WS13 7RD |
| St Chads Road | WS13 7LZ WS13 7ND WS13 7NB |
| St Helens Road | WS13 7RG |
| St Margarets Road | WS13 7RA |
| St Marys Road | WS13 7RF |
| Stychbrook Gardens | WS13 7NP |
| The Charters | WS13 7LX |
| The Garth | WS13 7NS |
| The Parchments | WS13 7NA |
| The Windings | WS13 7EX |
| Thomas Lane | WS13 7TD |
| Truro Close | WS13 7SR |
| Vale Close | WS13 7LJ |
| Vallentin Way | WS13 7TE |
| Wassall Lane | WS13 7TG |
| Watchman Close | WS13 7TH |
| Watery Lane | WS13 7SE WS13 7TJ |
| Weston Road | WS13 7NT |
| Willow Tree Close | WS13 7NX |
| Winchester Close | WS13 7SL |
| Worcester Close | WS13 7SP |
Transport near Curborough
- FAQ
- Price Paid By Year
- Property Type Price
Frequently asked questions about Curborough
What is the average price for a property for sale in Curborough?
The average price for a property for sale in Curborough is £305,015. This amount is 16% lower than the average price in Lichfield. There are 638 property listings for sale in Curborough.
What streets have the most expensive properties for sale in Curborough?
The streets with the most expensive properties for sale in Curborough are Bulldog Lane at an average of £915,000, Gaialands Crescent at an average of £695,000 and Vale Close at an average of £560,000.
What streets have the most affordable properties for sale in Curborough?
The streets with the most affordable properties for sale in Curborough are Barratt Court at an average of £98,000, Willow Tree Close at an average of £143,900 and Purcell Avenue at an average of £181,611.
Which train stations are available in or near Curborough?
Some of the train stations available in or near Curborough are Lichfield City, Lichfield Trent Valley and Shenstone.
Property Price Paid in Curborough by Year
The average sold property price by year was:
| Year | Average Sold Price | Price Change |
Sold Properties
|
|---|---|---|---|
| 2025 | £317,311 | 8% |
53 Properties |
| 2024 | £291,354 | -6% |
61 Properties |
| 2023 | £308,724 | -6% |
49 Properties |
| 2022 | £327,768 | -4% |
78 Properties |
| 2021 | £339,840 | 23% |
73 Properties |
| 2020 | £260,929 | 20% |
45 Properties |
| 2019 | £209,142 | -17% |
57 Properties |
| 2018 | £245,690 | 14% |
85 Properties |
| 2017 | £212,341 | -5% |
70 Properties |
| 2016 | £222,515 | 5% |
57 Properties |
| 2015 | £212,279 | -2% |
48 Properties |
| 2014 | £216,747 | 11% |
63 Properties |
| 2013 | £193,913 | 6% |
43 Properties |
| 2012 | £182,898 | 2% |
32 Properties |
| 2011 | £179,698 | -12% |
37 Properties |
| 2010 | £200,899 | 14% |
30 Properties |
| 2009 | £173,088 | 15% |
38 Properties |
| 2008 | £146,581 | -17% |
27 Properties |
| 2007 | £170,769 | 1% |
74 Properties |
| 2006 | £169,680 | -7% |
84 Properties |
| 2005 | £181,315 | 15% |
43 Properties |
| 2004 | £153,549 | 21% |
57 Properties |
| 2003 | £121,780 | 17% |
75 Properties |
| 2002 | £101,115 | 7% |
79 Properties |
| 2001 | £94,357 | 28% |
66 Properties |
| 2000 | £67,615 | -15% |
60 Properties |
| 1999 | £77,836 | 2% |
76 Properties |
| 1998 | £76,411 | 15% |
64 Properties |
| 1997 | £65,302 | 13% |
86 Properties |
| 1996 | £56,498 | -11% |
74 Properties |
| 1995 | £62,798 | - |
61 Properties |
Property Price per Property Type in Curborough
Here you can find historic sold price data in order to help with your property search.
The average Property Paid Price for specific property types in the last three years are:
| Property Type | Average Sold Price | Sold Properties |
|---|---|---|
| Semi Detached House | £275,916.00 | 71 Semi Detached Houses |
| Detached House | £444,200.00 | 45 Detached Houses |
| Terraced House | £218,767.00 | 45 Terraced Houses |
| Flat | £147,000.00 | 2 Flats |

