
Houses for sale in Lichfield, Staffordshire
House Prices in Lichfield
Properties in Lichfield have an average house price of £363k and had 2,103 Property Transactions within the last 3 years.¹
Lichfield is an area in Staffordshire with 20,234 households², where the most expensive property was sold for £1.89M.
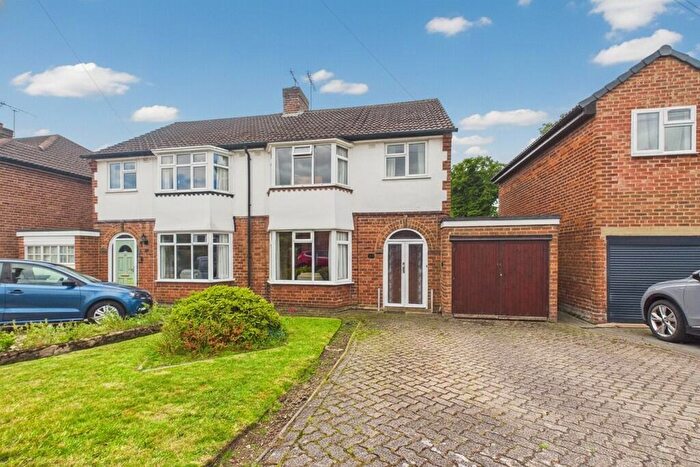
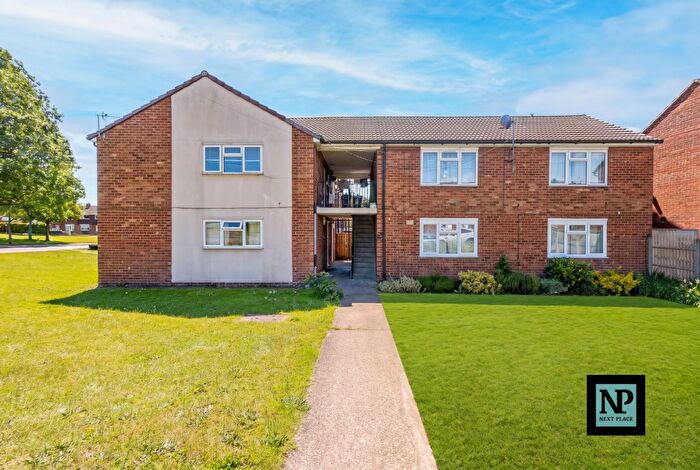
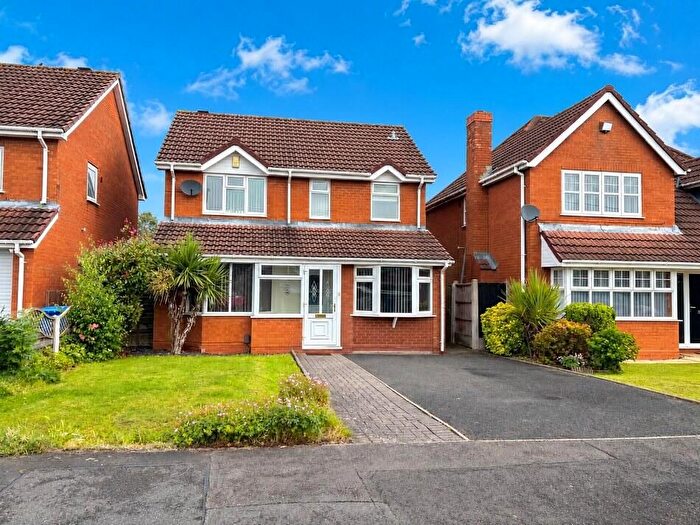
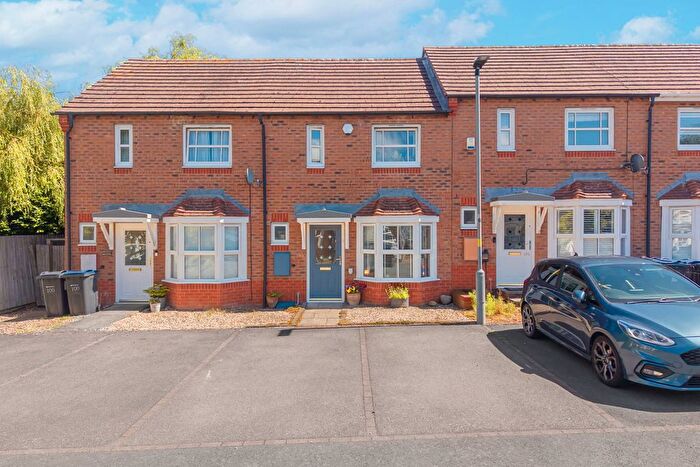
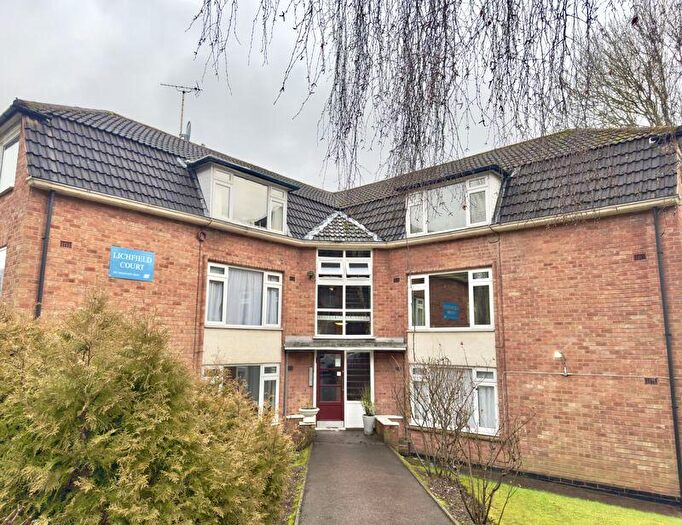
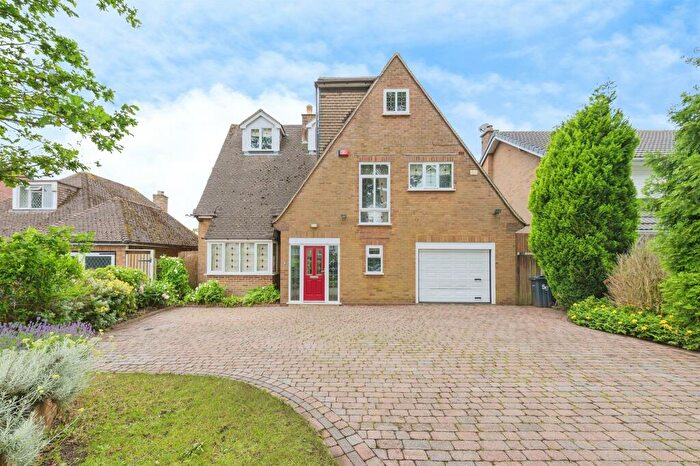
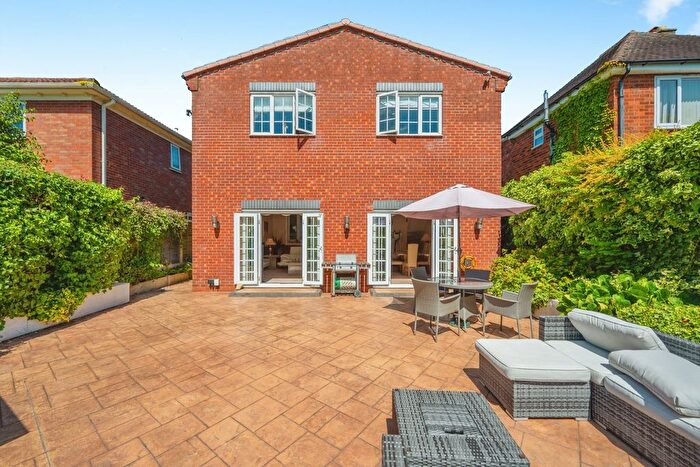
Properties for sale in Lichfield
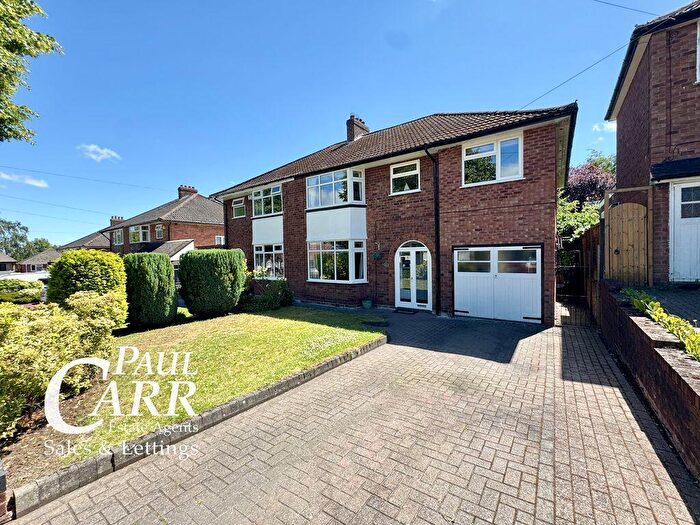
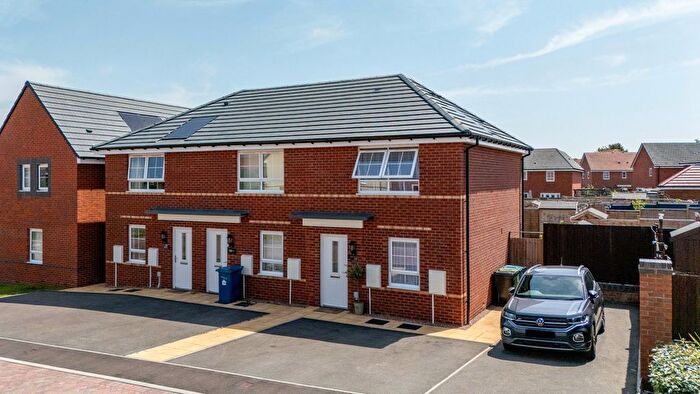
![]()
If you are looking to sell your house, let it out, or receive a property valuation, an expert can help you.
Click the button below to get started.
Neighbourhoods in Lichfield
Navigate through our locations to find the location of your next house in Lichfield, Staffordshire for sale or to rent.
Property price trends in Lichfield
According to the latest Land Registry data, the average home in Lichfield sold for £379,096 in 2026. That figure comes from a substantial record of 25,084 sales logged over the past 31 years.
Prices have continued to climb over the last three years. Compared with 2023, when the typical sale came in around £341,810, that's a rise of roughly 10.9%.
Looking back five years, average prices are up about 15.1% since 2021, a gain of around £49,827 in cash terms.
Zoom out to the past decade for the fuller picture. Back in 2016, homes here averaged £263,648, so the typical sold price has climbed about 43.8% since then, roughly 3.7% a year. Stretch the view to fifteen years and that annual pace holds at about 3.7%.
Frequently asked questions about Lichfield
What is the average price for a property for sale in Lichfield?
The average price for a property for sale in Lichfield is £362,682. This amount is 37% higher than the average price in Staffordshire. There are more than 10,000 property listings for sale in Lichfield.
What locations have the most expensive properties for sale in Lichfield?
The locations with the most expensive properties for sale in Lichfield are Highfield at an average of £988,333, Stonnall at an average of £688,750 and Longdon at an average of £667,000.
What locations have the most affordable properties for sale in Lichfield?
The locations with the most affordable properties for sale in Lichfield are Little Aston at an average of £259,500, Stowe at an average of £281,484 and Chadsmead at an average of £291,406.
Which train stations are available in or near Lichfield?
Some of the train stations available in or near Lichfield are Lichfield City, Lichfield Trent Valley and Shenstone.
Property Price Paid in Lichfield by Year
The average sold property price by year was:
| Year | Average Sold Price | Price Change |
Sold Properties
|
|---|---|---|---|
| 2026 | £379,096 | -0,4% |
48 Properties |
| 2025 | £380,511 | 5% |
725 Properties |
| 2024 | £361,400 | 5% |
717 Properties |
| 2023 | £341,810 | -5% |
613 Properties |
| 2022 | £358,631 | 8% |
799 Properties |
| 2021 | £329,269 | 2% |
1,043 Properties |
| 2020 | £323,083 | -9% |
785 Properties |
| 2019 | £353,629 | 16% |
1,054 Properties |
| 2018 | £296,785 | 2% |
1,003 Properties |
| 2017 | £290,738 | 9% |
939 Properties |
Property Price per Property Type in Lichfield
Here you can find historic sold price data in order to help with your property search.
The average Property Paid Price for specific property types in the last three years are:
| Property Type | Average Sold Price | Sold Properties |
|---|---|---|
| Semi Detached House | £324,290.00 | 597 Semi Detached Houses |
| Terraced House | £275,992.00 | 436 Terraced Houses |
| Detached House | £534,819.00 | 720 Detached Houses |
| Flat | £182,051.00 | 350 Flats |
Transport in Lichfield
Please see below transportation links in this area:
