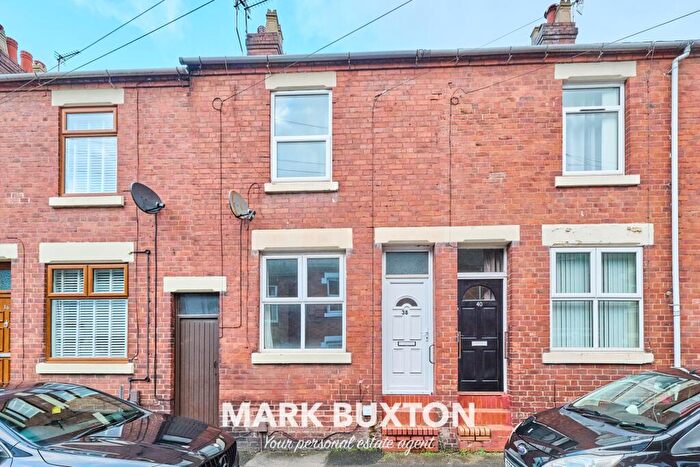
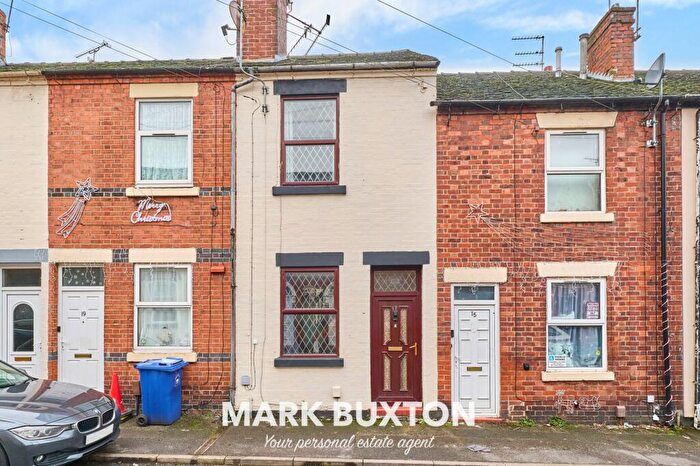
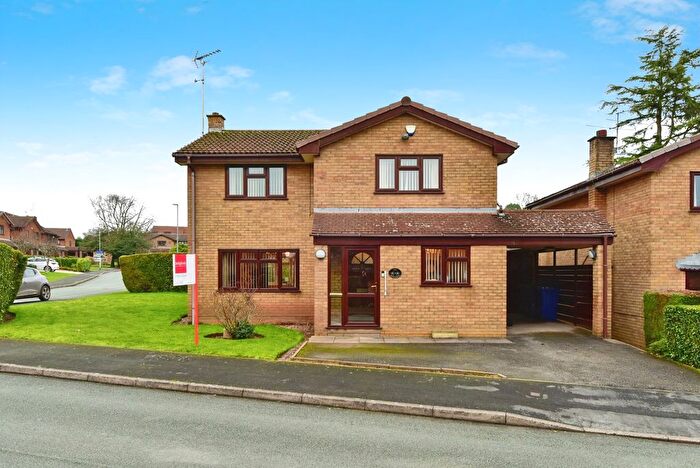
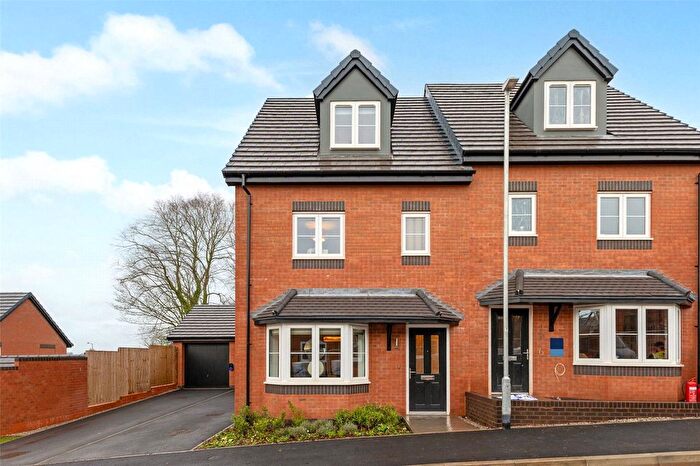
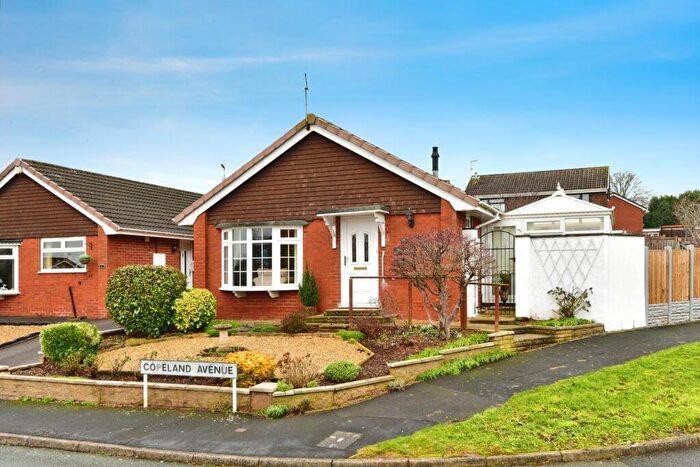
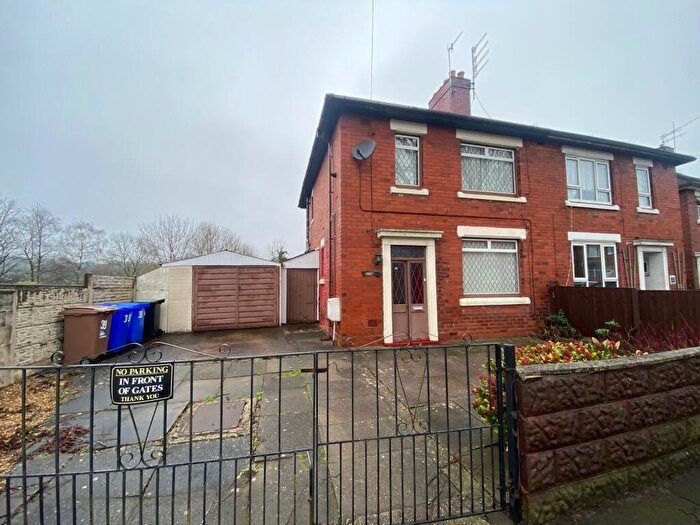
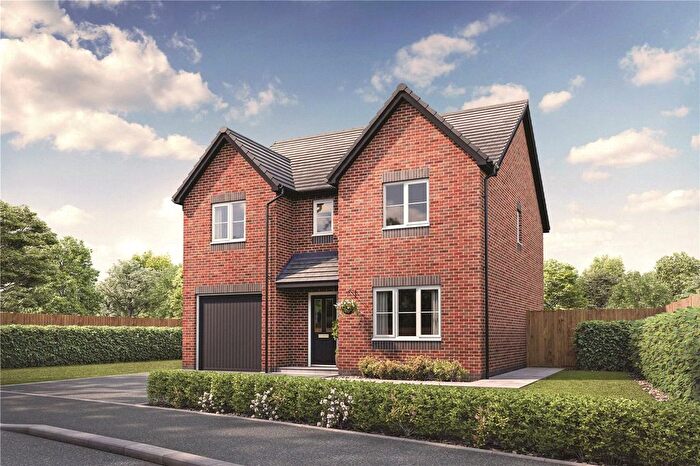
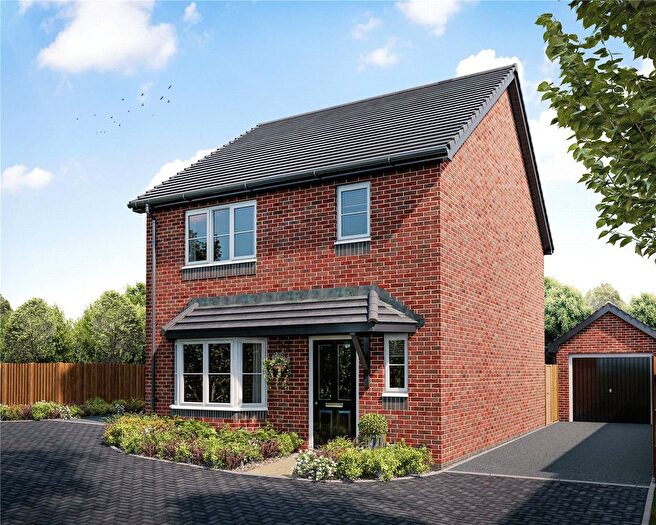
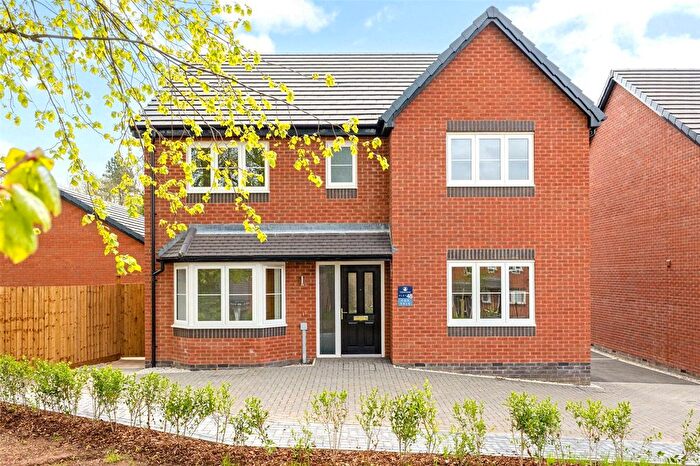
Houses for sale & to rent in Clayton, Newcastle
House Prices in Clayton
Properties in Clayton have an average house price of £213,489.00 and had 200 Property Transactions within the last 3 years¹.
Clayton is an area in Newcastle, Staffordshire with 1,939 households², where the most expensive property was sold for £425,000.00.
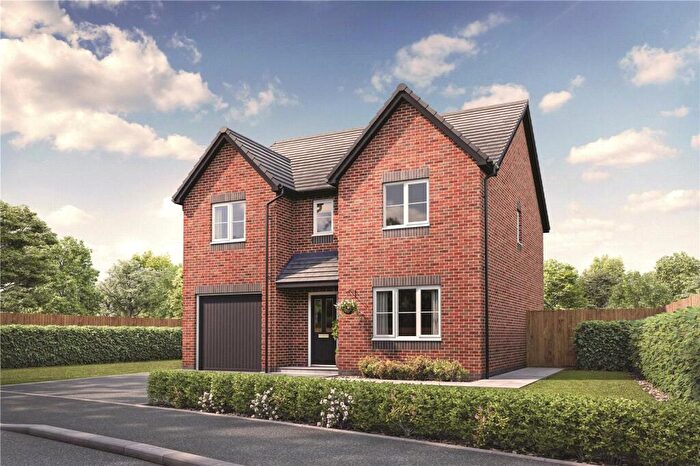
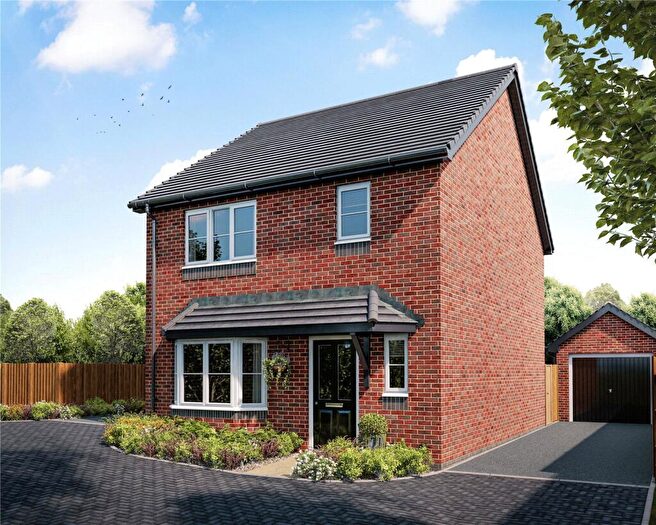
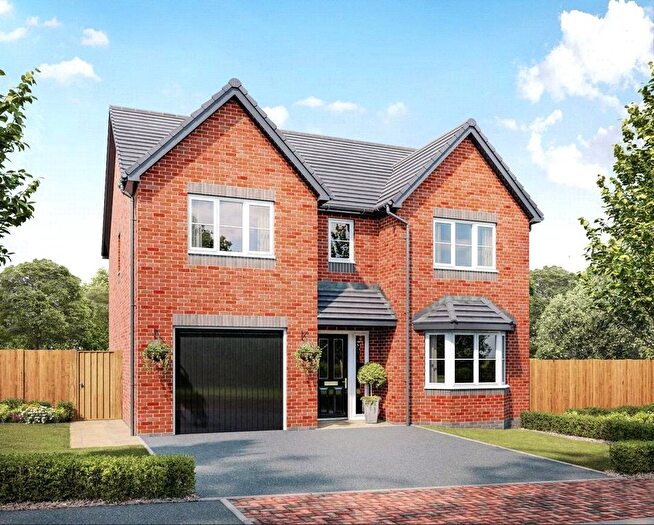
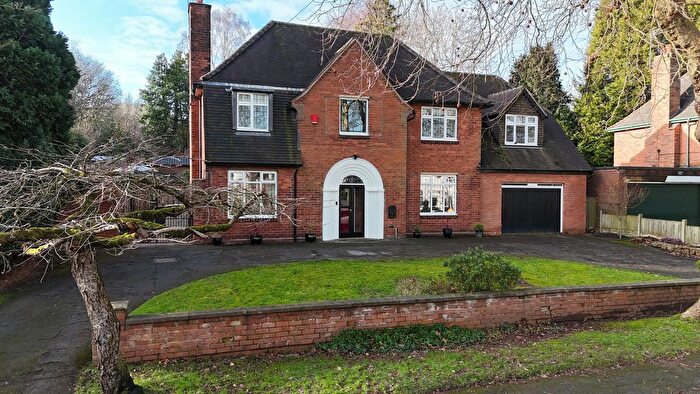
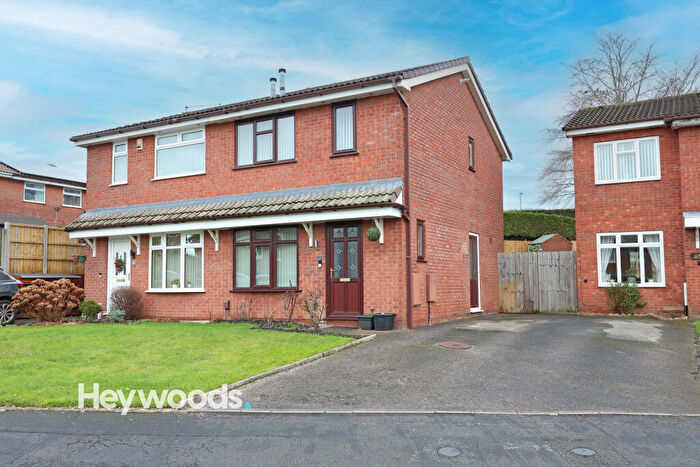
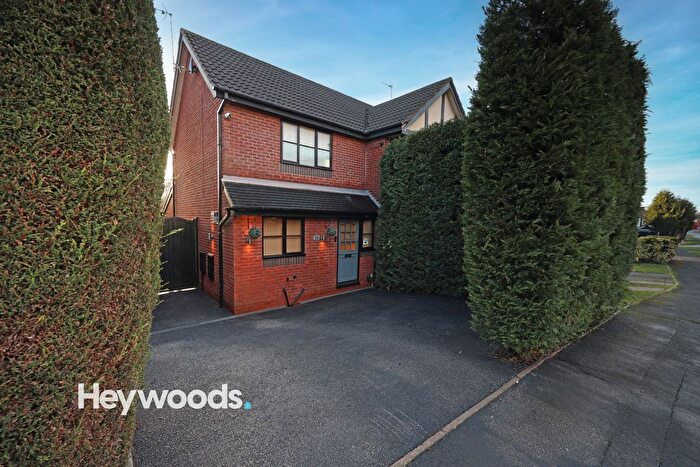
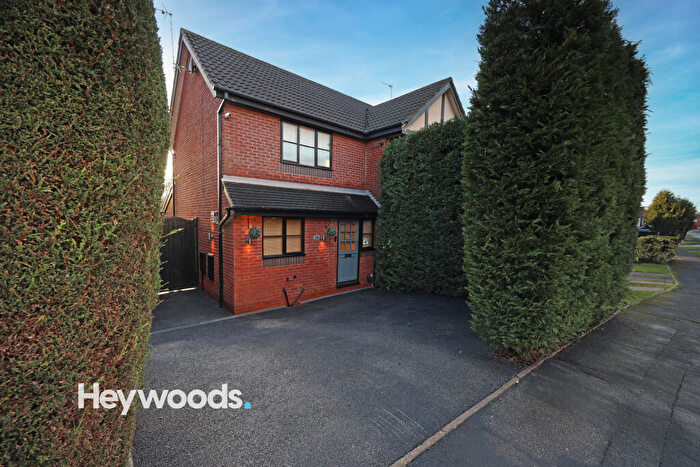
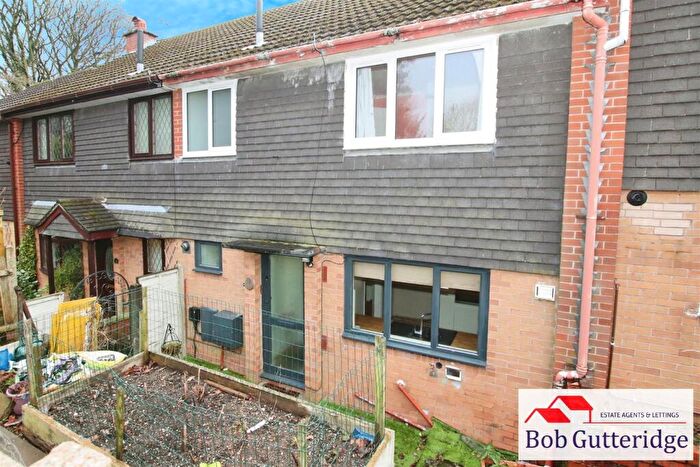
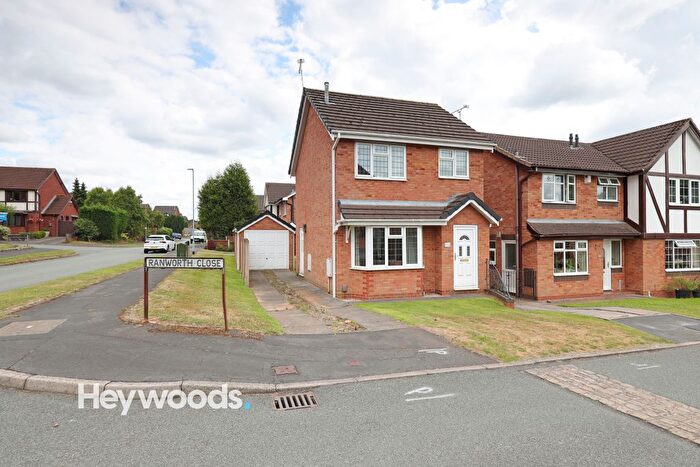
Properties for sale in Clayton
Roads and Postcodes in Clayton
Navigate through our locations to find the location of your next house in Clayton, Newcastle for sale or to rent.
| Streets | Postcodes |
|---|---|
| Ashton Court | ST5 4HR |
| Bedford Crescent | ST5 3EH |
| Berkshire Grove | ST5 3SX |
| Betley Place | ST5 3AZ |
| Brooke Place | ST5 3AS |
| Buckmaster Avenue | ST5 3AJ ST5 3AL ST5 3AN |
| Bunny Hill | ST5 3BT |
| Cambridge Drive | ST5 3AD ST5 3DA ST5 3DD ST5 3DQ |
| Chervil Close | ST5 3FF |
| Clayton Lane | ST5 3DP ST5 3DR ST5 3DS ST5 3DT ST5 3BY ST5 3DW |
| Clayton Road | ST5 3AH ST5 3ER ST5 3ET ST5 3EU ST5 3EW ST5 3NE ST5 4AD |
| Clumber Avenue | ST5 3AP ST5 3AX ST5 3AY |
| Clumber Grove | ST5 3AU |
| Cornwall Avenue | ST5 3DJ |
| Deakin Grove | ST5 3AW |
| Denbigh Close | ST5 3DL |
| Derby Place | ST5 3DX |
| Devon Close | ST5 3EL |
| Dorset Place | ST5 3DG |
| Durham Grove | ST5 3DE |
| Ferndown Drive | ST5 4BP |
| Fox Grove | ST5 4BT |
| Glendale Court | ST5 4HD |
| Gloucester Grange | ST5 3EE |
| Hereford Avenue | ST5 3ED ST5 3EJ |
| Hertford Grove | ST5 3DH |
| Leaswood Close | ST5 4BX |
| Leaswood Place | ST5 4BU |
| Leicester Close | ST5 3BP |
| Lilleshall Road | ST5 3BX |
| Lincoln Avenue | ST5 3AR ST5 3BA ST5 3BB ST5 3BD |
| Lincoln Grove | ST5 3AT |
| Mansfield Close | ST5 4HA |
| Melville Court | ST5 4HJ |
| Meriden Road | ST5 4HE |
| Milborne Drive | ST5 3EP |
| Monmouth Place | ST5 3DF |
| Northwood Close | ST5 4BS |
| Northwood Lane | ST5 4BN |
| Norwich Place | ST5 3BH |
| Penmere Drive | ST5 4HH |
| Rutland Place | ST5 3EQ |
| Salop Grove | ST5 3EB |
| Sorrell Gardens | ST5 3FA |
| Stafford Avenue | ST5 3BJ ST5 3BN ST5 3BW ST5 3BL |
| Stafford Crescent | ST5 3BZ ST5 3DU ST5 3DZ ST5 3EA |
| Suffolk Close | ST5 3DB |
| Tansy Way | ST5 3FD ST5 3FE |
| The Covert | ST5 4BL |
| The Green | ST5 4AA |
| The Spinney | ST5 4DA |
| Tittensor Road | ST5 3BS ST5 3BU |
| Valley View | ST5 3FB |
| Warwick Avenue | ST5 3DY |
| Wiltshire Grove | ST5 3SW |
| Woodside Crescent | ST5 4BW |
| Wynstay Court | ST5 4HL |
Transport near Clayton
- FAQ
- Price Paid By Year
- Property Type Price
Frequently asked questions about Clayton
What is the average price for a property for sale in Clayton?
The average price for a property for sale in Clayton is £213,489. This amount is 6% higher than the average price in Newcastle. There are 1,107 property listings for sale in Clayton.
What streets have the most expensive properties for sale in Clayton?
The streets with the most expensive properties for sale in Clayton are Wynstay Court at an average of £300,000, Milborne Drive at an average of £299,000 and Leicester Close at an average of £284,250.
What streets have the most affordable properties for sale in Clayton?
The streets with the most affordable properties for sale in Clayton are Suffolk Close at an average of £135,000, Salop Grove at an average of £138,000 and Leaswood Place at an average of £141,100.
Which train stations are available in or near Clayton?
Some of the train stations available in or near Clayton are Stoke-On-Trent, Longport and Longton.
Property Price Paid in Clayton by Year
The average sold property price by year was:
| Year | Average Sold Price | Price Change |
Sold Properties
|
|---|---|---|---|
| 2025 | £216,683 | 2% |
69 Properties |
| 2024 | £211,292 | -1% |
71 Properties |
| 2023 | £212,417 | 1% |
60 Properties |
| 2022 | £209,516 | 7% |
61 Properties |
| 2021 | £195,837 | 9% |
89 Properties |
| 2020 | £177,700 | 2% |
56 Properties |
| 2019 | £174,486 | -3% |
61 Properties |
| 2018 | £179,224 | 8% |
72 Properties |
| 2017 | £164,192 | 15% |
82 Properties |
| 2016 | £140,113 | -13% |
63 Properties |
| 2015 | £157,717 | 9% |
55 Properties |
| 2014 | £142,994 | 8% |
69 Properties |
| 2013 | £131,317 | -3% |
45 Properties |
| 2012 | £135,459 | 12% |
54 Properties |
| 2011 | £119,600 | -15% |
50 Properties |
| 2010 | £137,683 | -5% |
46 Properties |
| 2009 | £144,708 | -6% |
55 Properties |
| 2008 | £153,325 | -5% |
59 Properties |
| 2007 | £161,067 | 2% |
99 Properties |
| 2006 | £157,188 | 16% |
126 Properties |
| 2005 | £131,653 | 13% |
44 Properties |
| 2004 | £114,859 | 17% |
60 Properties |
| 2003 | £95,648 | 15% |
58 Properties |
| 2002 | £80,892 | 16% |
66 Properties |
| 2001 | £67,993 | 14% |
65 Properties |
| 2000 | £58,784 | 1% |
40 Properties |
| 1999 | £58,448 | 8% |
52 Properties |
| 1998 | £53,907 | -11% |
48 Properties |
| 1997 | £59,576 | 15% |
50 Properties |
| 1996 | £50,765 | - |
44 Properties |
| 1995 | £50,769 | - |
52 Properties |
Property Price per Property Type in Clayton
Here you can find historic sold price data in order to help with your property search.
The average Property Paid Price for specific property types in the last three years are:
| Property Type | Average Sold Price | Sold Properties |
|---|---|---|
| Semi Detached House | £208,910.00 | 115 Semi Detached Houses |
| Detached House | £255,210.00 | 50 Detached Houses |
| Terraced House | £188,281.00 | 26 Terraced Houses |
| Flat | £113,050.00 | 9 Flats |

