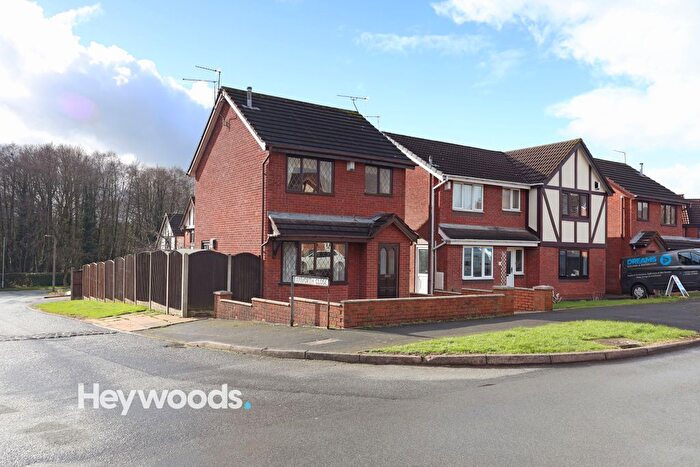
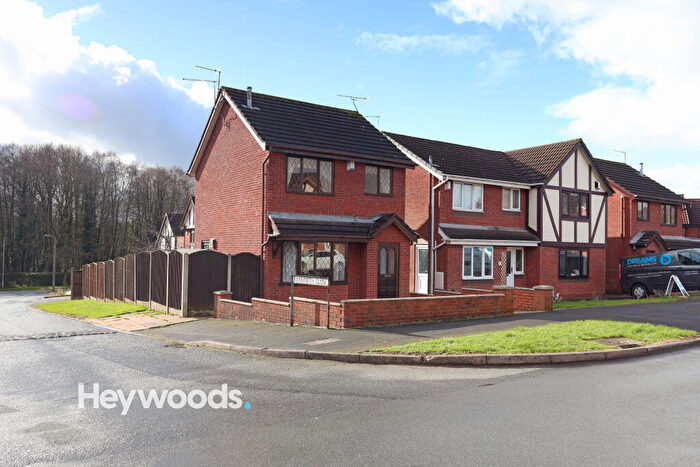
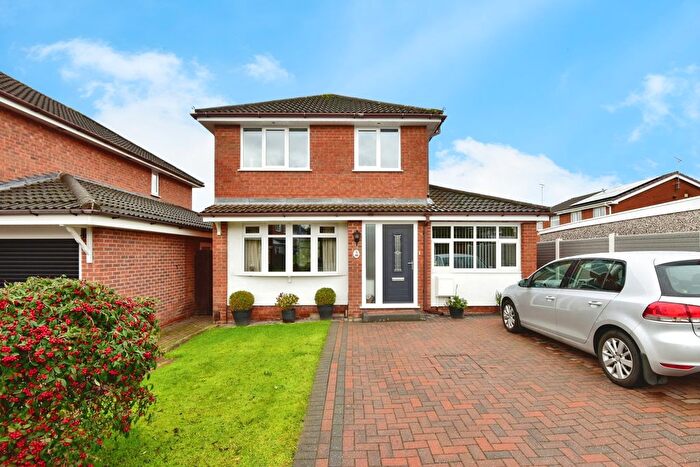
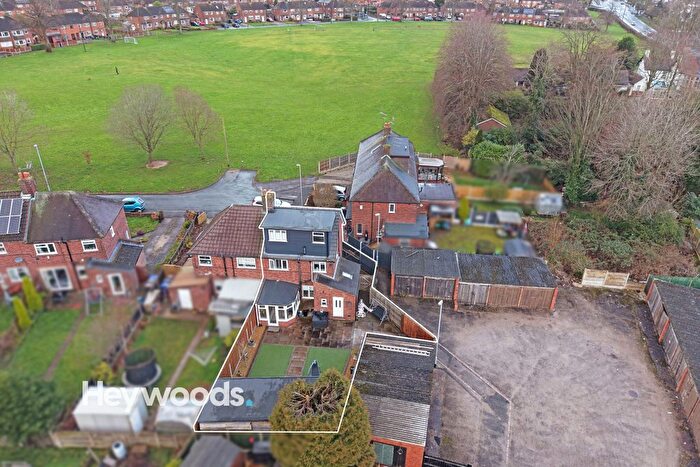
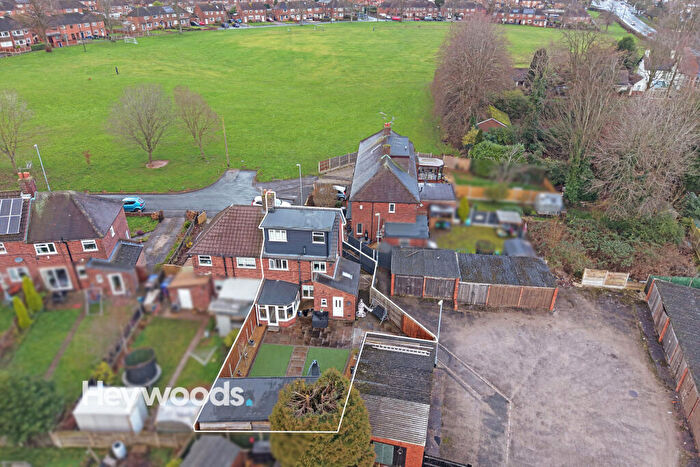
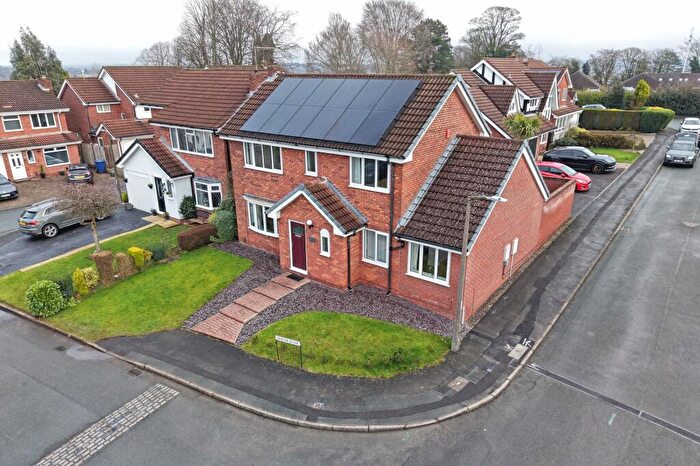
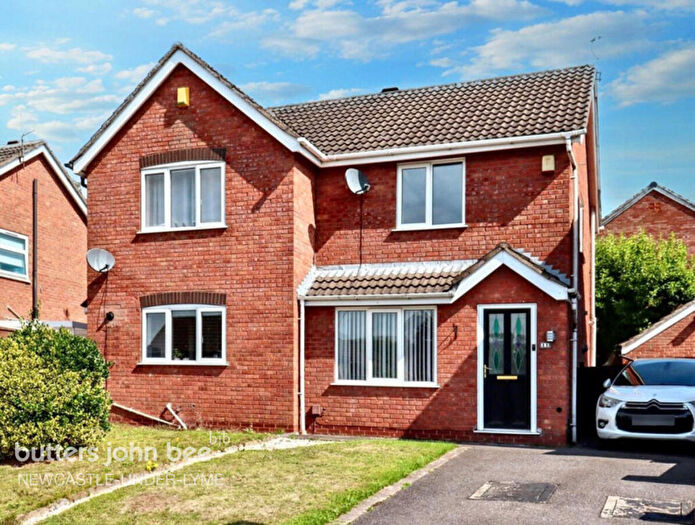
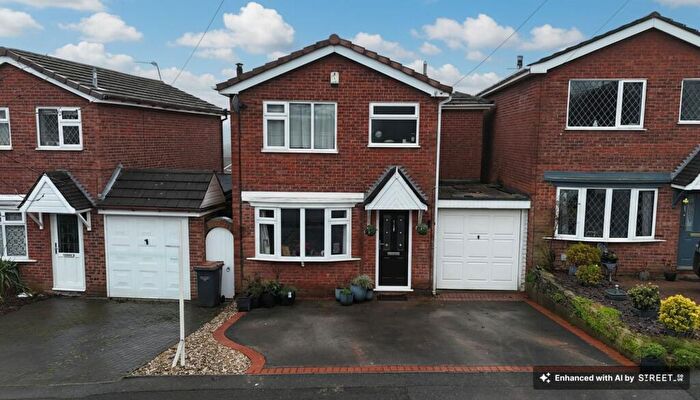
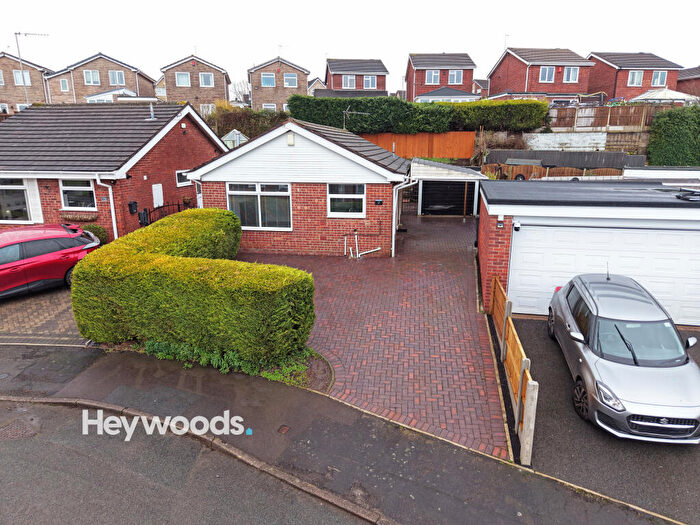
Houses for sale & to rent in Seabridge, Newcastle
House Prices in Seabridge
Properties in Seabridge have an average house price of £231,002.00 and had 232 Property Transactions within the last 3 years¹.
Seabridge is an area in Newcastle, Staffordshire with 2,482 households², where the most expensive property was sold for £525,000.00.
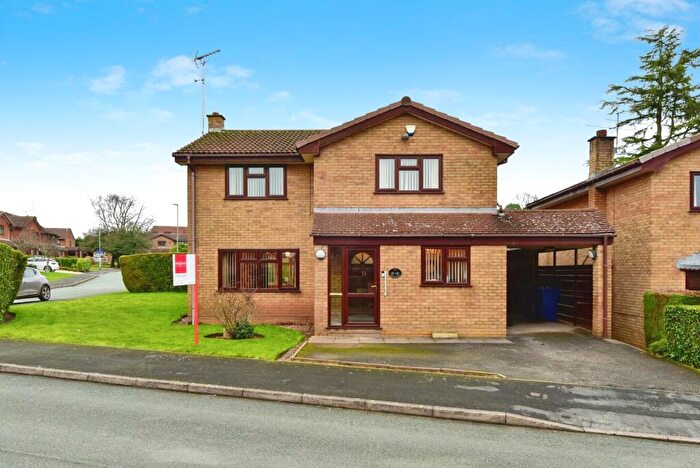
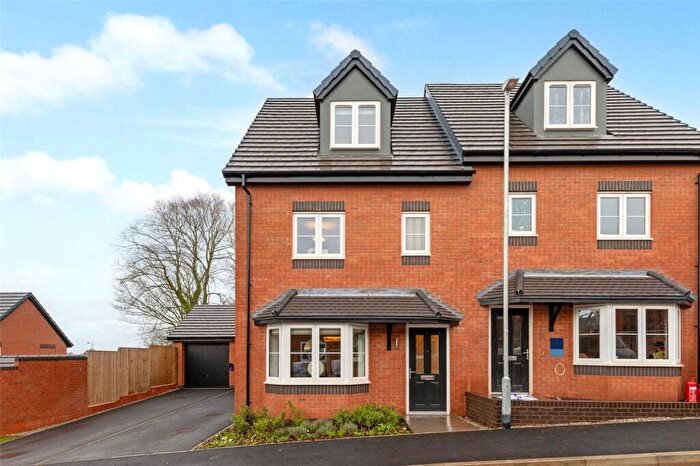
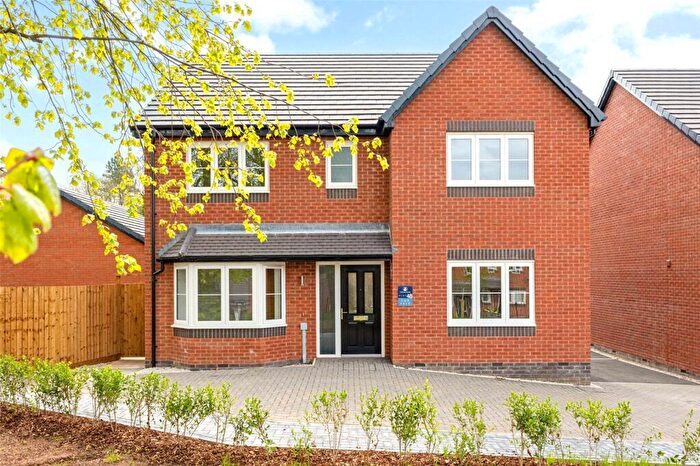
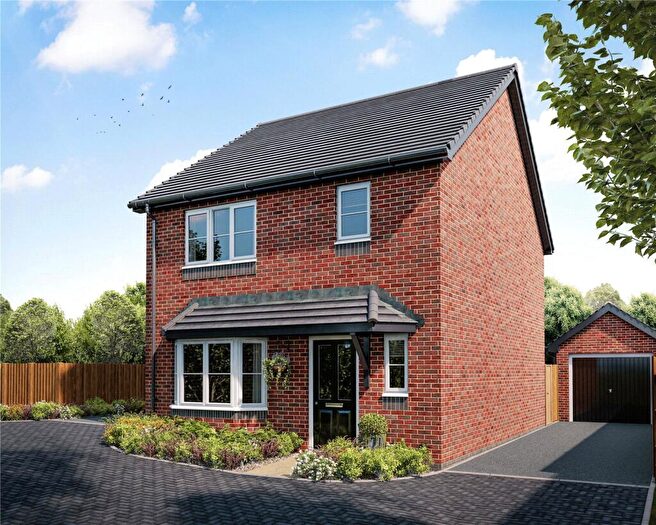
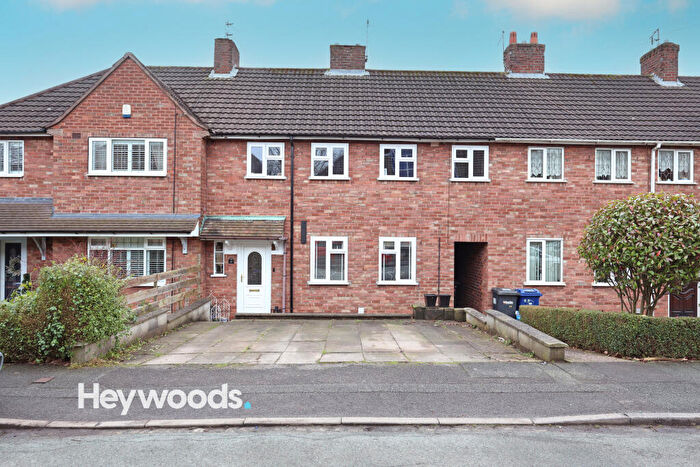
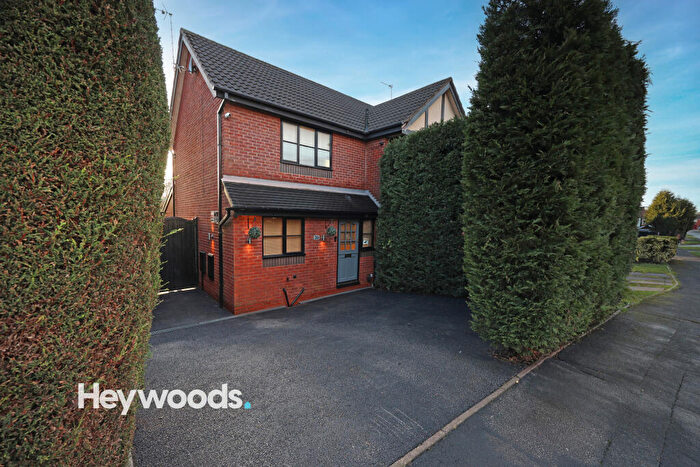
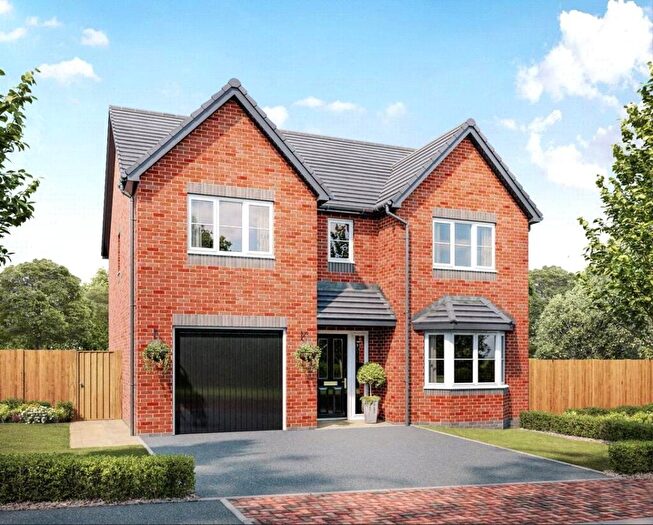
Properties for sale in Seabridge
Roads and Postcodes in Seabridge
Navigate through our locations to find the location of your next house in Seabridge, Newcastle for sale or to rent.
| Streets | Postcodes |
|---|---|
| Aldeburgh Drive | ST5 4LH |
| Ashdale Rise | ST5 4HG |
| Ashridge Avenue | ST5 4JA |
| Aynsley Avenue | ST5 4ET |
| Barford Road | ST5 3LF |
| Barn Court | ST5 4NL |
| Bircham Walk | ST5 4LG |
| Bladon Avenue | ST5 4JF |
| Blakeney Avenue | ST5 4HN |
| Brookwood Close | ST5 4HU |
| Cardington Close | ST5 3LJ |
| Carlton Avenue | ST5 4EU |
| Cavendish Grove | ST5 4HB |
| Churston Close | ST5 4LP |
| Claydon Crescent | ST5 4JR |
| Clayton Road | ST5 3HR ST5 4AB ST5 4DH |
| Cley Grove | ST5 4QU |
| Clyde Place | ST5 4AU |
| Coniston Grove | ST5 3HL |
| Copeland Avenue | ST5 4EZ |
| Darsham Gardens | ST5 4LW |
| Dart Place | ST5 4AP |
| Dee Lane | ST5 4AS |
| Denton Close | ST5 4JP |
| Dove Place | ST5 4AY |
| Enstone Court | ST5 4JE |
| Gedney Grove | ST5 4LN |
| Grasmere Avenue | ST5 3HF ST5 3HG |
| Hadleigh Close | ST5 4LD |
| Halesworth Crescent | ST5 4LJ |
| Hemsby Way | ST5 4QX |
| Hopedale Close | ST5 4HT |
| Humber Way | ST5 4BE |
| Kennet Close | ST5 4ER |
| Kensworth Close | ST5 3LH |
| Kingsbridge Avenue | ST5 3HP ST5 3HW |
| Kingsdown Mews | ST5 4NJ |
| Langford Road | ST5 3JZ |
| Lidgate Walk | ST5 4LT |
| Long Meadow | ST5 4HY |
| Meakin Avenue | ST5 4EY |
| Medway Place | ST5 4AH |
| Mersey Road | ST5 4BA |
| Moorcroft Avenue | ST5 4HQ |
| Morston Drive | ST5 4LS |
| Norfolk Close | ST5 4JY |
| Oakdale | ST5 4JG |
| Orwell Place | ST5 4AN |
| Paragon Avenue | ST5 4EX |
| Pinehurst Close | ST5 4LF |
| Portland Grove | ST5 4JH |
| Prestbury Avenue | ST5 4QY |
| Radstone Rise | ST5 4JB |
| Ranworth Close | ST5 4LL |
| Ravenswood Close | ST5 4JX |
| Ribble Close | ST5 4BG |
| Ridgmont Road | ST5 3LA ST5 3LB ST5 3LD |
| Rutherford Avenue | ST5 4JD |
| Rydal Way | ST5 3HD ST5 3HE |
| Seabridge Lane | ST5 3EX ST5 3EY ST5 3EZ ST5 3HA ST5 3JX ST5 4AG ST5 4AW |
| Severn Drive | ST5 4AQ ST5 4BH |
| Shefford Road | ST5 3LE |
| Spode Grove | ST5 4HF |
| Sterndale Drive | ST5 4HS |
| Stockwood Road | ST5 3JY ST5 3LG ST5 3LQ |
| Sudbury Place | ST5 4LB |
| Terrington Drive | ST5 4NB |
| Thames Road | ST5 4BB ST5 4BD |
| The Brackens | ST5 4JL |
| The Brambles | ST5 4JJ |
| The Glade | ST5 4NG |
| The Pippins | ST5 4HX |
| The Saplings | ST5 4HW |
| The Squirrels | ST5 4HZ |
| Thornham Close | ST5 4LR |
| Trent Grove | ST5 4EW |
| Tweed Grove | ST5 4AT |
| Tyne Way | ST5 4AX |
| Walsingham Gardens | ST5 4JT |
| Waveney Grove | ST5 3PN ST5 3SJ |
| Weaver Place | ST5 4BQ ST5 4NE |
| Welland Grove | ST5 4EP |
| Westcliffe Avenue | ST5 4JS |
| White House | ST5 4FB |
| Windermere Road | ST5 3HH ST5 3HN ST5 3HQ |
| Woodbridge Road | ST5 4LA |
| Wroxham Way | ST5 4JZ |
| Wye Road | ST5 4AZ |
| Yaxley Court | ST5 4JU |
Transport near Seabridge
- FAQ
- Price Paid By Year
- Property Type Price
Frequently asked questions about Seabridge
What is the average price for a property for sale in Seabridge?
The average price for a property for sale in Seabridge is £231,002. This amount is 15% higher than the average price in Newcastle. There are 1,077 property listings for sale in Seabridge.
What streets have the most expensive properties for sale in Seabridge?
The streets with the most expensive properties for sale in Seabridge are Long Meadow at an average of £399,166, Pinehurst Close at an average of £391,000 and Shefford Road at an average of £365,000.
What streets have the most affordable properties for sale in Seabridge?
The streets with the most affordable properties for sale in Seabridge are Dove Place at an average of £65,000, Humber Way at an average of £110,714 and Orwell Place at an average of £121,000.
Which train stations are available in or near Seabridge?
Some of the train stations available in or near Seabridge are Stoke-On-Trent, Longport and Longton.
Property Price Paid in Seabridge by Year
The average sold property price by year was:
| Year | Average Sold Price | Price Change |
Sold Properties
|
|---|---|---|---|
| 2025 | £235,970 | 3% |
79 Properties |
| 2024 | £228,814 | 0,3% |
74 Properties |
| 2023 | £228,085 | 2% |
79 Properties |
| 2022 | £222,957 | 5% |
83 Properties |
| 2021 | £211,658 | 4% |
106 Properties |
| 2020 | £202,502 | 12% |
89 Properties |
| 2019 | £177,275 | -4% |
72 Properties |
| 2018 | £184,885 | 2% |
88 Properties |
| 2017 | £181,441 | 0,1% |
98 Properties |
| 2016 | £181,349 | 1% |
79 Properties |
| 2015 | £180,383 | 9% |
88 Properties |
| 2014 | £163,387 | 6% |
104 Properties |
| 2013 | £152,932 | -5% |
72 Properties |
| 2012 | £159,856 | 2% |
81 Properties |
| 2011 | £157,202 | 4% |
58 Properties |
| 2010 | £151,133 | 3% |
55 Properties |
| 2009 | £146,288 | -11% |
61 Properties |
| 2008 | £161,916 | 5% |
71 Properties |
| 2007 | £153,022 | 1% |
94 Properties |
| 2006 | £151,485 | 1% |
112 Properties |
| 2005 | £150,622 | 6% |
88 Properties |
| 2004 | £141,900 | 18% |
100 Properties |
| 2003 | £116,522 | 20% |
109 Properties |
| 2002 | £93,218 | 11% |
126 Properties |
| 2001 | £83,204 | 16% |
97 Properties |
| 2000 | £69,844 | 8% |
95 Properties |
| 1999 | £64,565 | -1% |
104 Properties |
| 1998 | £65,459 | -1% |
93 Properties |
| 1997 | £66,358 | 11% |
126 Properties |
| 1996 | £58,973 | 4% |
126 Properties |
| 1995 | £56,803 | - |
103 Properties |
Property Price per Property Type in Seabridge
Here you can find historic sold price data in order to help with your property search.
The average Property Paid Price for specific property types in the last three years are:
| Property Type | Average Sold Price | Sold Properties |
|---|---|---|
| Semi Detached House | £187,848.00 | 88 Semi Detached Houses |
| Detached House | £296,803.00 | 110 Detached Houses |
| Terraced House | £140,160.00 | 28 Terraced Houses |
| Flat | £81,516.00 | 6 Flats |

