Houses for sale & to rent in Hagley, Rugeley
House Prices in Hagley
Properties in Hagley have an average house price of £203,608.00 and had 190 Property Transactions within the last 3 years¹.
Hagley is an area in Rugeley, Staffordshire with 1,837 households², where the most expensive property was sold for £715,000.00.
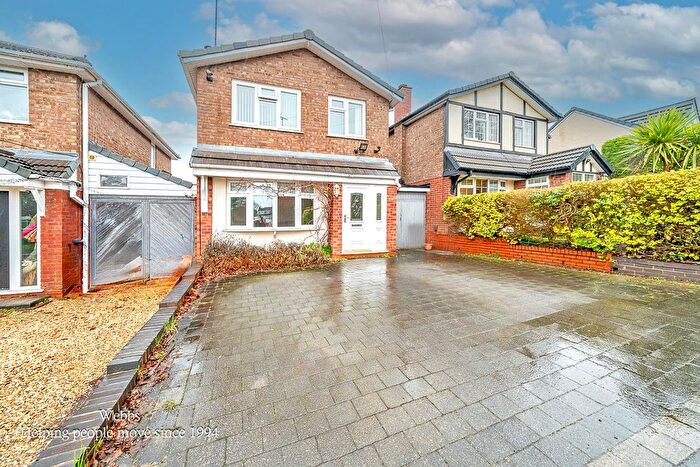
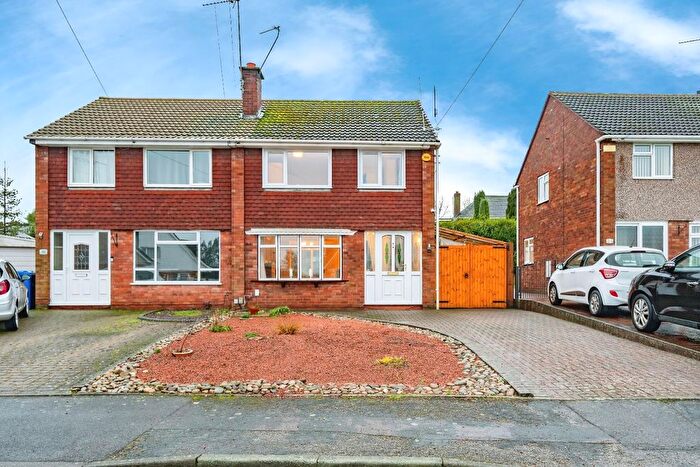
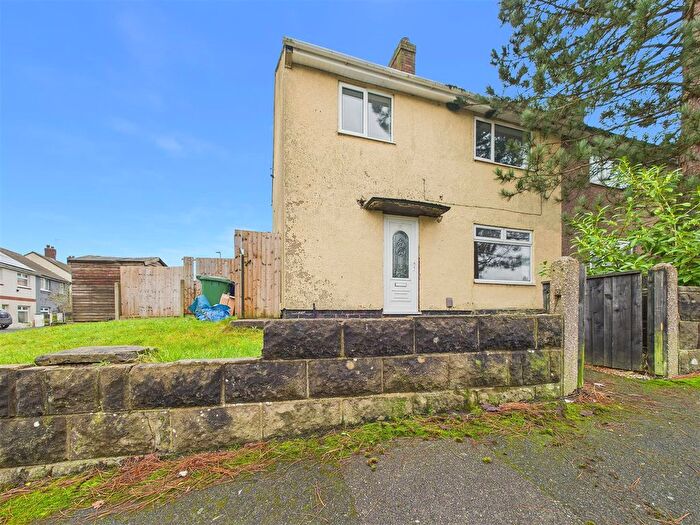
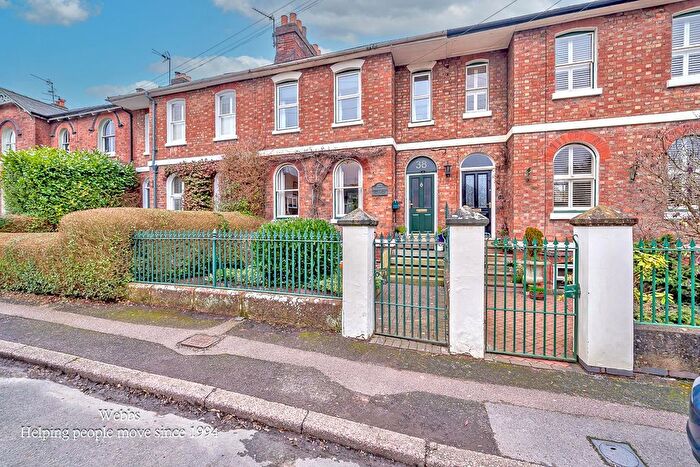
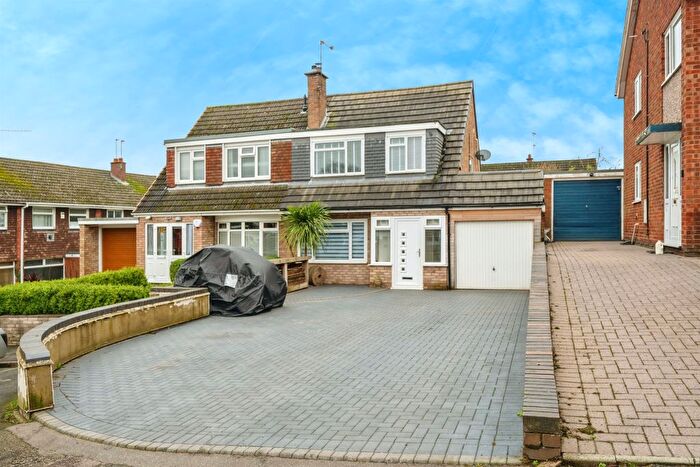
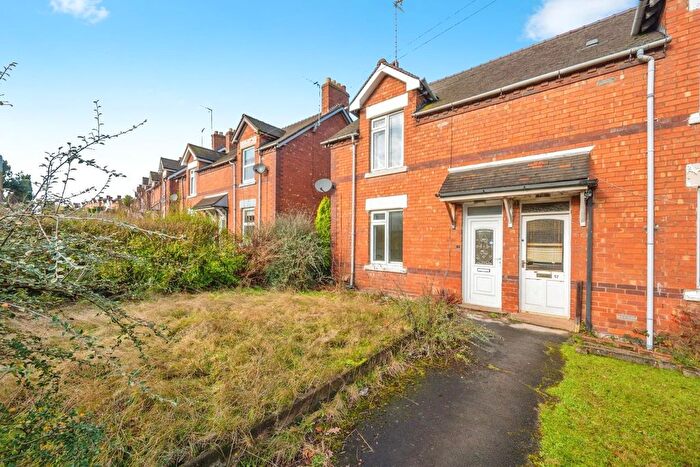
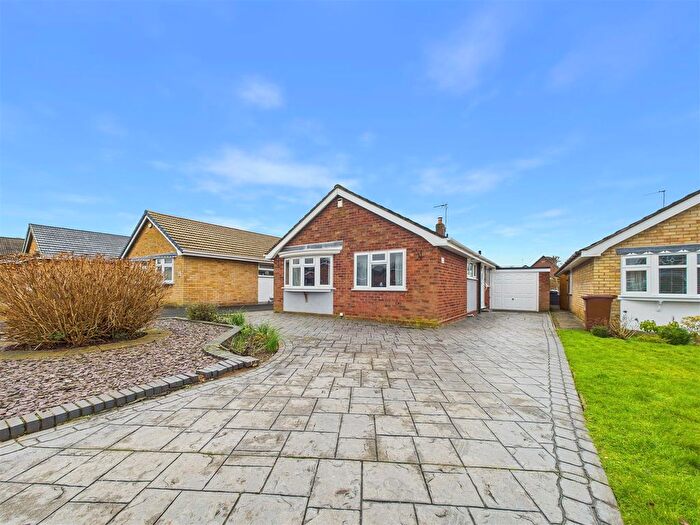
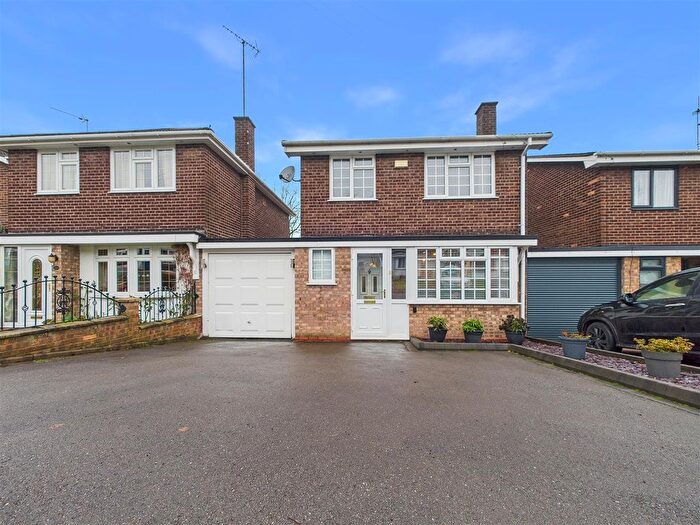
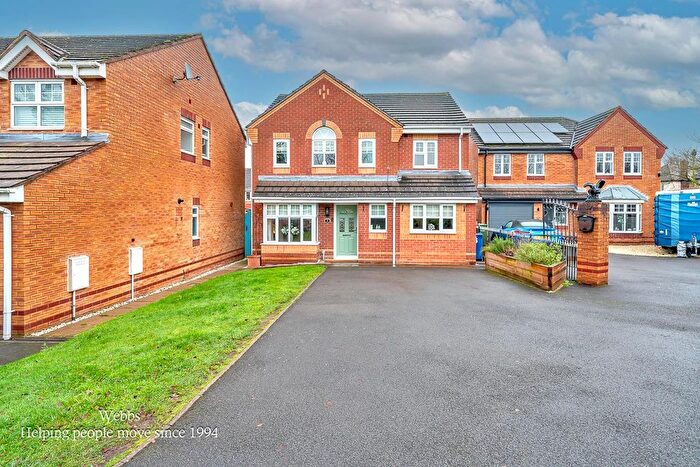
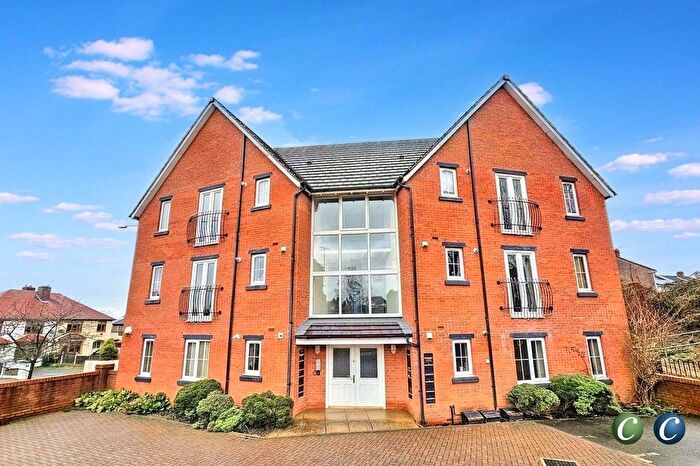
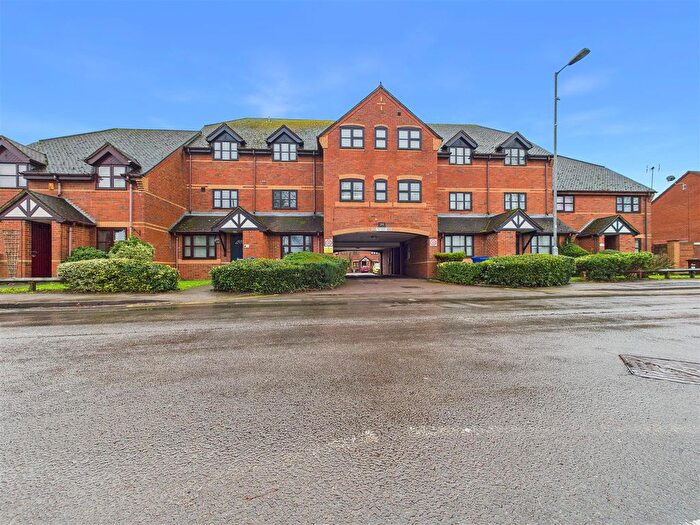
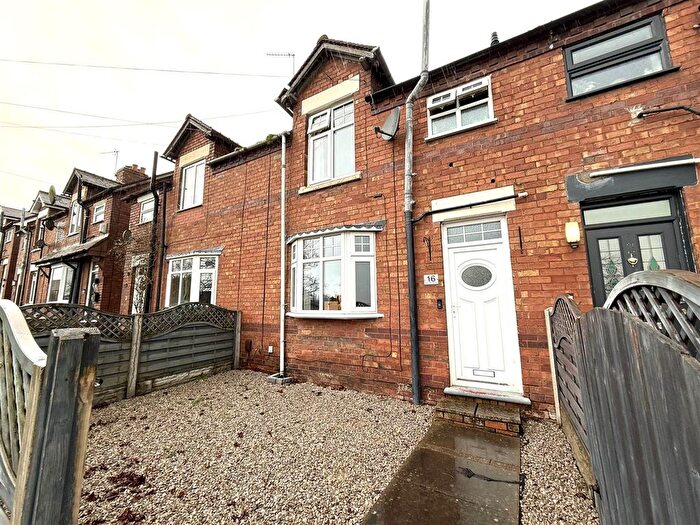
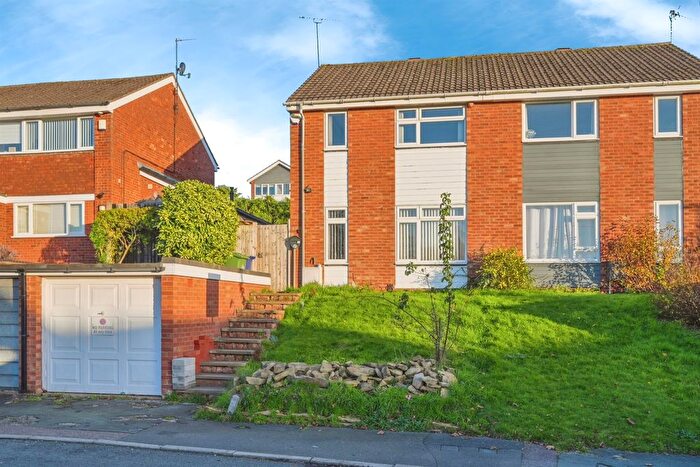
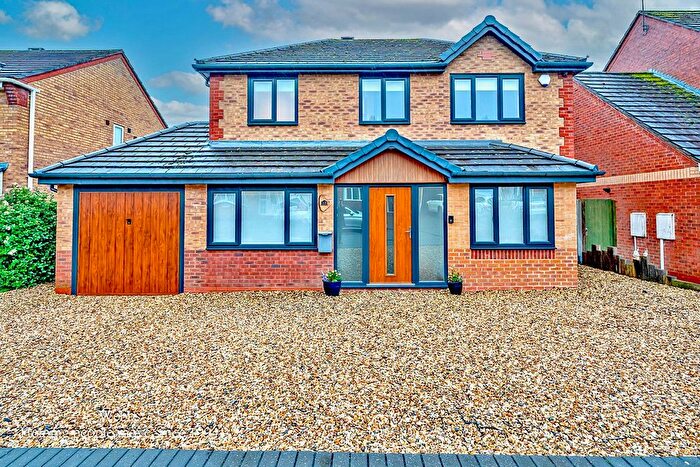
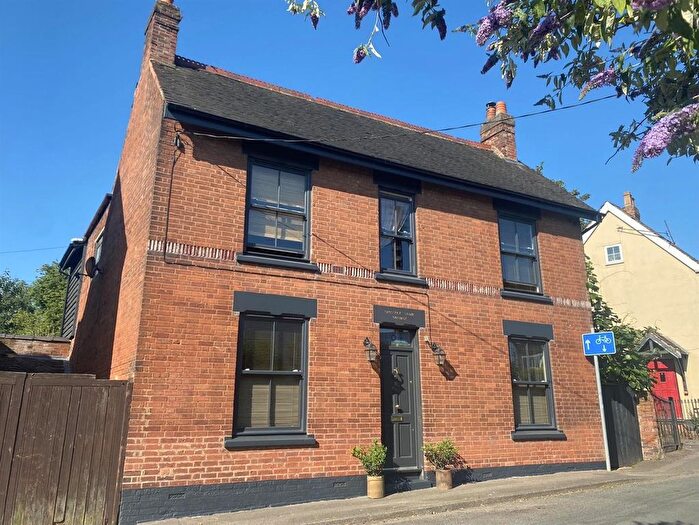
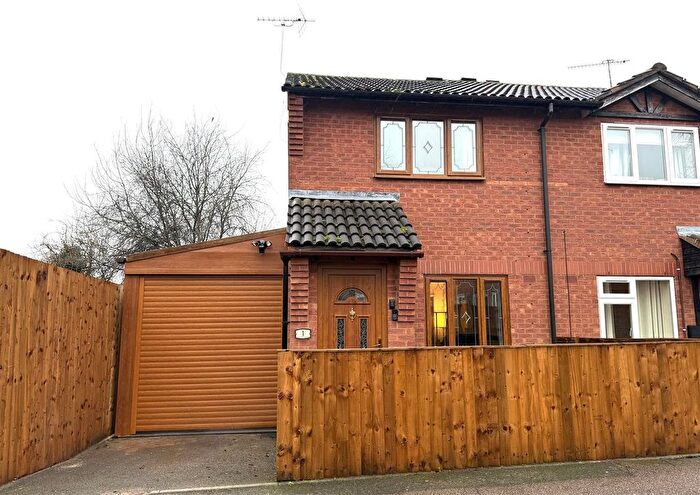
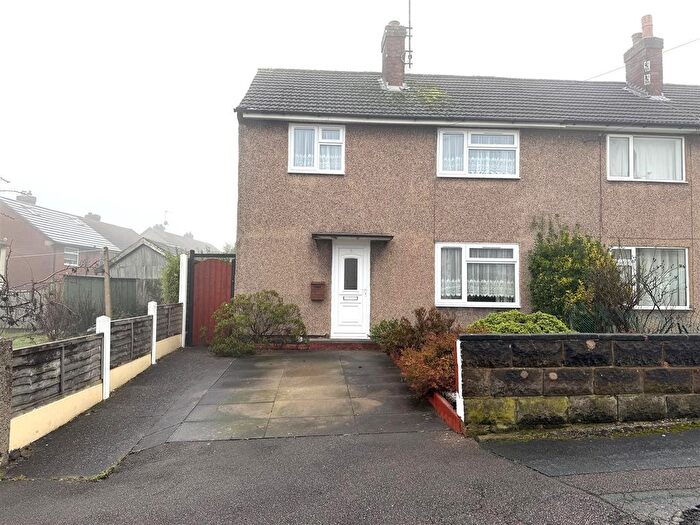
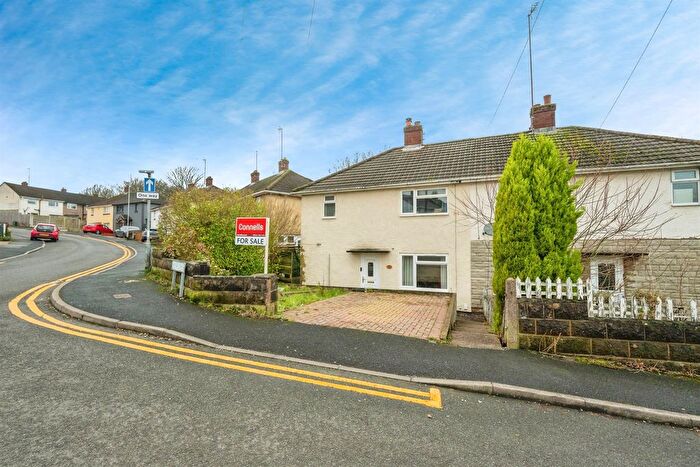
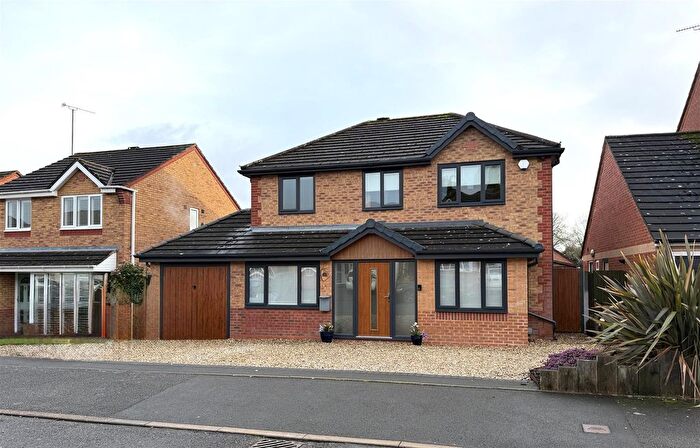
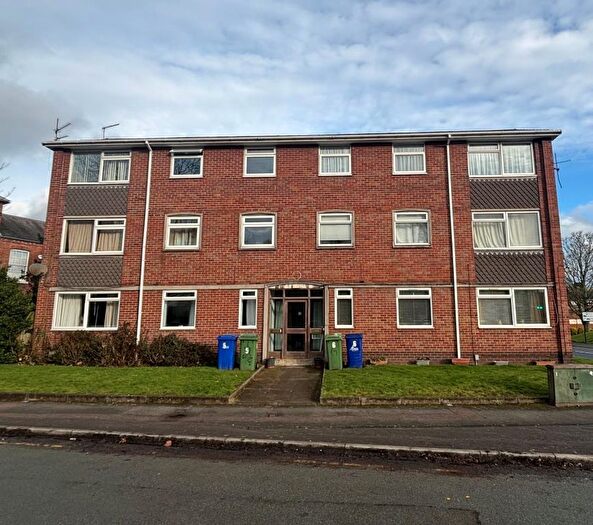
Properties for sale in Hagley
Previously listed properties in Hagley
Roads and Postcodes in Hagley
Navigate through our locations to find the location of your next house in Hagley, Rugeley for sale or to rent.
| Streets | Postcodes |
|---|---|
| Ashleigh Road | WS15 1NP |
| Bedford Way | WS15 1LB |
| Birchtree Lane | WS15 1NQ |
| Burnthill Lane | WS15 2HU WS15 2HW WS15 2HX WS15 2HY WS15 2HZ |
| Canterbury Drive | WS15 1GH |
| Cardigan Avenue | WS15 1LG |
| Chester Road | WS15 1GD |
| Chetwynd Close | WS15 1LU |
| Chichester Close | WS15 1GQ |
| Coppice Road | WS15 1LN WS15 1LT WS15 1NH WS15 1NR |
| Cornwall Court | WS15 1JY |
| Cross Road | WS15 2JE WS15 2JF |
| Curzon Place | WS15 1NX |
| Davy Place | WS15 1NA |
| Devall Close | WS15 1JW |
| Devonshire Drive | WS15 1LA |
| Durham Drive | WS15 1LD |
| Elizabethan Way | WS15 2EE |
| Essex Drive | WS15 1JX |
| Flaxley Road | WS15 1LY WS15 1LZ |
| Golden Close | WS15 2HF |
| Gorse Lane | WS15 1BD |
| Hagley Park Gardens | WS15 2GY |
| Hardie Avenue | WS15 1NT WS15 1NU |
| Hednesford Road | WS15 1JP WS15 1JR WS15 1JS WS15 1JT WS15 1JU |
| Hereford Way | WS15 1GP |
| High Falls | WS15 1JL |
| Hill Street | WS15 2JB |
| Hillary Crest | WS15 1NE |
| Hislop Road | WS15 1LR WS15 1LS |
| Holly Lodge Close | WS15 2JG |
| Horse Fair | WS15 2EL WS15 2YZ |
| Landor Crescent | WS15 1LP |
| Lansbury Road | WS15 1PD |
| Lower Birches Way | WS15 1GA WS15 1GB |
| Monarchy Close | WS15 2DE |
| Pear Tree Court | WS15 1HF |
| Pyrus Grove | WS15 1LL |
| Queensway | WS15 1NN WS15 1NS WS15 1NW |
| Royal Close | WS15 2DD |
| Rutland Avenue | WS15 1JN |
| Salisbury Close | WS15 1GF |
| Sandy Lane | WS15 2LA WS15 2LB WS15 2LF |
| Sankey Crescent | WS15 1PA |
| Sarah Challinor Close | WS15 2LE |
| Shaftesbury Road | WS15 1PB |
| Somerset Avenue | WS15 1LE WS15 1LF |
| Somerville Terrace | WS15 2JA |
| St Augustines Road | WS15 1NF |
| St Edwards Green | WS15 1LW |
| Stilecop Road | WS15 1ND |
| Surrey Close | WS15 1JZ |
| Tom Smith Way | WS15 1FT |
| Truro Close | WS15 1GJ |
| Uplands Green | WS15 1NB |
| Upper Cross Road | WS15 2JD |
| Wells Close | WS15 1GG |
| Whitgreave Lane | WS15 1NG |
| Windsor Close | WS15 2DB |
| Worcester Close | WS15 1GE |
| York Close | WS15 1GL |
| WS15 1RJ |
Transport near Hagley
- FAQ
- Price Paid By Year
- Property Type Price
Frequently asked questions about Hagley
What is the average price for a property for sale in Hagley?
The average price for a property for sale in Hagley is £203,608. This amount is 23% lower than the average price in Rugeley. There are 279 property listings for sale in Hagley.
What streets have the most expensive properties for sale in Hagley?
The streets with the most expensive properties for sale in Hagley are Hereford Way at an average of £376,665, Lower Birches Way at an average of £334,181 and Wells Close at an average of £322,450.
What streets have the most affordable properties for sale in Hagley?
The streets with the most affordable properties for sale in Hagley are Sankey Crescent at an average of £101,000, Truro Close at an average of £110,000 and Curzon Place at an average of £110,000.
Which train stations are available in or near Hagley?
Some of the train stations available in or near Hagley are Rugeley Town, Rugeley Trent Valley and Hednesford.
Property Price Paid in Hagley by Year
The average sold property price by year was:
| Year | Average Sold Price | Price Change |
Sold Properties
|
|---|---|---|---|
| 2025 | £218,026 | 9% |
63 Properties |
| 2024 | £197,899 | 2% |
70 Properties |
| 2023 | £194,683 | -2% |
57 Properties |
| 2022 | £199,294 | 0,3% |
56 Properties |
| 2021 | £198,751 | 19% |
85 Properties |
| 2020 | £160,142 | 2% |
55 Properties |
| 2019 | £157,179 | -5% |
75 Properties |
| 2018 | £165,211 | -4% |
78 Properties |
| 2017 | £172,190 | 17% |
70 Properties |
| 2016 | £142,698 | 5% |
71 Properties |
| 2015 | £135,916 | 8% |
62 Properties |
| 2014 | £125,591 | -5% |
66 Properties |
| 2013 | £132,116 | -7% |
49 Properties |
| 2012 | £141,453 | 7% |
41 Properties |
| 2011 | £131,374 | 7% |
36 Properties |
| 2010 | £122,407 | -5% |
38 Properties |
| 2009 | £128,381 | -11% |
35 Properties |
| 2008 | £142,322 | -3% |
57 Properties |
| 2007 | £146,465 | 6% |
91 Properties |
| 2006 | £138,224 | 8% |
120 Properties |
| 2005 | £126,568 | -3% |
90 Properties |
| 2004 | £130,006 | 2% |
203 Properties |
| 2003 | £126,783 | 17% |
270 Properties |
| 2002 | £105,687 | 51% |
210 Properties |
| 2001 | £52,137 | 12% |
67 Properties |
| 2000 | £45,919 | -10% |
54 Properties |
| 1999 | £50,500 | 6% |
50 Properties |
| 1998 | £47,220 | 12% |
36 Properties |
| 1997 | £41,338 | 4% |
38 Properties |
| 1996 | £39,689 | 10% |
38 Properties |
| 1995 | £35,625 | - |
37 Properties |
Property Price per Property Type in Hagley
Here you can find historic sold price data in order to help with your property search.
The average Property Paid Price for specific property types in the last three years are:
| Property Type | Average Sold Price | Sold Properties |
|---|---|---|
| Semi Detached House | £165,612.00 | 86 Semi Detached Houses |
| Detached House | £338,077.00 | 47 Detached Houses |
| Terraced House | £169,255.00 | 40 Terraced Houses |
| Flat | £104,888.00 | 17 Flats |

