
Houses for sale & to rent in Rugeley, Staffordshire
House Prices in Rugeley
Properties in Rugeley have an average house price of £266k and had 1,506 Property Transactions within the last 3 years.¹
Rugeley is an area in Staffordshire with 15,229 households², where the most expensive property was sold for £1.9M.
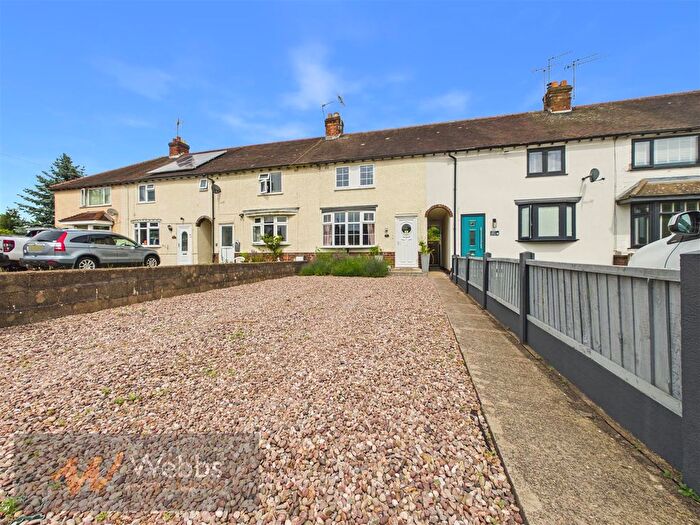
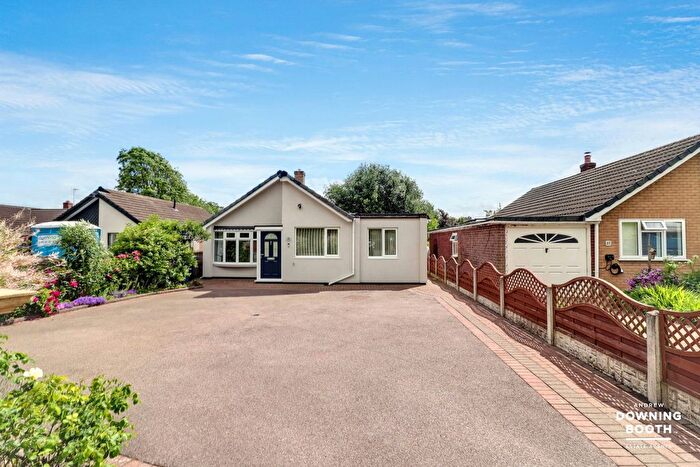
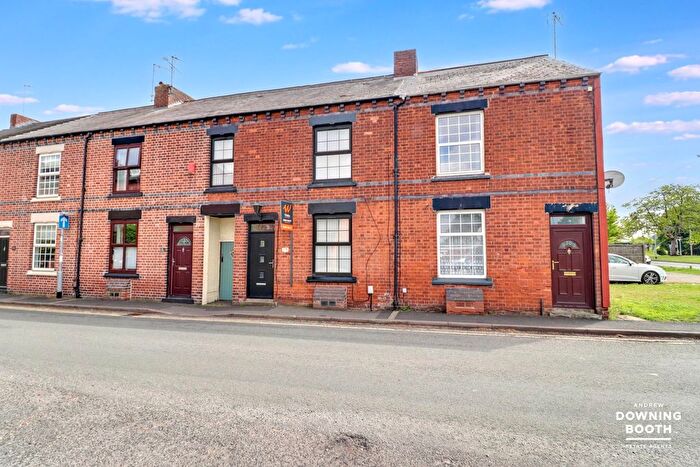
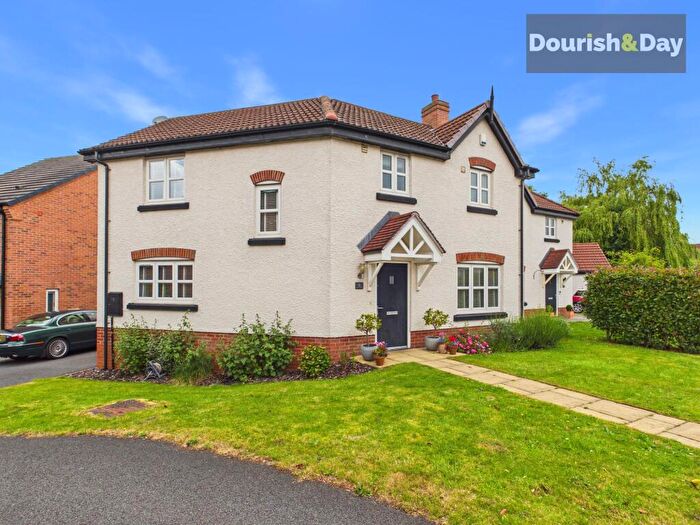
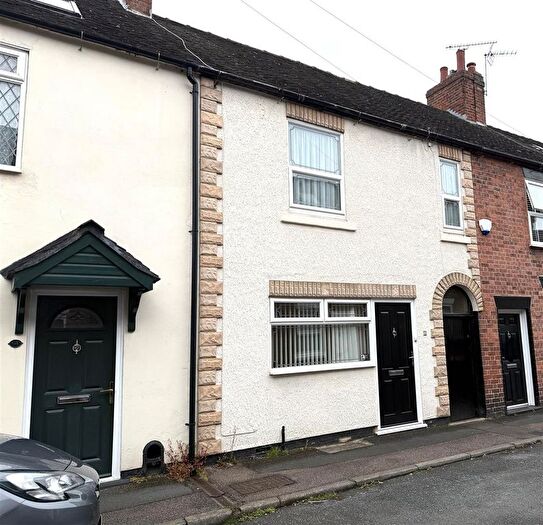
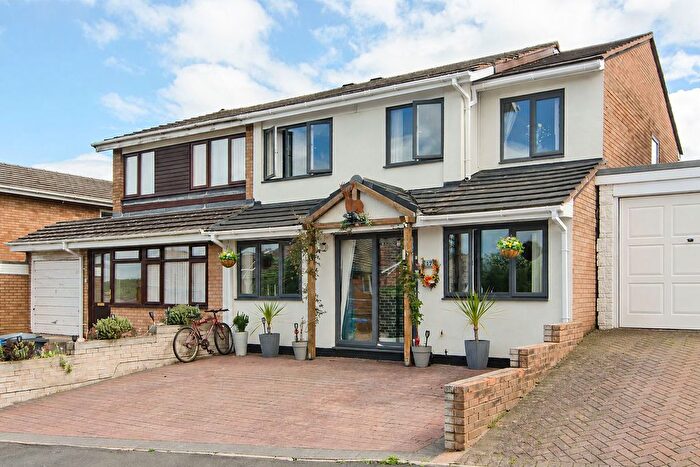
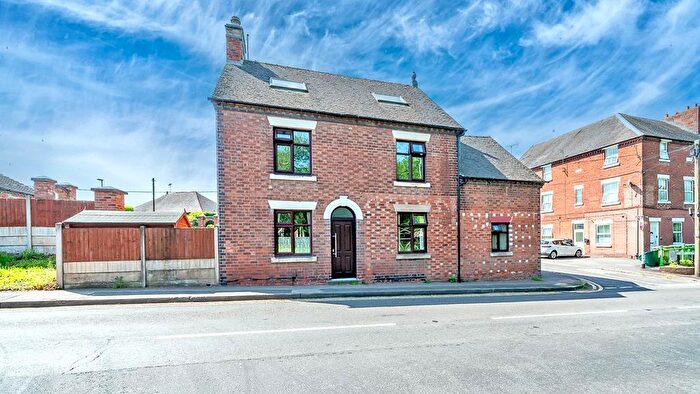
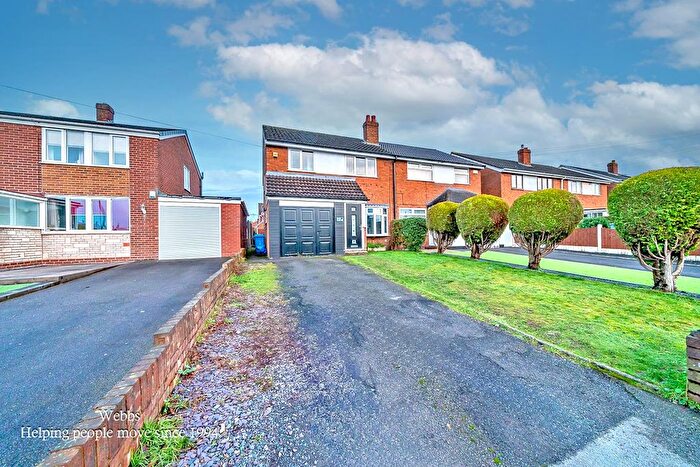
Properties for sale in Rugeley
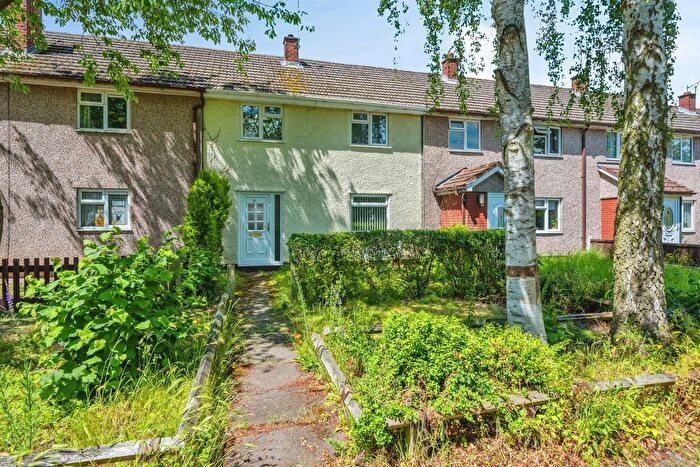
![]()
If you are looking to sell your house, let it out, or receive a property valuation, an expert can help you.
Click the button below to get started.
Neighbourhoods in Rugeley
Navigate through our locations to find the location of your next house in Rugeley, Staffordshire for sale or to rent.
Transport in Rugeley
Please see below transportation links in this area:

- FAQ
- Price Paid By Year
- Property Type Price
Frequently asked questions about Rugeley
What is the average price for a property for sale in Rugeley?
The average price for a property for sale in Rugeley is £266,170. This amount is 0.49% higher than the average price in Staffordshire. There are 7,772 property listings for sale in Rugeley.
What locations have the most expensive properties for sale in Rugeley?
The locations with the most expensive properties for sale in Rugeley are Longdon at an average of £596,594, Colton & the Ridwares at an average of £585,000 and Bagots at an average of £516,984.
What locations have the most affordable properties for sale in Rugeley?
The locations with the most affordable properties for sale in Rugeley are Hagley at an average of £202,995, Brereton And Ravenhill at an average of £214,498 and Western Springs at an average of £223,041.
Which train stations are available in or near Rugeley?
Some of the train stations available in or near Rugeley are Rugeley Town, Rugeley Trent Valley and Hednesford.
Property Price Paid in Rugeley by Year
The average sold property price by year was:
| Year | Average Sold Price | Price Change |
Sold Properties
|
|---|---|---|---|
| 2026 | £258,407 | -5% |
27 Properties |
| 2025 | £272,339 | 4% |
536 Properties |
| 2024 | £261,117 | -1% |
492 Properties |
| 2023 | £264,817 | 1% |
451 Properties |
| 2022 | £262,859 | 5% |
583 Properties |
| 2021 | £249,154 | 9% |
745 Properties |
| 2020 | £226,406 | 4% |
574 Properties |
| 2019 | £216,554 | -1% |
640 Properties |
| 2018 | £219,458 | 4% |
677 Properties |
| 2017 | £209,847 | 3% |
714 Properties |
| 2016 | £203,852 | 11% |
685 Properties |
| 2015 | £181,461 | 4% |
645 Properties |
| 2014 | £173,808 | -0,2% |
639 Properties |
| 2013 | £174,162 | 0,3% |
572 Properties |
| 2012 | £173,612 | 5% |
445 Properties |
| 2011 | £164,349 | -9% |
483 Properties |
| 2010 | £179,731 | 8% |
325 Properties |
| 2009 | £165,926 | -7% |
290 Properties |
| 2008 | £177,673 | -2% |
383 Properties |
| 2007 | £181,119 | 6% |
711 Properties |
| 2006 | £169,481 | 11% |
701 Properties |
| 2005 | £151,634 | 5% |
615 Properties |
| 2004 | £144,093 | 12% |
782 Properties |
| 2003 | £126,294 | 12% |
862 Properties |
| 2002 | £111,405 | 22% |
869 Properties |
| 2001 | £86,988 | 9% |
677 Properties |
| 2000 | £78,854 | 5% |
678 Properties |
| 1999 | £74,838 | 9% |
651 Properties |
| 1998 | £68,030 | 7% |
621 Properties |
| 1997 | £63,023 | -3% |
615 Properties |
| 1996 | £65,042 | 8% |
603 Properties |
| 1995 | £59,729 | - |
446 Properties |
Property Price per Property Type in Rugeley
Here you can find historic sold price data in order to help with your property search.
The average Property Paid Price for specific property types in the last three years are:
| Property Type | Average Sold Price | Sold Properties |
|---|---|---|
| Semi Detached House | £216,953.00 | 561 Semi Detached Houses |
| Detached House | £408,966.00 | 470 Detached Houses |
| Terraced House | £198,933.00 | 382 Terraced Houses |
| Flat | £117,591.00 | 93 Flats |