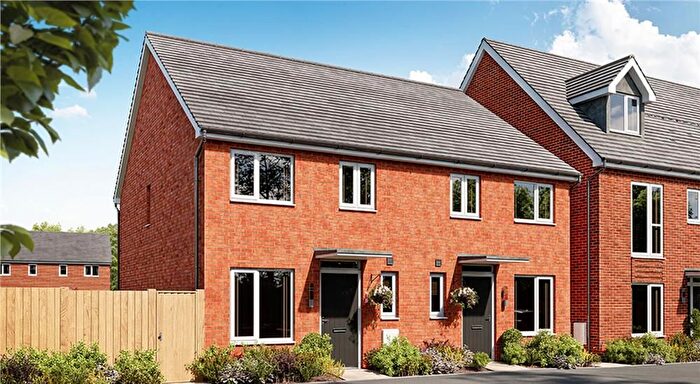
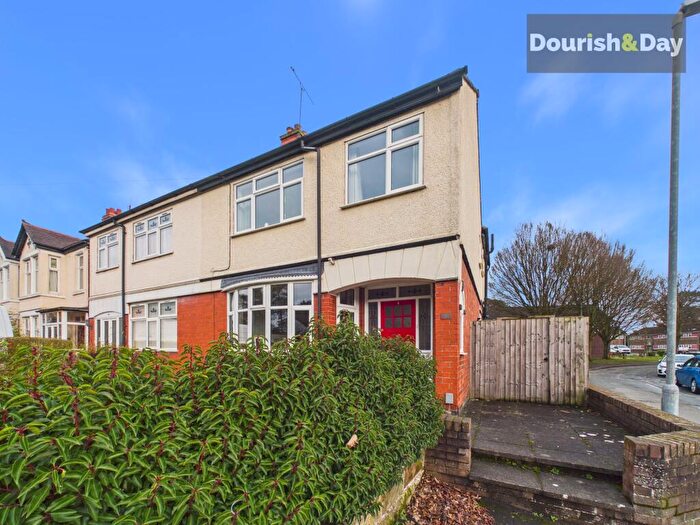
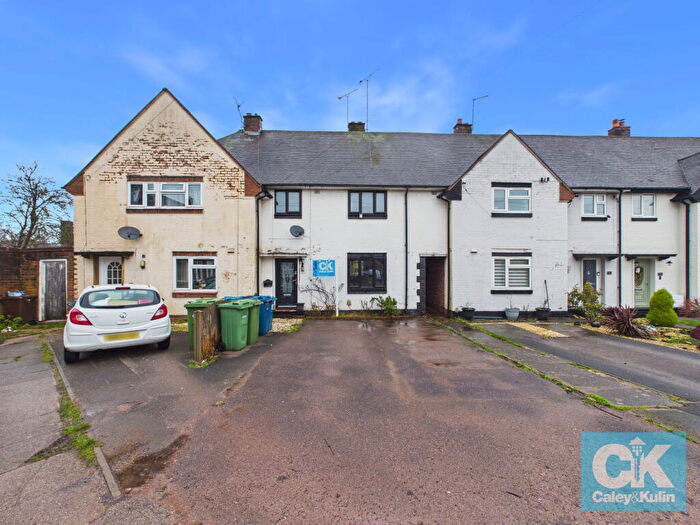
Houses for sale & to rent in Penkside, Stafford
House Prices in Penkside
Properties in Penkside have an average house price of £212,970.00 and had 121 Property Transactions within the last 3 years¹.
Penkside is an area in Stafford, Staffordshire with 1,838 households², where the most expensive property was sold for £690,000.00.
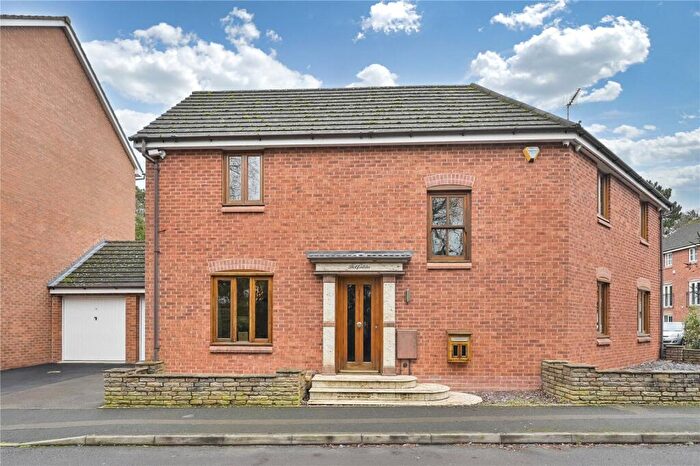
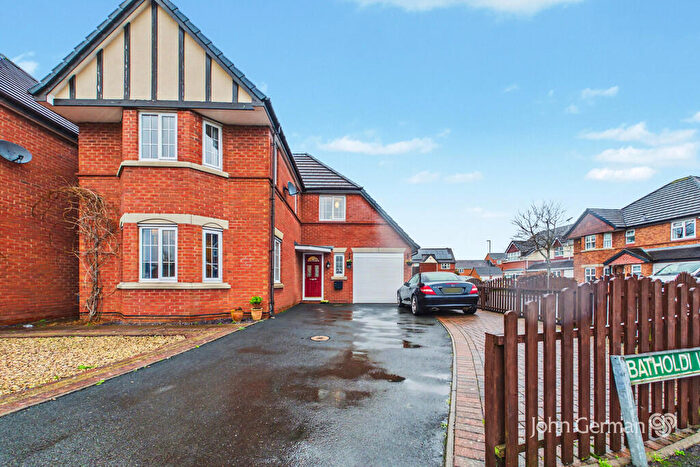
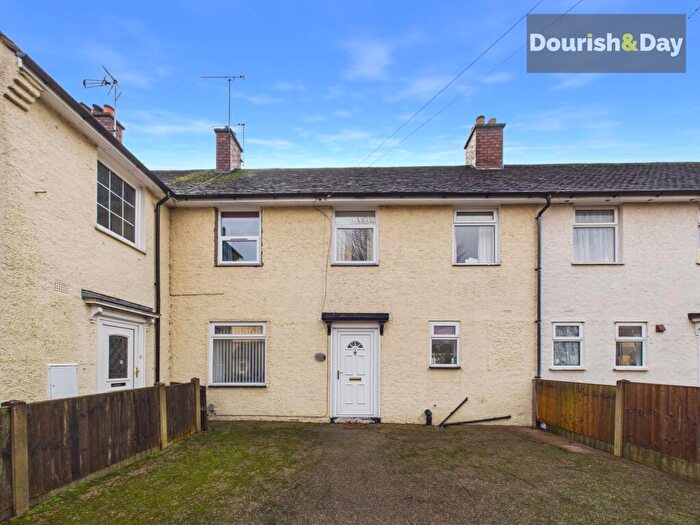
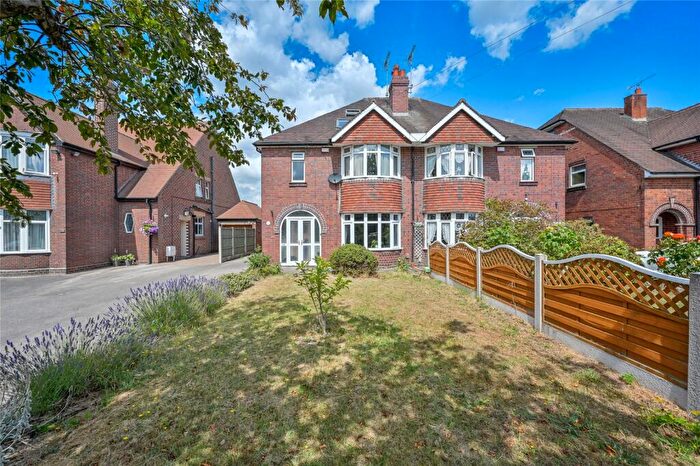
Properties for sale in Penkside
Roads and Postcodes in Penkside
Navigate through our locations to find the location of your next house in Penkside, Stafford for sale or to rent.
| Streets | Postcodes |
|---|---|
| Abbey Close | ST17 4XY |
| Barbary Grange | ST17 4NS |
| Basil Close | ST17 4UW |
| Batholdi Way | ST17 4XP |
| Blossom Gardens | ST17 4FF |
| Brent Close | ST17 4XQ |
| Bridge Gardens | ST17 4GA |
| Catalan Close | ST17 4XS |
| Church Close | ST17 4HN |
| Daimler Close | ST17 4XX |
| Daurada Drive | ST17 4XW |
| Exeter Street | ST17 4EB ST17 4ED ST17 4EE ST17 4EF ST17 4EG |
| Fennel Drive | ST17 4UN |
| Ferry Farm Drive | ST17 4JE |
| Forest Drive | ST17 4FN |
| Hainer Close | ST17 4XH |
| Hinton Close | ST17 4HP |
| Jupiter Way | ST17 4YF |
| Kamienna Close | ST17 4JY |
| Lancaster Road | ST17 4PF |
| Landstone Road | ST17 4XT |
| Lion Way | ST17 4YE |
| Mallard Avenue | ST17 4JS |
| Meadow Court | ST17 4JP |
| Meadow Road | ST17 4JQ |
| Meadow Way | ST17 4NT |
| Old Rickerscote Lane | ST17 4HG |
| Peach Avenue | ST17 4EQ |
| Perrin Close | ST17 4EJ |
| Pintail Close | ST17 4JR |
| Pioneer Way | ST17 4JF |
| Plant Crescent | ST17 4EH |
| Primrose Gardens | ST17 4FJ |
| Prospect Place | ST17 4HZ |
| Quantico Close | ST17 4LB |
| Queensville Retail Park | ST17 4SU |
| Rhein Way | ST17 4XZ |
| Rickerscote | ST17 4HA ST17 4HF |
| Rickerscote Avenue | ST17 4EY ST17 4EZ |
| Rickerscote Hall Lane | ST17 4HY |
| Rickerscote Road | ST17 4EX ST17 4HB ST17 4HE ST17 4JA |
| Romesco Way | ST17 4XJ |
| Rosemary Avenue | ST17 4UP |
| Savoureuse Drive | ST17 4XU |
| School Lane | ST17 4HQ ST17 4HR |
| School Lane Close | ST17 4HH |
| Sidney Avenue | ST17 4EL ST17 4EN ST17 4EP ST17 4EW |
| Silkmore Crescent | ST17 4JL |
| Silkmore Lane | ST17 4JB ST17 4JD ST17 4JH ST17 4JN |
| St Peters Close | ST17 4SN |
| St Peters Gardens | ST17 4HD ST17 4HJ ST17 4HL ST17 4HW |
| Tarragona Drive | ST17 4XR |
| The Brandons | ST17 9EZ |
| Tyria Way | ST17 4YB |
| Vauban Drive | ST17 4LD |
| Virginia Avenue | ST17 4YA |
| Washington Drive | ST17 4YD |
Transport near Penkside
-
Stafford Station
-
Penkridge Station
-
Hednesford Station
-
Rugeley Town Station
-
Rugeley Trent Valley Station
-
Cannock Station
-
Stone Station
-
Landywood Station
- FAQ
- Price Paid By Year
- Property Type Price
Frequently asked questions about Penkside
What is the average price for a property for sale in Penkside?
The average price for a property for sale in Penkside is £212,970. This amount is 22% lower than the average price in Stafford. There are 1,422 property listings for sale in Penkside.
What streets have the most expensive properties for sale in Penkside?
The streets with the most expensive properties for sale in Penkside are Catalan Close at an average of £350,000, Savoureuse Drive at an average of £345,000 and Mallard Avenue at an average of £325,500.
What streets have the most affordable properties for sale in Penkside?
The streets with the most affordable properties for sale in Penkside are Old Rickerscote Lane at an average of £65,000, Daurada Drive at an average of £95,000 and Plant Crescent at an average of £135,833.
Which train stations are available in or near Penkside?
Some of the train stations available in or near Penkside are Stafford, Penkridge and Hednesford.
Property Price Paid in Penkside by Year
The average sold property price by year was:
| Year | Average Sold Price | Price Change |
Sold Properties
|
|---|---|---|---|
| 2025 | £209,689 | 4% |
34 Properties |
| 2024 | £202,255 | -13% |
46 Properties |
| 2023 | £227,714 | -0,5% |
41 Properties |
| 2022 | £228,832 | 10% |
59 Properties |
| 2021 | £206,949 | 7% |
76 Properties |
| 2020 | £192,376 | 5% |
37 Properties |
| 2019 | £183,257 | -3% |
68 Properties |
| 2018 | £188,099 | 8% |
62 Properties |
| 2017 | £173,990 | 6% |
72 Properties |
| 2016 | £162,948 | -1% |
86 Properties |
| 2015 | £165,010 | 8% |
48 Properties |
| 2014 | £152,038 | 6% |
52 Properties |
| 2013 | £143,166 | 3% |
40 Properties |
| 2012 | £138,810 | -7% |
34 Properties |
| 2011 | £148,088 | -6% |
30 Properties |
| 2010 | £156,746 | 14% |
47 Properties |
| 2009 | £135,006 | -8% |
54 Properties |
| 2008 | £145,556 | -15% |
41 Properties |
| 2007 | £167,454 | 6% |
71 Properties |
| 2006 | £157,347 | -3% |
133 Properties |
| 2005 | £161,694 | 20% |
102 Properties |
| 2004 | £130,036 | 8% |
112 Properties |
| 2003 | £120,215 | 22% |
124 Properties |
| 2002 | £94,328 | 6% |
125 Properties |
| 2001 | £88,694 | -1% |
67 Properties |
| 2000 | £89,204 | 7% |
136 Properties |
| 1999 | £83,346 | 33% |
57 Properties |
| 1998 | £55,798 | -6% |
34 Properties |
| 1997 | £59,203 | 24% |
40 Properties |
| 1996 | £44,787 | -23% |
33 Properties |
| 1995 | £55,267 | - |
23 Properties |
Property Price per Property Type in Penkside
Here you can find historic sold price data in order to help with your property search.
The average Property Paid Price for specific property types in the last three years are:
| Property Type | Average Sold Price | Sold Properties |
|---|---|---|
| Semi Detached House | £206,746.00 | 50 Semi Detached Houses |
| Detached House | £307,500.00 | 27 Detached Houses |
| Terraced House | £171,247.00 | 39 Terraced Houses |
| Flat | £90,200.00 | 5 Flats |

