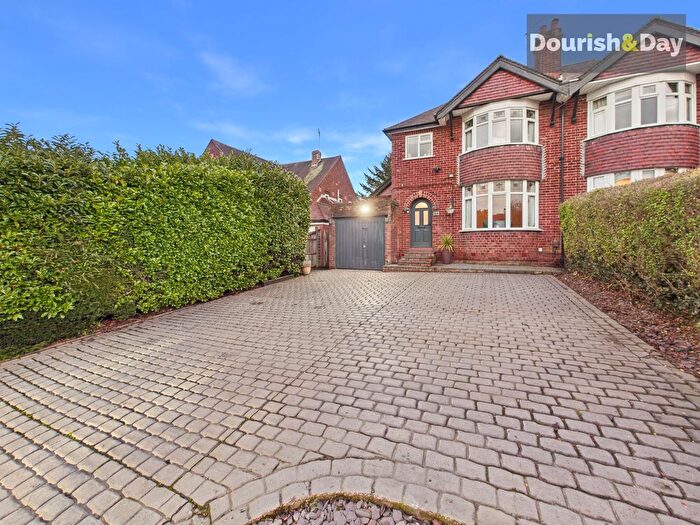
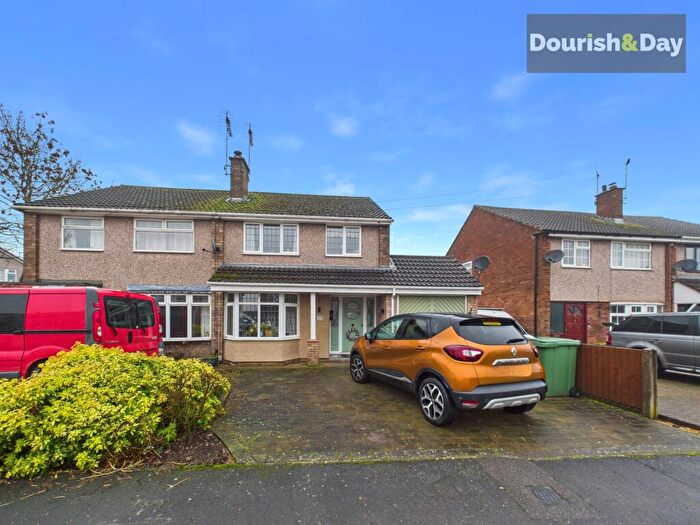
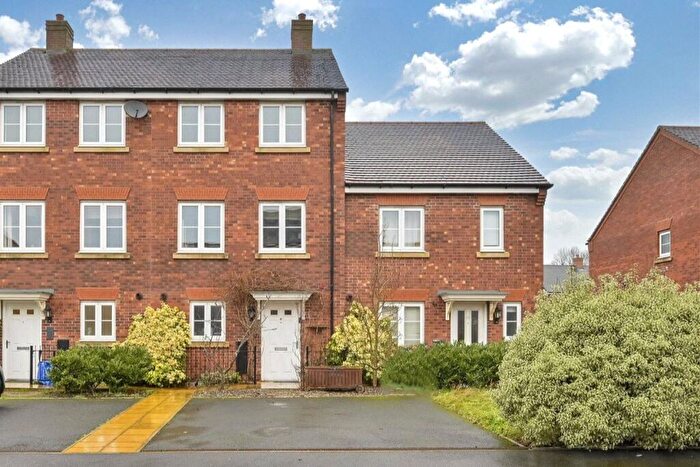
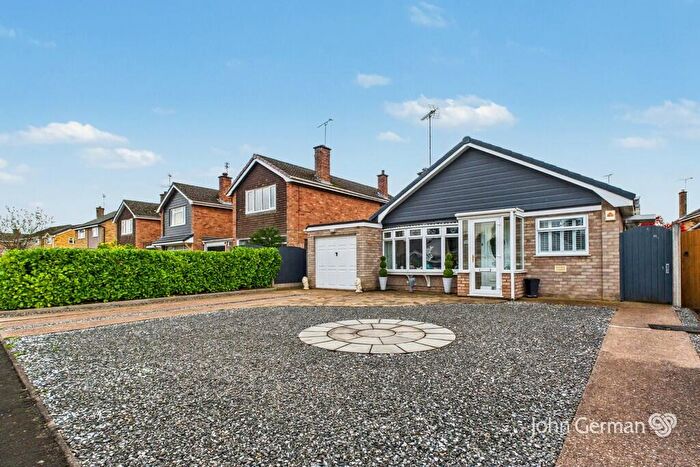
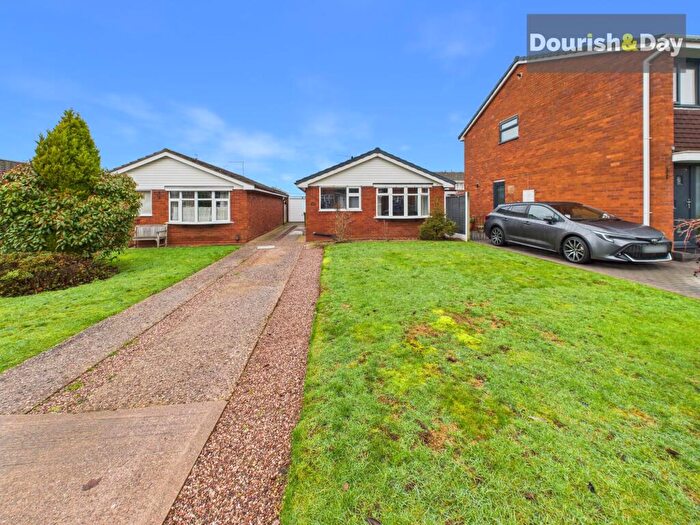
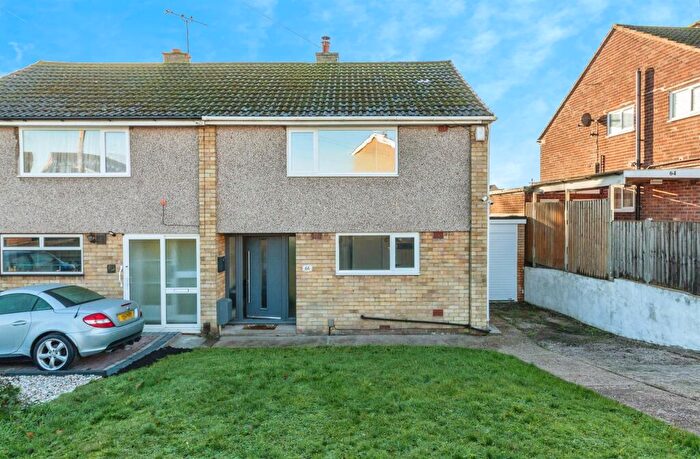
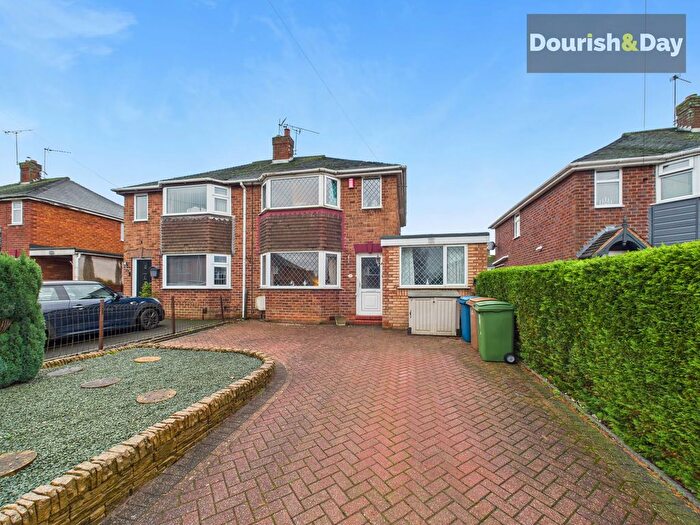
Houses for sale & to rent in Baswich, Stafford
House Prices in Baswich
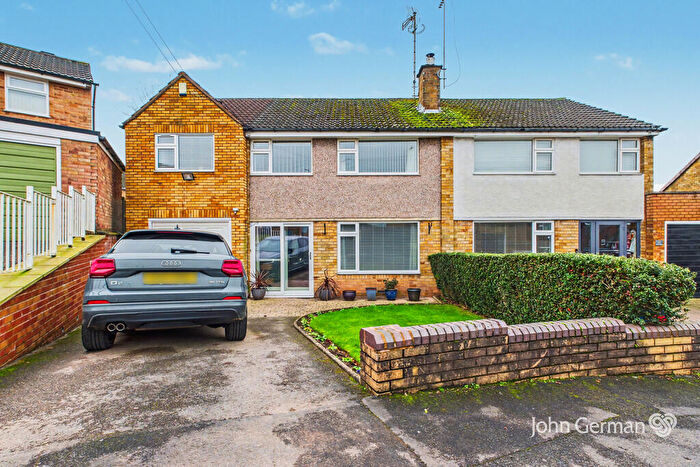
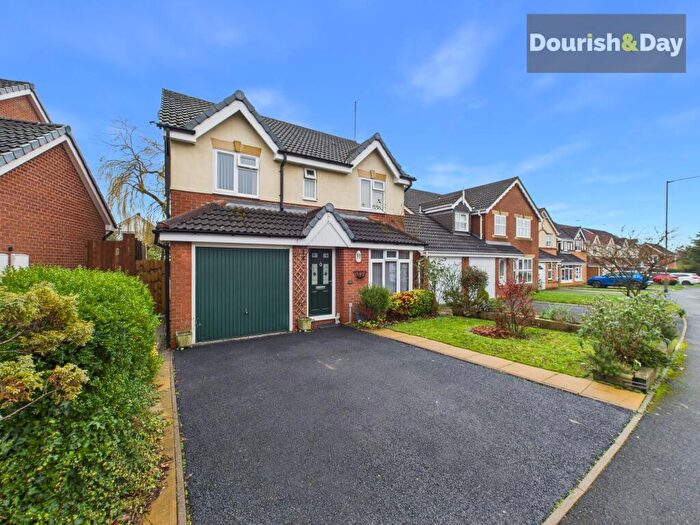
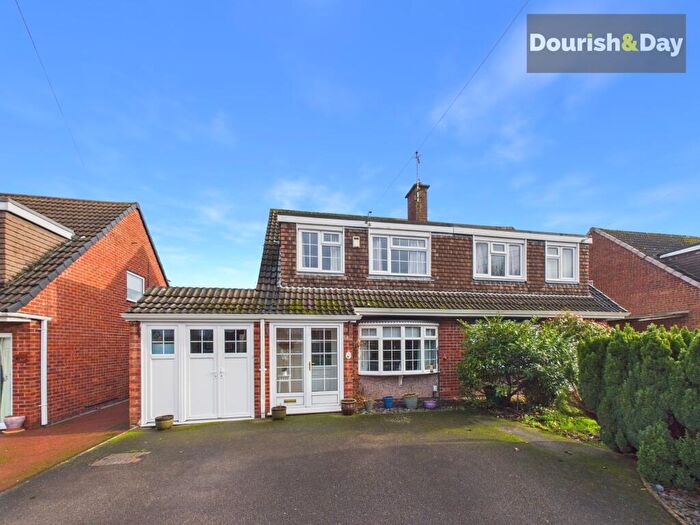
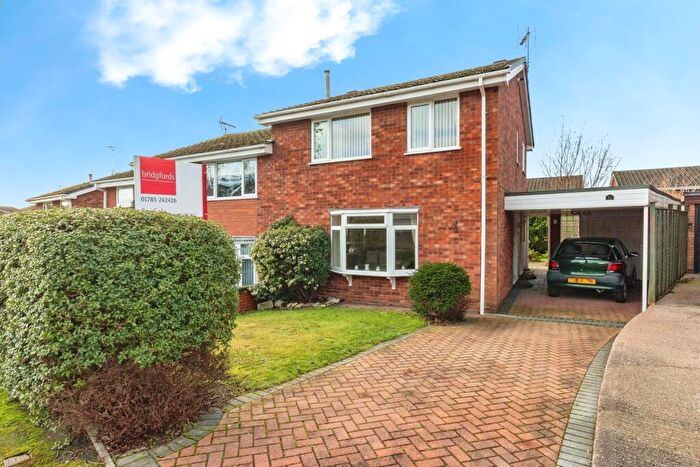
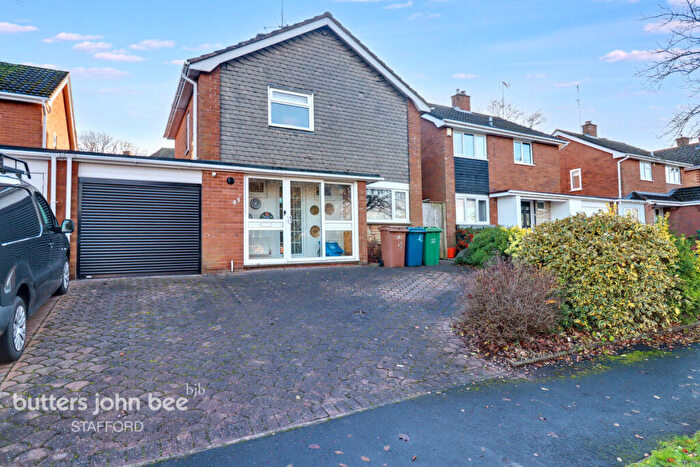
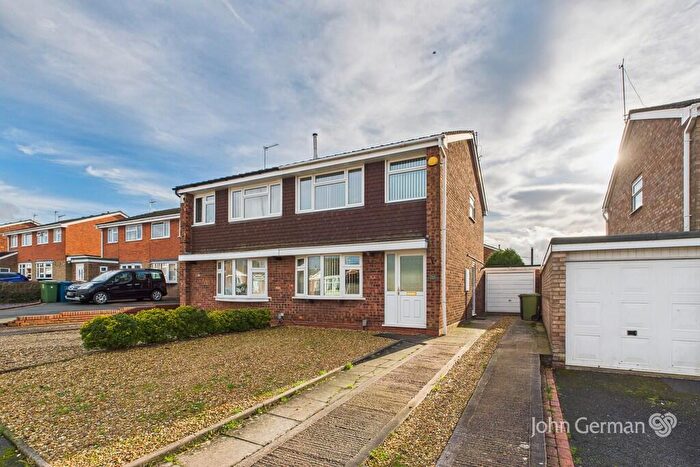
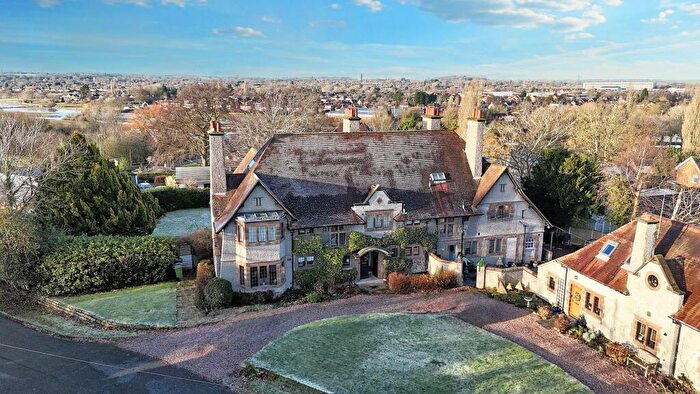
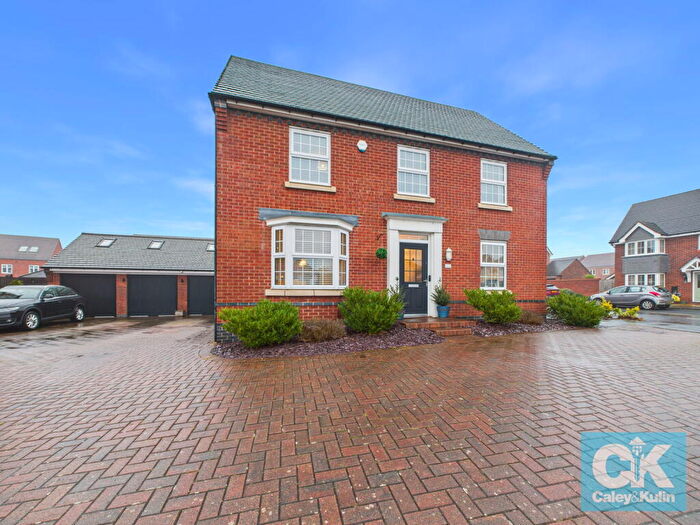
Properties in Baswich have an average house price of £301,474.00 and had 173 Property Transactions within the last 3 years¹.
Baswich is an area in Stafford, Staffordshire with 1,837 households², where the most expensive property was sold for £900,000.00.
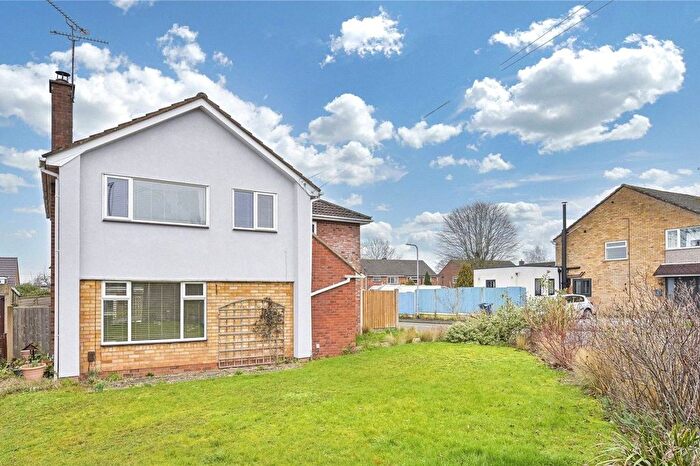
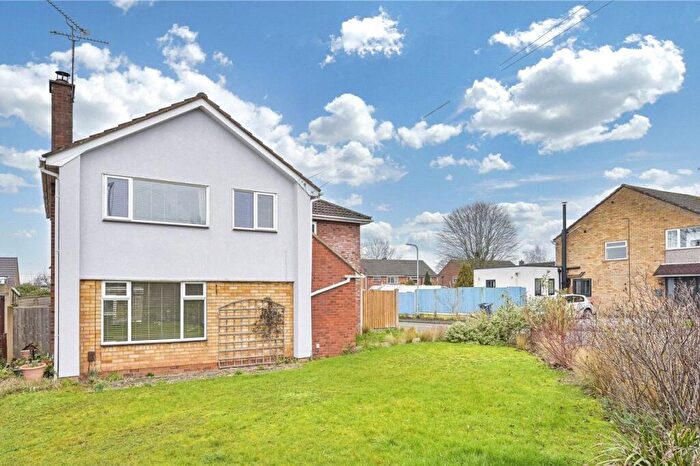
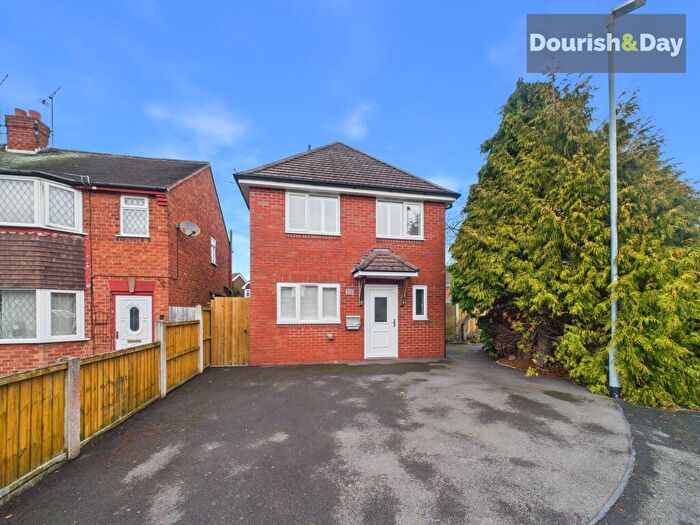
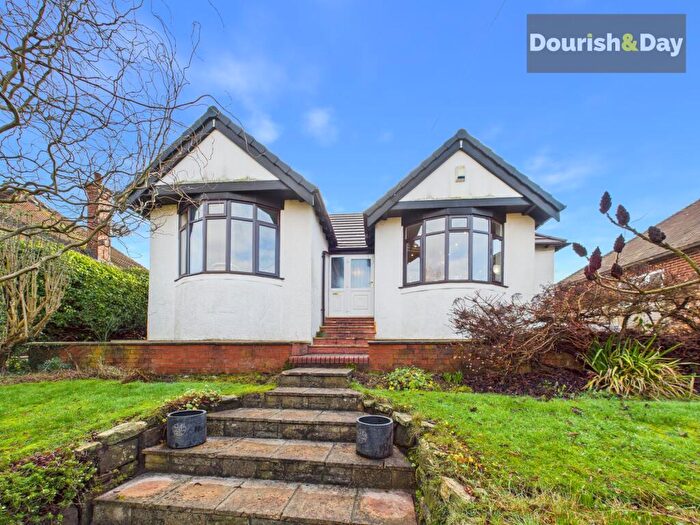
Properties for sale in Baswich
Roads and Postcodes in Baswich
Navigate through our locations to find the location of your next house in Baswich, Stafford for sale or to rent.
| Streets | Postcodes |
|---|---|
| Appledore Close | ST17 0EW |
| Babbacombe Avenue | ST17 0JD |
| Baswich Business Park | ST18 0YL |
| Baswich Crest | ST17 0HJ ST17 0HL |
| Baswich Lane | ST17 0BH ST17 0BL ST17 0BN |
| Bideford Avenue | ST17 0HB |
| Bodmin Avenue | ST17 0ED ST17 0EF ST17 0EG ST17 0EQ ST17 0ER ST17 0ES |
| Braunton Avenue | ST17 0EP |
| Brendon Close | ST17 0BJ |
| Bude Drive | ST17 0GW |
| Burford Road | ST17 0BT |
| Camborne Close | ST17 0EN |
| Camelford Close | ST17 0JE |
| Compton Road | ST17 0BS |
| Cornwall Drive | ST17 0FG ST17 0FT |
| Dawlish Avenue | ST17 0EU |
| Falmouth Avenue | ST17 0JG ST17 0JH ST17 0JQ |
| Falmouth Close | ST17 0JJ |
| Hartland Avenue | ST17 0EJ |
| Hayle Close | ST17 0GX |
| Helston Close | ST17 0GZ |
| Honiton Close | ST17 0EH |
| Lodgefield Park | ST17 0YE ST17 0YF ST17 0YU |
| Lynton Avenue | ST17 0EA |
| Newquay Avenue | ST17 0EB |
| Padstow Drive | ST17 0GY |
| Penzance Way | ST17 0FL |
| Porlock Avenue | ST17 0HR ST17 0HS ST17 0HT ST17 0HU ST17 0XY |
| Portleven Close | ST17 0ET |
| Radford Bank | ST17 4PG |
| Redruth Drive | ST17 0FJ |
| Salcombe Avenue | ST17 0HN |
| Seaton Avenue | ST17 0JB |
| Shipston Road | ST17 0BW |
| Sidmouth Avenue | ST17 0HF ST17 0HG |
| St Austell Close | ST17 0EE |
| St Ives Close | ST17 0HD |
| St Mawes Close | ST17 0HQ |
| St Michaels Close | ST17 0JA |
| Stockton Lane | ST17 0JS ST17 0JT |
| Tavistock Avenue | ST17 0HH |
| The Saltings | ST18 0YQ |
| Tilcon Avenue | ST18 0YJ |
| Tiverton Avenue | ST17 0HA |
| Torrington Avenue | ST17 0HZ ST17 0JF |
| Truro Way | ST17 0FH |
| Weeping Cross | ST17 0DF ST17 0DG ST17 0DQ |
| Widecombe Avenue | ST17 0HX |
| Witney Road | ST17 0BP ST17 0BX |
| Woodstock Road | ST17 0BU |
| Yelverton Avenue | ST17 0HE |
Transport near Baswich
-
Stafford Station
-
Penkridge Station
-
Rugeley Trent Valley Station
-
Rugeley Town Station
-
Hednesford Station
-
Cannock Station
-
Stone Station
-
Landywood Station
- FAQ
- Price Paid By Year
- Property Type Price
Frequently asked questions about Baswich
What is the average price for a property for sale in Baswich?
The average price for a property for sale in Baswich is £301,474. This amount is 10% higher than the average price in Stafford. There are 1,240 property listings for sale in Baswich.
What streets have the most expensive properties for sale in Baswich?
The streets with the most expensive properties for sale in Baswich are Weeping Cross at an average of £697,500, Stockton Lane at an average of £449,400 and Baswich Lane at an average of £443,285.
What streets have the most affordable properties for sale in Baswich?
The streets with the most affordable properties for sale in Baswich are Padstow Drive at an average of £194,000, Shipston Road at an average of £215,000 and Helston Close at an average of £215,437.
Which train stations are available in or near Baswich?
Some of the train stations available in or near Baswich are Stafford, Penkridge and Rugeley Trent Valley.
Property Price Paid in Baswich by Year
The average sold property price by year was:
| Year | Average Sold Price | Price Change |
Sold Properties
|
|---|---|---|---|
| 2025 | £302,473 | - |
52 Properties |
| 2024 | £302,509 | 1% |
60 Properties |
| 2023 | £299,606 | 1% |
61 Properties |
| 2022 | £295,711 | 19% |
61 Properties |
| 2021 | £239,557 | 5% |
71 Properties |
| 2020 | £228,428 | -8% |
56 Properties |
| 2019 | £245,937 | 8% |
59 Properties |
| 2018 | £226,098 | 4% |
79 Properties |
| 2017 | £218,055 | 7% |
70 Properties |
| 2016 | £201,959 | -4% |
87 Properties |
| 2015 | £210,332 | 1% |
69 Properties |
| 2014 | £208,883 | 13% |
81 Properties |
| 2013 | £181,108 | -2% |
52 Properties |
| 2012 | £185,052 | 2% |
44 Properties |
| 2011 | £182,224 | -6% |
53 Properties |
| 2010 | £192,944 | 8% |
70 Properties |
| 2009 | £177,033 | -4% |
57 Properties |
| 2008 | £183,785 | -7% |
50 Properties |
| 2007 | £195,969 | 2% |
81 Properties |
| 2006 | £192,952 | 12% |
93 Properties |
| 2005 | £169,347 | 4% |
87 Properties |
| 2004 | £162,386 | 9% |
64 Properties |
| 2003 | £147,611 | 19% |
98 Properties |
| 2002 | £119,588 | 18% |
154 Properties |
| 2001 | £97,666 | -0,2% |
93 Properties |
| 2000 | £97,821 | 23% |
116 Properties |
| 1999 | £75,797 | 3% |
59 Properties |
| 1998 | £73,775 | 6% |
36 Properties |
| 1997 | £69,380 | 13% |
39 Properties |
| 1996 | £60,440 | -11% |
55 Properties |
| 1995 | £67,004 | - |
34 Properties |
Property Price per Property Type in Baswich
Here you can find historic sold price data in order to help with your property search.
The average Property Paid Price for specific property types in the last three years are:
| Property Type | Average Sold Price | Sold Properties |
|---|---|---|
| Semi Detached House | £257,184.00 | 98 Semi Detached Houses |
| Detached House | £390,823.00 | 59 Detached Houses |
| Terraced House | £243,281.00 | 16 Terraced Houses |

