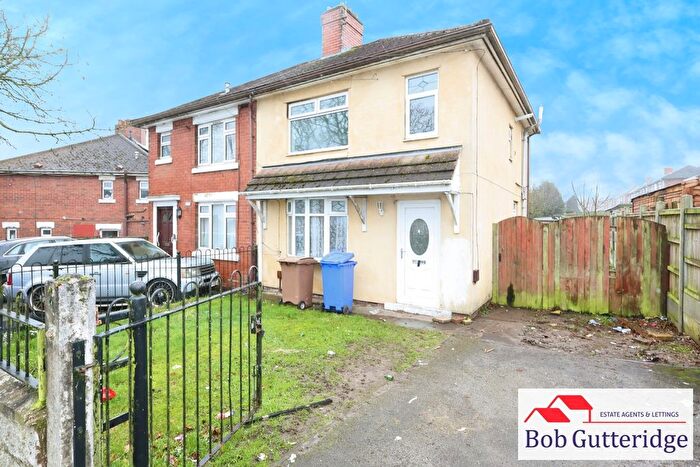
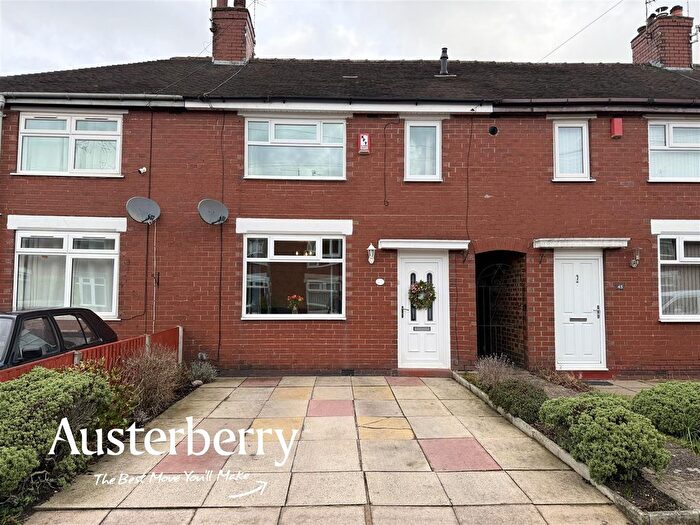
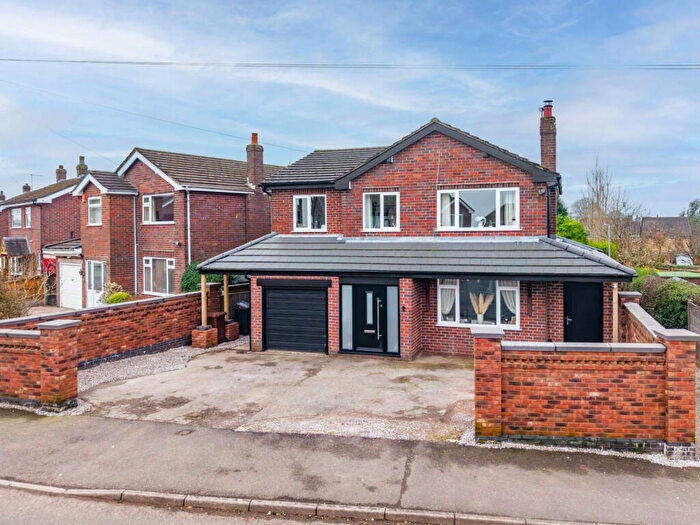
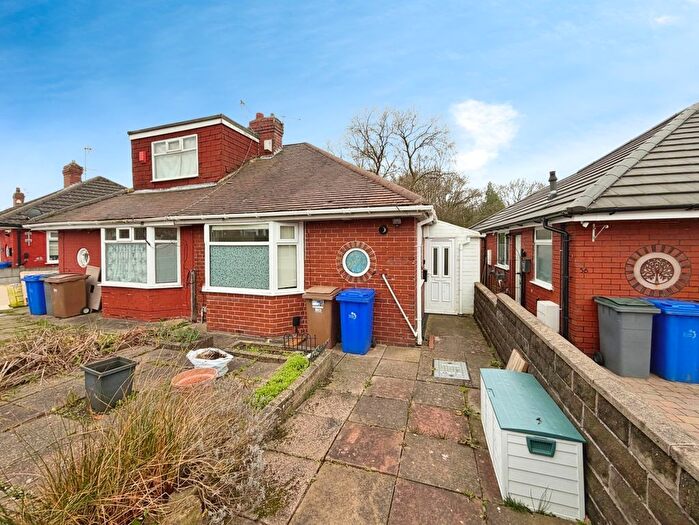
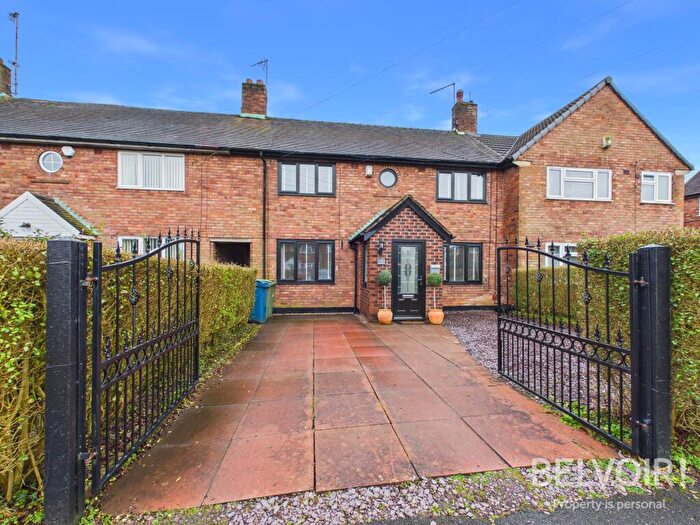
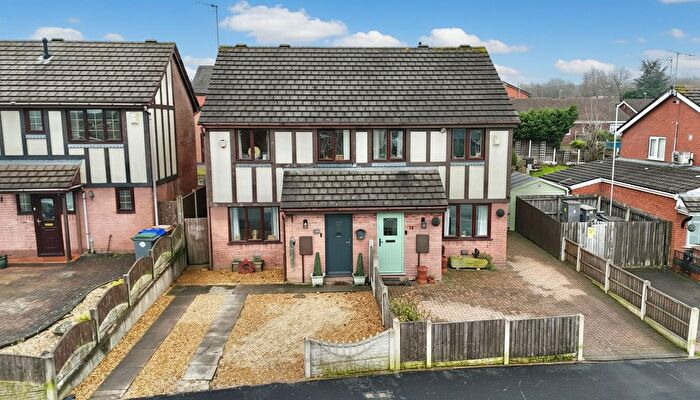
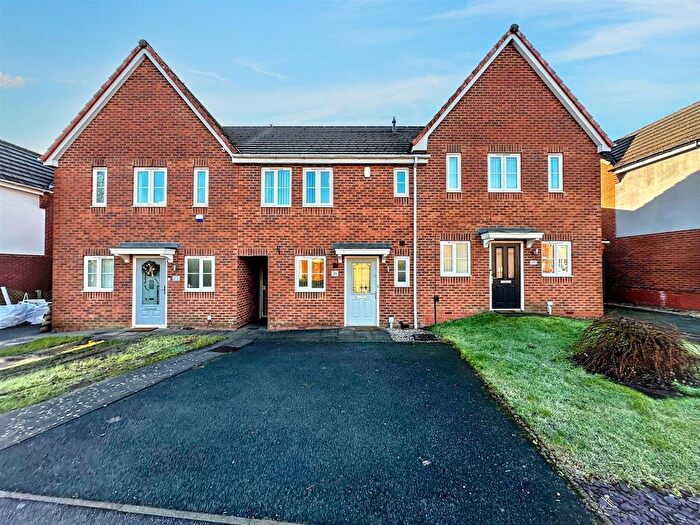
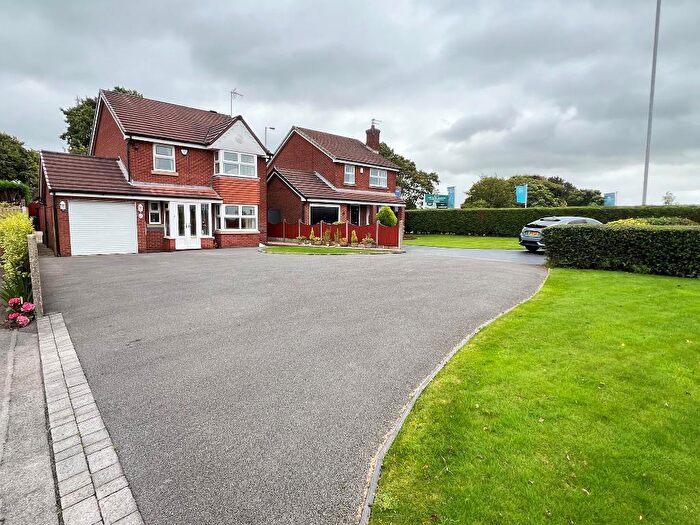
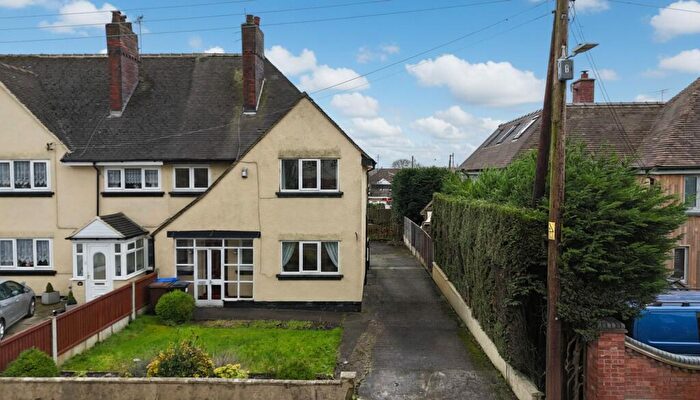
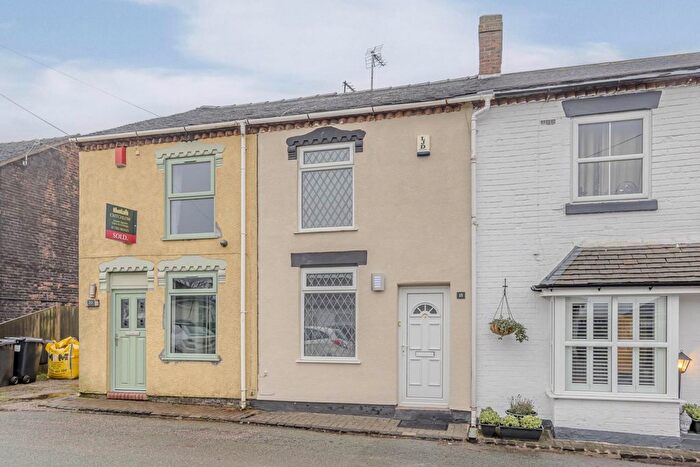
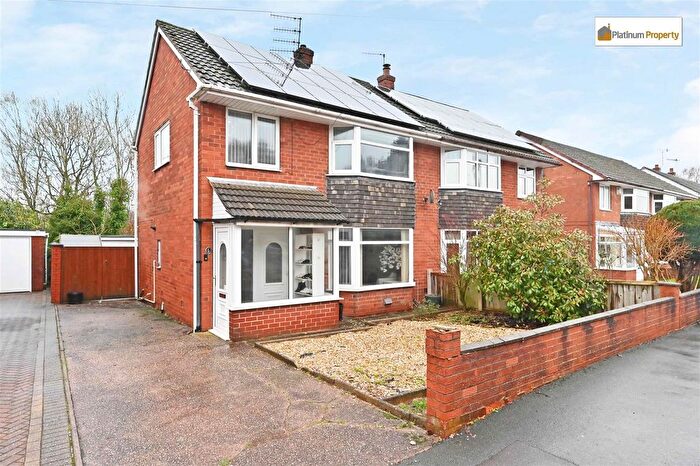
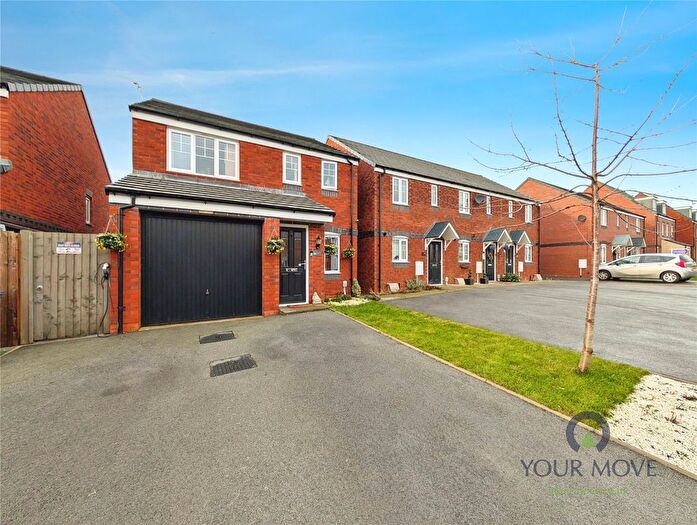
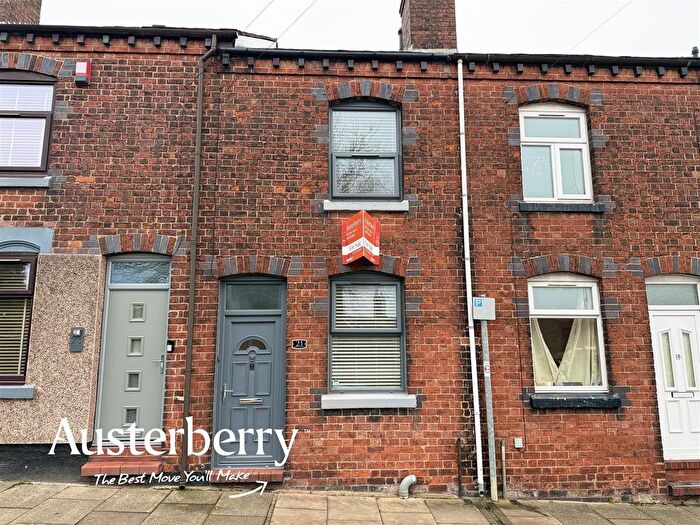
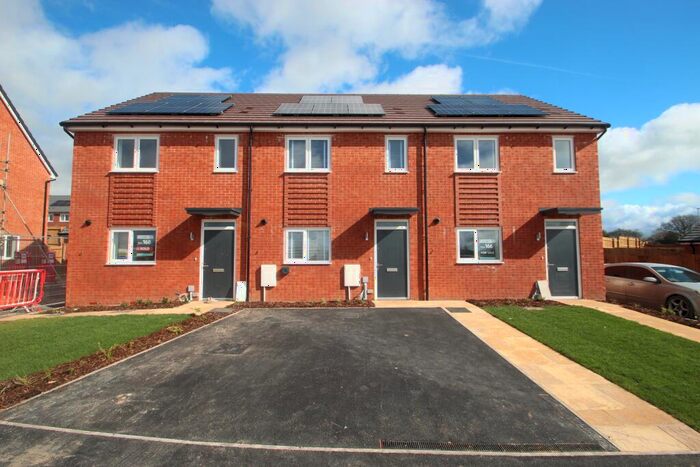
Houses for sale & to rent in Caverswall, Stoke-on-trent
House Prices in Caverswall
Properties in Caverswall have an average house price of £331,550.00 and had 40 Property Transactions within the last 3 years¹.
Caverswall is an area in Stoke-on-trent, Staffordshire with 707 households², where the most expensive property was sold for £830,000.00.
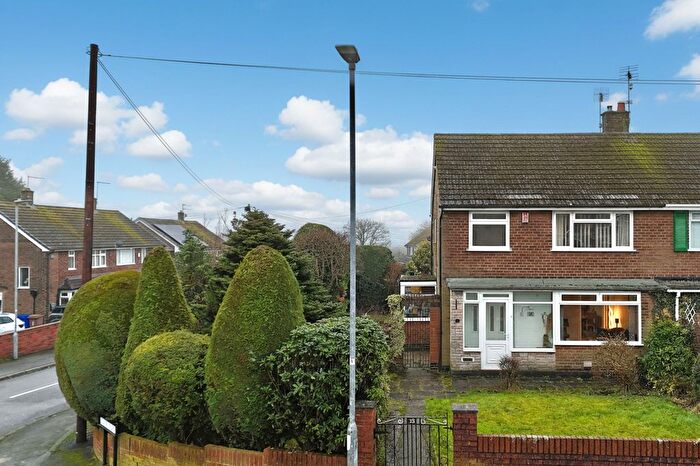
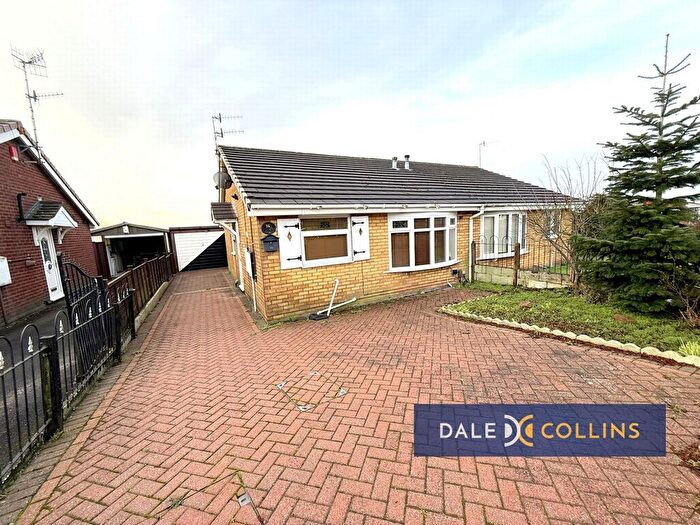
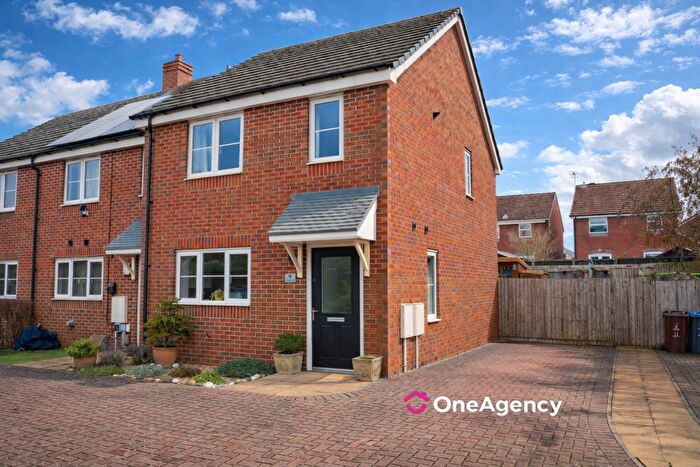
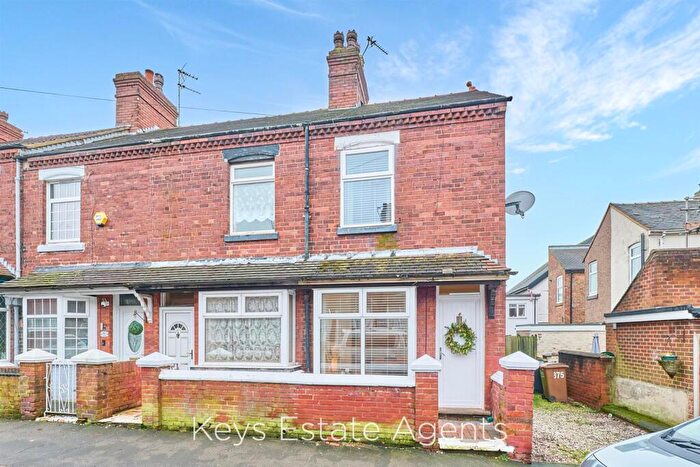
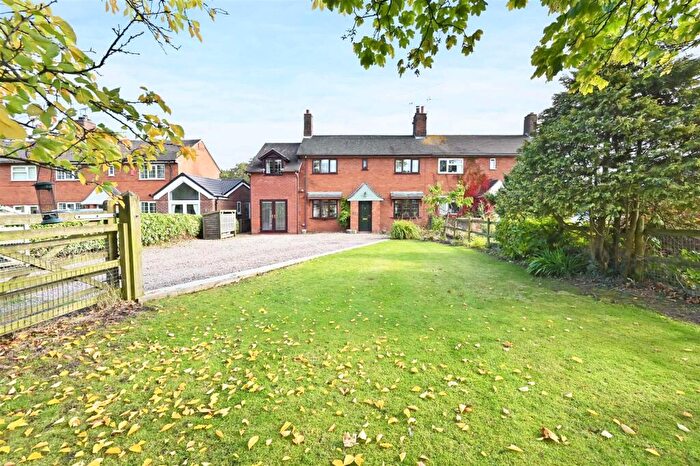
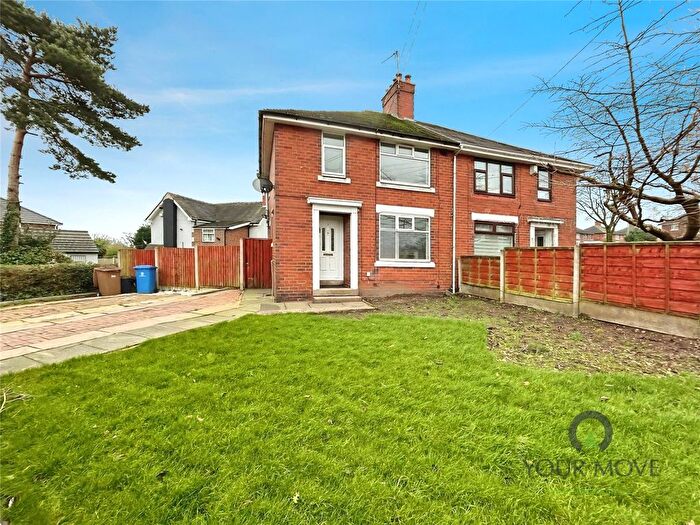
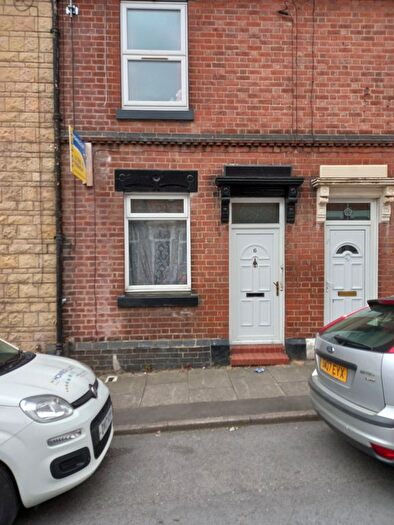
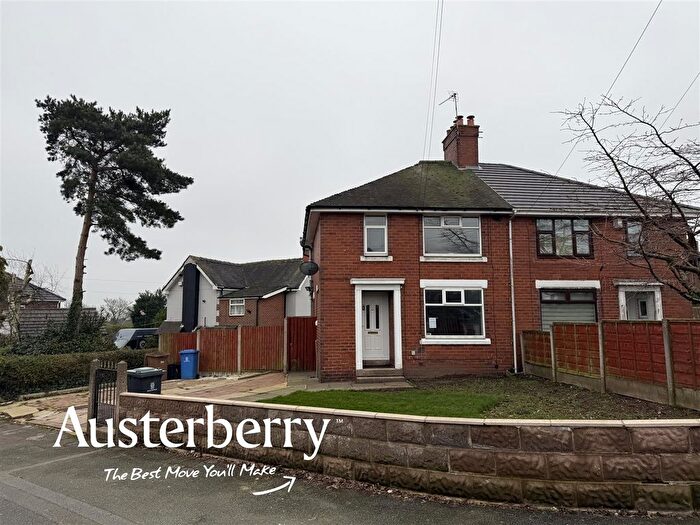
Properties for sale in Caverswall
Roads and Postcodes in Caverswall
Navigate through our locations to find the location of your next house in Caverswall, Stoke-on-trent for sale or to rent.
| Streets | Postcodes |
|---|---|
| Adderley Cottages | ST10 2NJ |
| Bank Top | ST10 2PN |
| Callow Hill Lane | ST10 2PB |
| Caverswall Common | ST11 9EU ST11 9EX |
| Caverswall Road | ST10 2PH ST10 2PZ ST11 9EL |
| Cherry Gardens | ST9 0FA |
| Church Croft | ST11 9EB |
| Church Terrace | ST11 9EA |
| Dilhorne Lane | ST10 2DX |
| Dilhorne Road | ST11 9EZ |
| Ford Hayes Lane | ST3 5BJ |
| Godley Barn Lane | ST10 2PY |
| Godley Lane | ST10 2PF |
| Grove Court | ST9 0FD |
| Halldearn Avenue | ST11 9EH |
| High Street | ST10 2PE ST11 9EF |
| Hulme Lane | ST3 5BH ST9 0DE |
| Hulme Village | ST3 5BQ |
| Kingsley Road | ST9 0DJ |
| Leek Road | ST3 5BD ST9 0DG ST9 0DQ ST3 5BE |
| Long Row | ST11 9EJ |
| March Lane | ST9 0DL ST9 0DN |
| Mill Close | ST11 9HA |
| Moss Close | ST10 2QA |
| Nathan Close | ST11 9EP |
| New Road | ST10 2PQ |
| Queens Court | ST11 9DZ |
| Roughcote Grange | ST11 9GA |
| Roughcote Lane | ST11 9EG ST11 9ES ST11 9ET |
| Salters Lane | ST9 0DA |
| Sandy Lane | ST11 9DX |
| Sarver Lane | ST10 2PD |
| School Close | ST10 2QB |
| School Lane | ST11 9EN |
| Sheepwash | ST11 9EY |
| The Common | ST10 2PA |
| The Green | ST11 9EQ |
| The Hollow | ST11 9EE |
| The Square | ST11 9ED |
| Tickhill Lane | ST10 2PL ST10 2PJ |
| Trevor Drive | ST11 9ER |
| Trimpos | ST10 2LT |
| Vicarage Crescent | ST11 9EW |
| Wallmires Lane | ST9 0DF |
| Whitehurst Lane | ST10 2PG |
| Windycote Lane | ST10 2PP |
| Winterfield Lane | ST3 5BG |
| ST3 5YL |
Transport near Caverswall
- FAQ
- Price Paid By Year
- Property Type Price
Frequently asked questions about Caverswall
What is the average price for a property for sale in Caverswall?
The average price for a property for sale in Caverswall is £331,550. This amount is 41% higher than the average price in Stoke-on-trent. There are 3,525 property listings for sale in Caverswall.
What streets have the most expensive properties for sale in Caverswall?
The streets with the most expensive properties for sale in Caverswall are Tickhill Lane at an average of £830,000, The Common at an average of £625,000 and Sheepwash at an average of £433,000.
What streets have the most affordable properties for sale in Caverswall?
The streets with the most affordable properties for sale in Caverswall are Bank Top at an average of £155,000, Vicarage Crescent at an average of £225,000 and High Street at an average of £238,333.
Which train stations are available in or near Caverswall?
Some of the train stations available in or near Caverswall are Blythe Bridge, Longton and Stoke-On-Trent.
Property Price Paid in Caverswall by Year
The average sold property price by year was:
| Year | Average Sold Price | Price Change |
Sold Properties
|
|---|---|---|---|
| 2025 | £404,653 | 31% |
13 Properties |
| 2024 | £279,583 | -11% |
12 Properties |
| 2023 | £309,766 | 13% |
15 Properties |
| 2022 | £269,147 | -16% |
17 Properties |
| 2021 | £311,963 | 20% |
29 Properties |
| 2020 | £249,200 | -6% |
15 Properties |
| 2019 | £263,657 | -2% |
14 Properties |
| 2018 | £267,850 | -8% |
20 Properties |
| 2017 | £290,538 | 13% |
13 Properties |
| 2016 | £252,938 | 7% |
25 Properties |
| 2015 | £235,172 | 21% |
23 Properties |
| 2014 | £185,211 | -1% |
21 Properties |
| 2013 | £186,863 | -10% |
11 Properties |
| 2012 | £204,655 | 14% |
19 Properties |
| 2011 | £175,887 | -41% |
16 Properties |
| 2010 | £247,546 | 27% |
15 Properties |
| 2009 | £179,960 | -31% |
15 Properties |
| 2008 | £236,500 | 19% |
6 Properties |
| 2007 | £192,643 | -36% |
22 Properties |
| 2006 | £262,908 | 28% |
17 Properties |
| 2005 | £190,265 | 4% |
13 Properties |
| 2004 | £182,840 | 32% |
27 Properties |
| 2003 | £124,821 | -9% |
16 Properties |
| 2002 | £135,830 | 34% |
21 Properties |
| 2001 | £89,584 | 10% |
32 Properties |
| 2000 | £81,022 | 17% |
27 Properties |
| 1999 | £66,848 | -8% |
20 Properties |
| 1998 | £72,422 | 25% |
20 Properties |
| 1997 | £54,322 | 6% |
18 Properties |
| 1996 | £51,018 | -20% |
10 Properties |
| 1995 | £61,400 | - |
13 Properties |
Property Price per Property Type in Caverswall
Here you can find historic sold price data in order to help with your property search.
The average Property Paid Price for specific property types in the last three years are:
| Property Type | Average Sold Price | Sold Properties |
|---|---|---|
| Semi Detached House | £263,461.00 | 13 Semi Detached Houses |
| Detached House | £455,194.00 | 18 Detached Houses |
| Terraced House | £182,611.00 | 9 Terraced Houses |

