Houses for sale & to rent in Stoke-on-trent, Staffordshire
House Prices in Stoke-on-trent
Properties in Stoke-on-trent have an average house price of £235,089.00 and had 4,301 Property Transactions within the last 3 years.¹
Stoke-on-trent is an area in Staffordshire with 48,314 households², where the most expensive property was sold for £1,300,000.00.
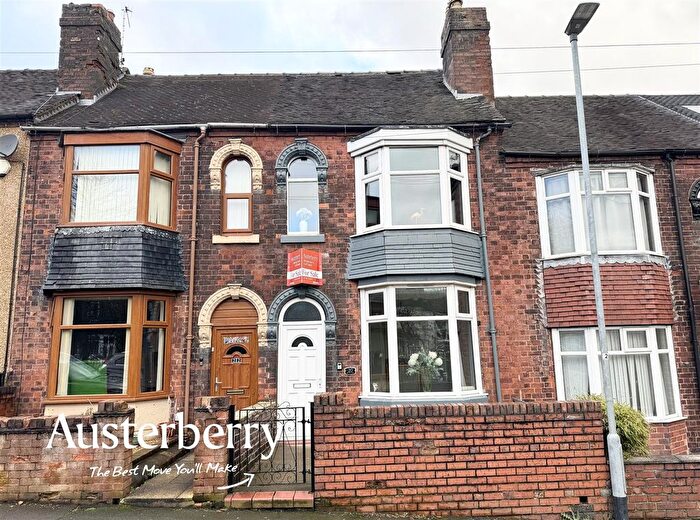
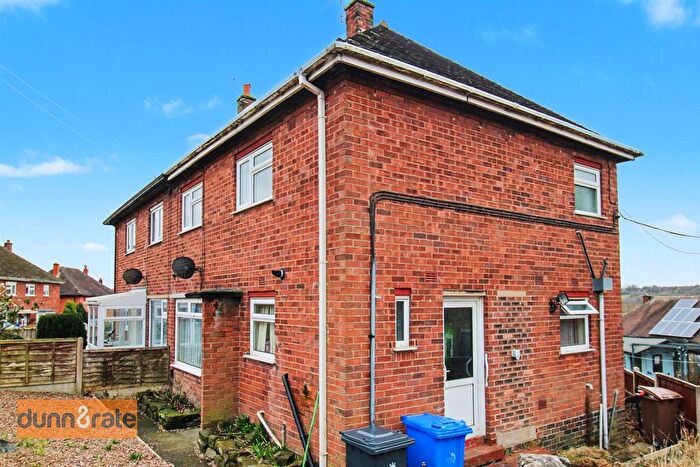
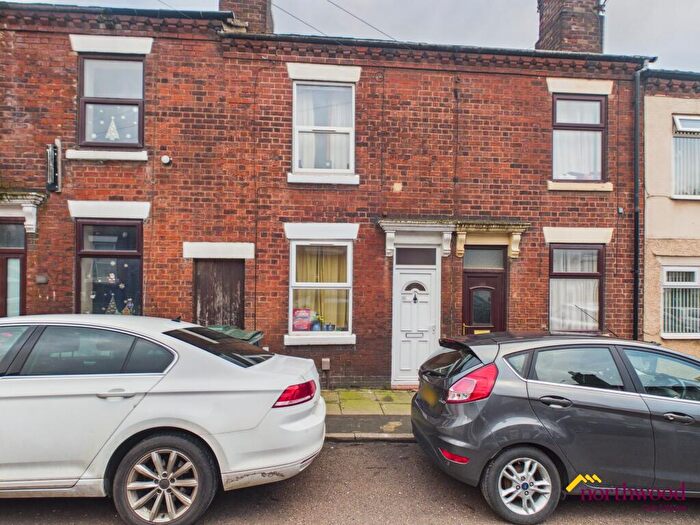
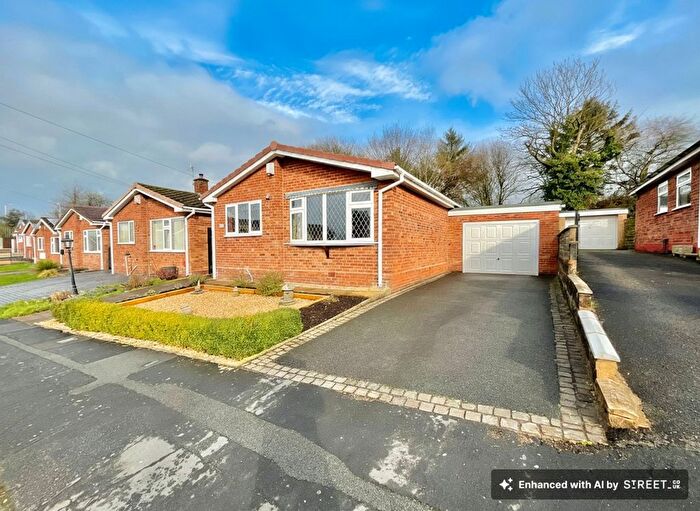
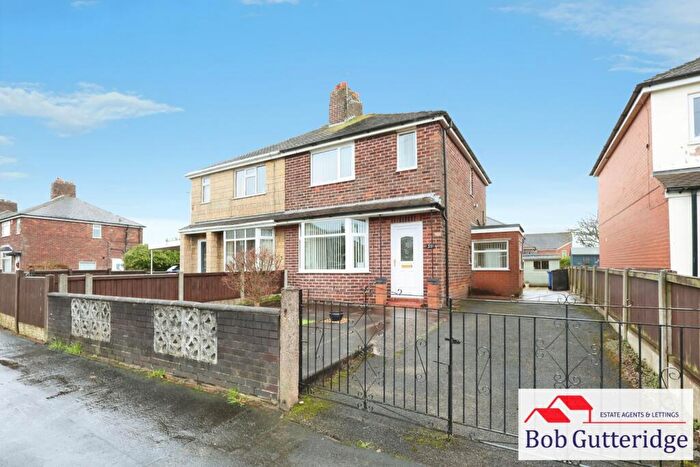
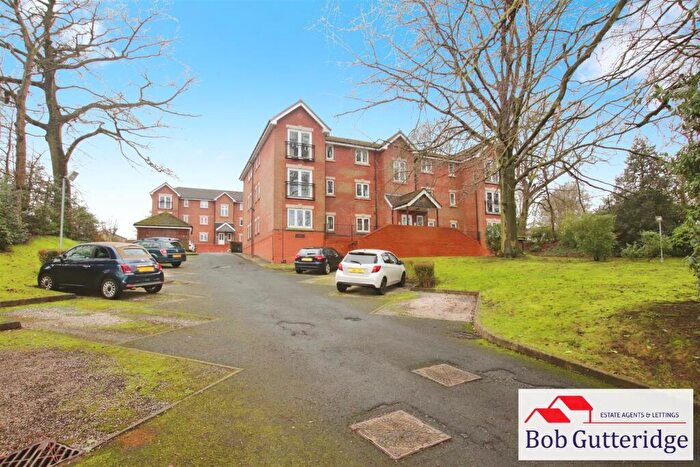
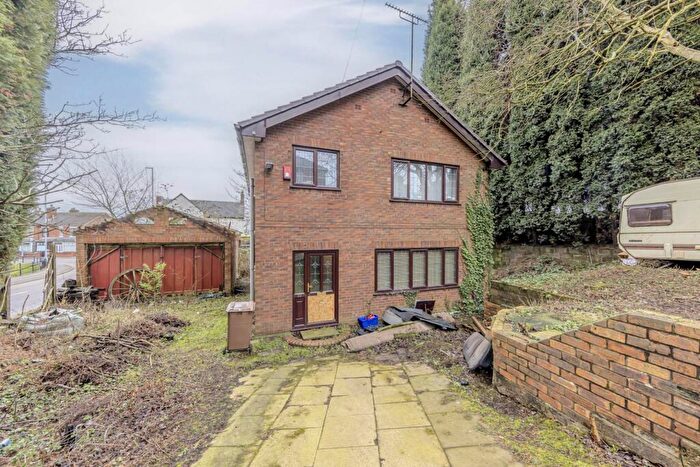
Properties for sale in Stoke-on-trent
Neighbourhoods in Stoke-on-trent
Navigate through our locations to find the location of your next house in Stoke-on-trent, Staffordshire for sale or to rent.
- Abbey
- Alton
- Audley And Bignall End
- Bagnall And Stanley
- Barlaston And Oulton
- Biddulph East
- Biddulph Moor
- Biddulph North
- Biddulph South
- Biddulph West
- Brown Edge And Endon
- Butt Lane
- Caverswall
- Cellarhead
- Cheadle North East
- Cheadle South East
- Cheadle West
- Checkley
- Cheddleton
- Churnet
- Forsbrook
- Fulford
- Halmerend
- Hamps Valley
- Horton
- Ipstones
- Kidsgrove
- Leek South
- Milwich
- Newchapel
- Ravenscliffe
- Swynnerton
- Talke
- Town
- Weaver
- Werrington
- Barlaston
- Swynnerton & Oulton
- Westbury Park & Northwood
- Kidsgrove & Ravenscliffe
- Talke & Butt Lane
- Newchapel & Mow Cop
- Lightwood North and Normacot
- Blurton West and Newstead
- Hanford and Trentham
- Hanley Park and Shelton
- Abbey Hulton and Townsend
- Eaton Park
- Bentilee and Ubberley
- Blurton East
- Dresden and Florence
- Broadway and Longton East
- Hollybush and Longton West
- Sandford Hill
- Meir Hay
- Meir South
- Weston Coyney
- Meir North
- Meir Park
- Springfields and Trent Vale
- Penkhull and Stoke
- Burslem Central
- Tunstall
- Burslem Park
- Little Chell and Stanfield
- Goldenhill and Sandyford
- Baddeley, Milton and Norton
- Great Chell and Packmoor
- Hollybush
- Meir Hay North, Parkhall & Weston Coyney
- Lightwood North & Normacot
- Hartshill Park & Stoke
- Bradwell
- Goldenhill & Sandyford
- Great Chell & Packmoor
- Little Chell & Stanfield
- Hanley Park, Joiner's Square & Shelton
- Etruria & Hanley
- Stramshall & Weaver
- Hanford, Newstead & Trentham
- Bentilee, Ubberley & Townsend
- Baddeley, Milton & Norton
- Abbey Hulton
- Longton & Meir Hay South
- Blurton
- Fenton West & Mount Pleasant
- Trent Vale & Oak Hill
- Boothen
- Penkhull & Springfields
- Moorcroft & Sneyd Green
- Burslem
Transport in Stoke-on-trent
Please see below transportation links in this area:
- FAQ
- Price Paid By Year
- Property Type Price
Frequently asked questions about Stoke-on-trent
What is the average price for a property for sale in Stoke-on-trent?
The average price for a property for sale in Stoke-on-trent is £235,089. This amount is 11% lower than the average price in Staffordshire. There are more than 10,000 property listings for sale in Stoke-on-trent.
What locations have the most expensive properties for sale in Stoke-on-trent?
The locations with the most expensive properties for sale in Stoke-on-trent are Horton at an average of £548,611, Barlaston at an average of £513,000 and Abbey at an average of £482,578.
What locations have the most affordable properties for sale in Stoke-on-trent?
The locations with the most affordable properties for sale in Stoke-on-trent are Meir North at an average of £99,333, Sandford Hill at an average of £113,500 and Lightwood North and Normacot at an average of £120,000.
Which train stations are available in or near Stoke-on-trent?
Some of the train stations available in or near Stoke-on-trent are Longton, Stoke-On-Trent and Longport.
Property Price Paid in Stoke-on-trent by Year
The average sold property price by year was:
| Year | Average Sold Price | Price Change |
Sold Properties
|
|---|---|---|---|
| 2025 | £240,361 | 2% |
1,343 Properties |
| 2024 | £235,648 | 3% |
1,541 Properties |
| 2023 | £229,485 | -3% |
1,417 Properties |
| 2022 | £235,926 | 3% |
1,662 Properties |
| 2021 | £228,079 | 9% |
2,181 Properties |
| 2020 | £208,384 | 6% |
1,672 Properties |
| 2019 | £196,074 | 4% |
1,869 Properties |
| 2018 | £187,389 | 1% |
1,857 Properties |
| 2017 | £185,520 | 4% |
1,928 Properties |
| 2016 | £178,061 | 3% |
1,958 Properties |
| 2015 | £172,353 | 8% |
1,859 Properties |
| 2014 | £157,912 | 3% |
1,714 Properties |
| 2013 | £152,424 | 1% |
1,379 Properties |
| 2012 | £151,481 | 2% |
1,141 Properties |
| 2011 | £148,486 | -4% |
1,022 Properties |
| 2010 | £154,947 | 2% |
1,076 Properties |
| 2009 | £152,481 | -8% |
937 Properties |
| 2008 | £163,945 | -1% |
982 Properties |
| 2007 | £164,841 | 5% |
2,090 Properties |
| 2006 | £157,380 | 7% |
2,051 Properties |
| 2005 | £146,645 | 7% |
1,736 Properties |
| 2004 | £136,471 | 18% |
2,105 Properties |
| 2003 | £111,469 | 18% |
2,028 Properties |
| 2002 | £90,996 | 13% |
2,158 Properties |
| 2001 | £78,771 | 10% |
1,939 Properties |
| 2000 | £70,855 | 9% |
1,960 Properties |
| 1999 | £64,667 | 7% |
1,916 Properties |
| 1998 | £59,831 | 3% |
1,734 Properties |
| 1997 | £57,853 | 9% |
1,786 Properties |
| 1996 | £52,819 | 1% |
1,591 Properties |
| 1995 | £52,313 | - |
1,481 Properties |
Property Price per Property Type in Stoke-on-trent
Here you can find historic sold price data in order to help with your property search.
The average Property Paid Price for specific property types in the last three years are:
| Property Type | Average Sold Price | Sold Properties |
|---|---|---|
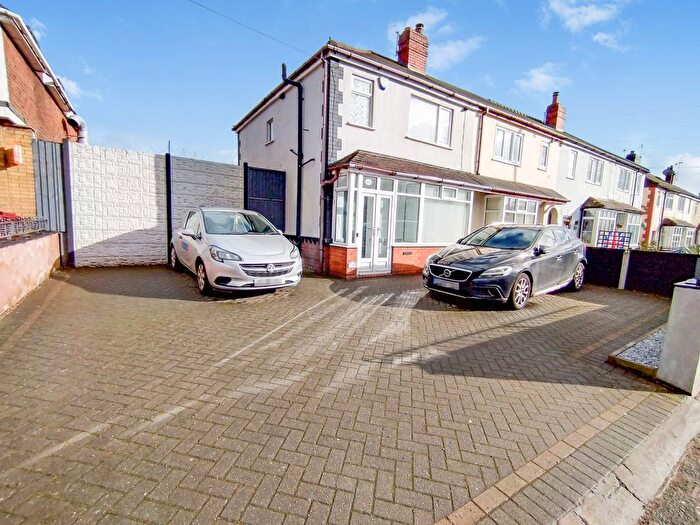
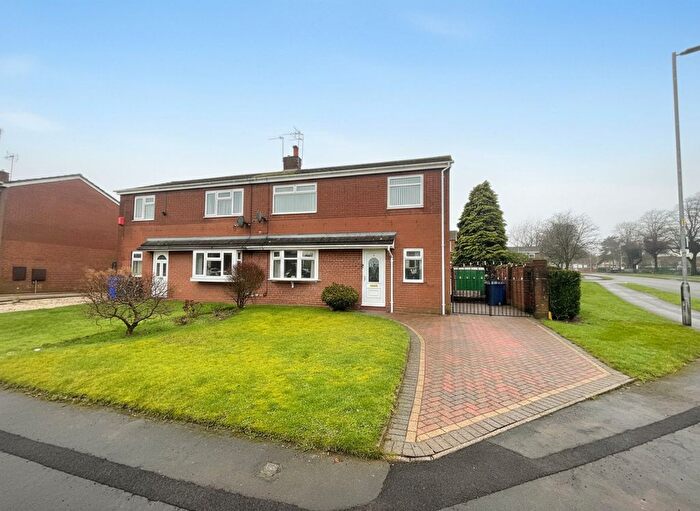
| Semi Detached House | £200,957.00 | 1,927 Semi Detached Houses |
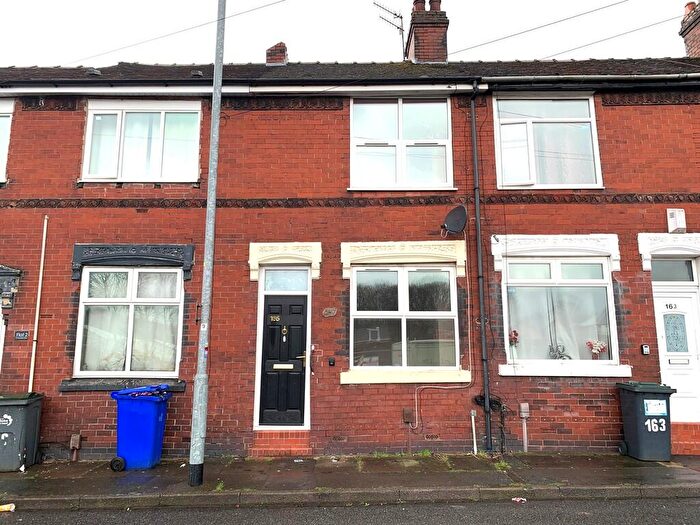
| Terraced House | £152,449.00 | 824 Terraced Houses |
| Detached House | £334,438.00 | 1,455 Detached Houses |
| Flat | £122,608.00 | 95 Flats |

